www.ocean-sci.net/10/683/2014/ doi:10.5194/os-10-683-2014
© Author(s) 2014. CC Attribution 3.0 License.
Impact of a 30 % reduction in Atlantic meridional overturning
during 2009–2010
H. L. Bryden1, B. A. King2, G. D. McCarthy2, and E. L. McDonagh2
1National Oceanography Centre Southampton, University of Southampton, Empress Dock, Southampton, UK 2National Oceanography Centre, Southampton, Empress Dock, Southampton, UK
Correspondence to: H. L. Bryden ([email protected])
Received: 12 February 2014 – Published in Ocean Sci. Discuss.: 6 March 2014 Revised: 10 June 2014 – Accepted: 12 June 2014 – Published: 6 August 2014
Abstract. The Atlantic meridional overturning circulation comprises warm upper waters flowing northward, becoming colder and denser until they form deep water in the Labrador and Nordic Seas that then returns southward through the North and South Atlantic. The ocean heat transport asso-ciated with this circulation is 1.3 PW, accounting for 25 % of the maximum combined atmosphere–ocean heat transport necessary to balance the Earth’s radiation budget. We have been monitoring the circulation at 25◦N since 2004. A 30 % slowdown in the circulation for 14 months during 2009– 2010 reduced northward ocean heat transport across 25◦N
by 0.4 PW and resulted in colder upper ocean waters north of 25◦N and warmer waters south of 25◦N. The spatial
pat-tern of upper ocean temperature anomalies helped push the wintertime circulation 2010–2011 into record-low negative NAO (North Atlantic Oscillation) conditions with accom-panying severe winter conditions over northwestern Europe. The warmer temperatures south of 25◦N contributed to the high intensity hurricane season in summer 2010.
1 Introduction
In monitoring the Atlantic meridional overturning circu-lation (AMOC) at 25◦N within the Rapid programme
(Cunningham et al., 2007), we observe the Gulf Stream flow through Florida Straits, wind-driven Ekman transport in the surface layer and mid-ocean geostrophic flow between the Bahamas and Africa (Fig. 1). After 5 years of small variability in annual average overturning of 18.6 Sv, the overturning circulation slowed by 30 % during 2009–2010 to 12.8 Sv: the net northward warm water flow above 1000 m
decreased by 5.6 Sv and the net southward flow of cold water below 1000 m decreased by 5.6 Sv (McCarthy et al., 2012). Based on the estimated uncertainty in annual-average overturning of 1.5 Sv (Cunningham et al., 2007), this change of 5.6 Sv is significant. The observed change is also extraordinary with respect to variability in the Atlantic overturning circulation found in coupled climate model control runs (McCarthy et al., 2012). Here we quantify the strength and duration of the AMOC slowdown and show that the reduction in ocean heat transport is the main cause of changes in heat content north and south of 25◦N. We
combine the publicly available time series of the AMOC (http://www.rapid.ac.uk/rapidmoc), an analysis of ocean heat transport following established methods (Johns et al., 2011), a new climatology of North Atlantic temperature and salinity variations based on Argo profiles (ftp://ftp.noc. soton.ac.uk/pub/bak/mapping) and ship-based estimates of air–sea heat exchange (Berry and Kent, 2009; available at http://noc.ac.uk/science-technology/earth-ocean-system/ atmosphere-ocean/noc-surface-flux-dataset) as well as model-based estimates of air–sea heat flux (Dee et al., 2011).
2 Size of the event
Figure 1. (a) Schematic of Rapid monitoring system for the Atlantic
meridional overturning circulation (AMOC) at 26◦N. (b) Rapid time series transports across 26◦N since April 2004. Gulf Stream transport is derived from electromagnetic cable measurements in Florida Straits. Ekman transport is derived from ERA Interim wind estimates. Upper mid-ocean transport is derived from geostrophic velocity profiles from moored instruments across the Atlantic Ocean. The MOC transport is the sum of Gulf Stream, Ekman and upper mid-ocean transports. Black lines are 3-month low pass val-ues.
cycle from each component and then accumulate with time the deviation in transport from the 2004–2008 average for each component of the AMOC (Gulf Stream, Ekman, up-per mid-ocean and total northward upup-per ocean transport 0– 1030 m). Cumulative values are given in units of Sv years (Fig. 2) so that the size of the slowdown can be quantified as a change in AMOC transport (in Sv) and a duration (in years). The accumulated transport deficit reaches 6.3 Sv years in June 2010, it levels out through the remainder of 2010, and later in 2011 it increases as part of a long-term decline in the AMOC as documented by Smeed et al. (2014). Here we concentrate on the 2009–2010 event and conclude that the AMOC slowdown of 5.6 Sv persisted for about 1.1 years.
The cumulative values naturally oscillate with small am-plitude about zero for the first 5 years which define the “normal” AMOC. In early 2009, the mid-ocean recircula-tion representing the southward flow of thermocline waters across the basin appears to strengthen; later in 2009 and early in 2010 the northward Gulf Stream and Ekman transports weaken. The increased southward recirculation starts earlier, lasts longer and accounts for more than half of the slowdown in the AMOC. For the overall slowdown of 6.3 Sv years,
Figure 2. Accumulated Transport Anomaly during the Rapid event
starting in early 2009. The normal AMOC is defined to be the average for each component for the first 4.75 years of the array, April 2004 to December 2008, where a seasonal cycle has been subtracted from each component prior to calculating the normal AMOC. The anomaly transport at each time for each component is defined as the difference between the instantaneous transport and the “normal” transport. Anomalous transport for each component is then accumulated over time. A local maximum accumulated trans-port deficit of 6.3 Sv years is achieved on 3 June 2010.
the increased southward thermocline circulation accounts for 3.8 Sv years or 61 % of the slowdown; the reduced northward Ekman transport accounts for 1.7 Sv years or 27 % of the slowdown; and the reduced Gulf Stream flow accounts for 0.8 Sv years of 12 % of the slowdown. The reduced north-ward flow of upper waters across 25◦N is balanced by a re-duced southward flow below 1000 m. The rere-duced southward transport of cold waters occurs mainly in the Lower North Atlantic Deep Water below 3000 m depth (McCarthy et al., 2012). To the extent that the northward Gulf Stream and Ek-man transports are not very different from normal, we con-clude that during the event the southward flow compensating for the northward Gulf Stream and Ekman transports is due to more thermocline recirculation and less deep overturning circulation: more recirculation, less overturning (McCarthy et al., 2012).
The overturning circulation in which warm upper waters flow northward and cold deep waters flow southward across 25◦N is the principal mechanism transporting heat
Figure 3. Accumulated northward heat transport deficit during the
Rapid event starting in April 2009. Normal AMOC heat transport is defined as the average heat transport for the first 5 years of the array, April 2004 to December 2008, after removing a seasonal cy-cle in heat transport. The anomaly transport at each time is defined as the difference between the instantaneous transport and the “nor-mal” transport. Anomalous heat transport is then accumulated over time and a local maximum accumulated heat transport deficit of 1.45×10²²J is achieved in June 2010.
“normal” heat transport estimated for the first 4.75 years of Rapid observations. The accumulated heat transport deficit reaches a maximum of 14.5×10²¹J in June 2010 (Fig. 3). The uncertainty in heat transport is principally due to the uncertainty in overturning transport. For an event lasting 1.1 years, the error in accumulated heat transport deficit is 3.6×10²¹J (1.1 years×1.5 Sv×0.07 PW per Sv).
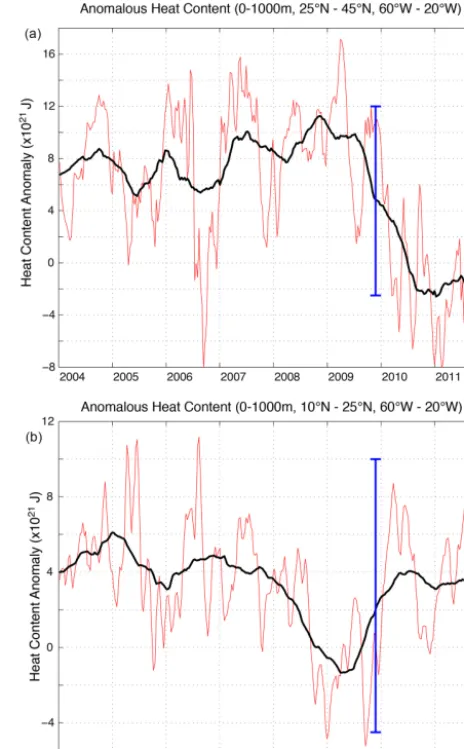
3 Impact of the slowdown on ocean heat content To examine the effects of reduced northward heat trans-port during 2009–2010, we analyse Argo float profiles in the region 10–45◦N, 60–20◦W relative to the Hy-drobase seasonal climatology (http://www.whoi.edu/science/ PO/hydrobase) so that the seasonal cycle should be re-moved. Anomaly potential temperature and salinity pro-files at 20 dbar intervals from 10 to 1990 dbar are objec-tively analysed every 10 days on a 2.5◦×2.5◦latitude, lon-gitude grid (ftp://ftp.noc.soton.ac.uk/pub/bak/mapping). We then calculate heat content anomaly by vertically integrat-ing from 1000 m depth to the surface the potential temper-ature anomaly (times density and specific heat). The heat content anomaly is noisy in space and time due to the fact that the Argo array of profiling floats has a typical horizontal scale of 300 km by 300 km so the array is not eddy-resolving. As a consequence, an Argo profile in a warm or cold eddy can have a large effect on the heat content value. Here we spatially average heat content anomaly north of 25◦N (25– 45◦N, 60–20◦W) and south of 25◦N (10–25◦N, 60–20◦W)
Figure 4. Anomalous heat content (a) north and (b) south of 25◦N. Heat content anomaly is defined as the deviation in temperature from Hydrobase seasonal climatology multiplied by density and specific heat and integrated vertically from 0 to 1000 m depth. Heat content anomaly is then integrated over 60 to 20◦W and over latitude bands 25 to 45◦N (north) and 10 to 25◦N (south). The red curves represent 30-day average heat content and the black curves are 12-month running mean values. The blue bar represents a change in heat content of 14.5×10²¹J.
and we also smooth the time series with a 12-month running mean (Fig. 4). The objective analysis procedure yields er-ror estimates for heat content anomaly at 30-day intervals that amount to 2×10²¹J for the northern or southern re-gion (see the Appendix). Considering the 50-day heat con-tent anomaly values to be independent, the error in 12-month running mean heat content is 0.7×10²¹J.
nately, there are nearly no Argo floats in the Gulf of Mexico during 2004–2010 so we cannot account for any heat con-tent changes for this substantial region immediately south of 25◦N. Overall, the reduced ocean heat transport across 25◦N during 2009–2010 is accompanied by decreased ocean heat content anomaly north of 25◦N and increased ocean heat content anomaly south of 25◦N.
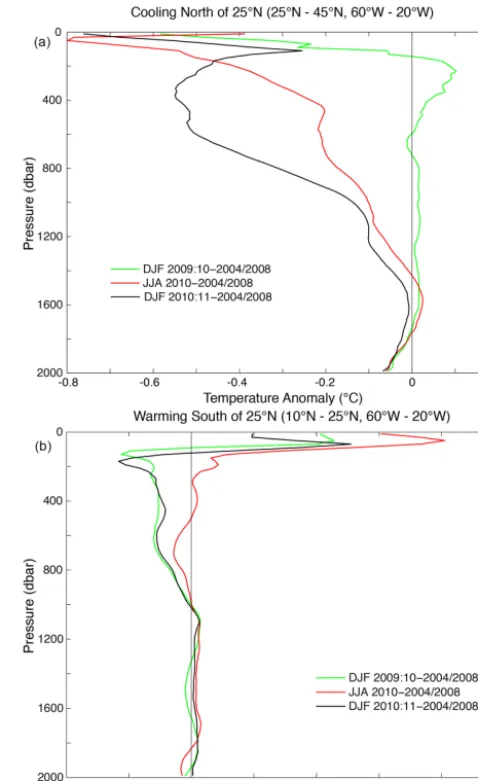
To examine the vertical structure of the change in heat content anomaly, we estimate the temperature change for the regions north and south of 25◦N for the periods
win-ter (DJF) 2009–2010, summer (JJA) 2010 and winwin-ter (DJF) 2010–2011. Based on the objective mapping, the error in the upper ocean temperature profile is about 0.04◦C for these 3-month averages north or south of 25◦N (see the Appendix). The cooling north of 25◦N reaches a maximum of 0.8◦C at 50 m depth in summer 2010 (Fig. 5a). During the win-ters north of 25◦N, maximum cooling of 0.6 to 0.7◦C oc-curs at the sea surface (Fig. 5a). South of 25◦N, the warm-ing reaches a maximum of 0.8◦C at 50 dbar in summer 2010 while the warming during the winters is a maximum of 0.5◦C at 50 dbar (Fig. 5b). Thus, for the 2009–2010 event where the accumulated heat transport deficit across 25◦N peaks in June 2010, the cooling north of 25◦N and warming south of 25◦N peak in summer 2010. As might be expected,
win-tertime cooling and warming are smaller in magnitude: the accumulated heat transport deficit in winter 2009–2010 has not yet reached its maximum and the deficit in winter 2010– 2011 has been reduced from its maximum by a small uplift in heat transport across 25◦N during July–December 2010.
As suggested by the profiles of temperature anomaly in Fig. 5, the vertical structure for changes in heat content anomaly is different for the regions north and south of 25◦N. North of 25◦N, the changes in heat content anomaly dur-ing the event penetrate down to 1000 dbar and they decrease only slowly down from the surface, amounting to 3.6×10²¹J for the interval 0–200 dbar, decreasing to 2.6×10²¹J for 400–600 dbar and to 1.2×10²¹J for 800–1000 dbar. South of 25◦N, the changes in heat content anomaly during the event are concentrated in the upper ocean, amounting to 3.4× 10²¹J for the interval 0–200 dbar, decreasing to 0.6×10²¹J for 400–600 dbar and to 0.1×10²¹J for 800–1000 dbar. The heat content anomaly changes (and hence the temperature anomaly changes) in the interval 0–200 dbar are similar in magnitude but opposite in sign north and south of 25◦N dur-ing the event.
Figure 5. Vertical structure of temperature change (a) north and (b)
south of 25◦N during winter (DJF) 2009–2010, summer (JJA) 2010 and winter (DJF) 2010–2011. The temperature change is estimated as the difference from the average vertical temperature profiles for the period April 2004 to December 2008 in the north and in the south.
4 Role of air–sea heat flux anomalies in heat content changes
Traditionally, changes in ocean heat content are attributed to changes in air–sea heat exchange. For example, the cold sea surface temperatures north of 25◦N in winter 2009–2010
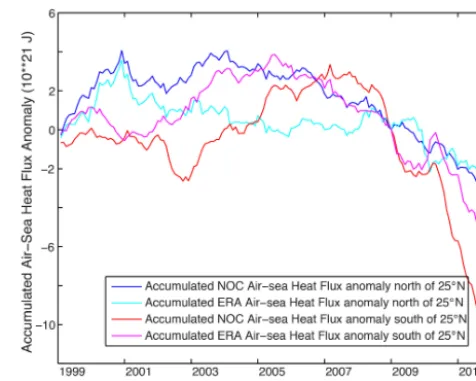
To examine the contribution of air–sea heat ex-change during the Rapid event, we analyse the NOC monthly air–sea flux climatology (Berry and Kent, 2009; http://noc.ac.uk/science-technology/earth-ocean-system/ atmosphere-ocean/noc-surface-flux-dataset) and the ERA Interim air–sea flux climatology (Dee et al., 2011). We generate average monthly air–sea heat flux for the decade from 1999–2008 at each 1◦×1◦grid point for the region 10– 45◦N, 60–20◦W and then subtract these average monthly values to create anomaly air–sea heat fluxes. We use the 10-year (1999–2008) baseline fluxes rather than the shorter 2004–2008 time period in an effort to remove the sizeable seasonal cycle in heat flux. To match the heat content analysis, we average the anomaly air–sea heat fluxes north of 25◦N and south of 25◦N and accumulate the anomalies since 1999 (Fig. 6). The pattern of anomaly air–sea heat fluxes is similar for the NOC and ERA Interim analyses with a small decline in the exchange during 2009–2011 north of 25◦N in both analyses and a larger decline in both analyses south of 25◦N during 2009–2011. A decline in anomaly air–sea flux represents anomalous cooling of the ocean.
North of 25◦N where ocean heat content anomaly de-creased by 13.5×10²¹J, anomaly air sea heat fluxes from NOC contributed a cooling of about 0.9×10²¹J during the Rapid event from January 2009 to June 2010 compared with a cooling of 1.4×10²¹J for ERA Interim. Such cooling may well be associated with the extreme negative NAO event in winter 2009–2010, but the air–sea heat flux contributes only about 10 % to the observed reduced heat content anomaly north of 25◦N. The anomalous air–sea flux cooling north of 25◦N during the event of about 1.2×10²¹J is the same size as the reduction in heat content anomaly in the upper 0–60 dbar and is a factor of 3 smaller than the reduced heat content anomaly of 3.6×10²¹J in the upper 200 dbar, which we con-sider a reasonable layer thickness over which air sea fluxes have direct effect. Thus, even for the upper ocean, the re-duction in heat content anomaly is larger than the anomalous air–sea flux cooling during the event. Hence we conclude that the cold upper ocean temperatures over the northern subtrop-ics north of 25◦N in winter 2009–2010 are primarily due to the slowdown in the AMOC and not to air–sea fluxes associ-ated with the negative NAO conditions. In winter 2010–2011, cold surface temperatures north of 25◦N are due to contin-uing effects of the slowdown in the AMOC that persisted until June 2010 and their subsequent re-emergence in winter (Taws et al., 2011; the overall pattern in seasonal upper ocean temperature anomalies during the period December 2009 to February 2011 is beautifully illustrated in their Fig. 1).
South of 25◦N where ocean heat content anomaly in-creased by 5.5×10²¹J during the Rapid event, anomaly NOC air–sea heat fluxes contribute a cooling of about 3.2×10²¹J from January 2009 to June 2010 and ERA Interim anomaly heat fluxes contribute a cooling of 1.5×10²¹J. It is likely that warmer upper ocean temperatures during 2009–2010 led to the reduced warming by air–sea exchange (anomalous
Figure 6. Accumulated anomalous air–sea heat flux versus 1999–
2008 average for the NOC air–sea and ERA-Interim heat flux clima-tologies. North of 25◦N represents the area 25–45◦N, 60–20◦W; south of 25◦N represents the area 10–25◦N, 60–20◦W. Normal air–sea heat flux is defined as the averaged flux for each month over the 10-year period January 1999 to December 2008. The anomaly air–sea flux is then the difference between the monthly flux and the normal monthly flux. Anomaly heat fluxes are then accumulated over time from January 1999.
cooling) for the tropical region between 10 and 25◦N. The increase in ocean heat content anomaly in the upper ocean (0–200 dbar) of 3.4×10²¹J during the Rapid event is the same size but of opposite sign to the anomalous air–sea heat flux cooling of order 2.5×10²¹J, suggesting that the effects of the reduction in northward heat transport during the event were partially compensated by an adjustment in air–sea heat exchange. Overall for the region south of 25◦N, the reduced northward ocean heat transport across 25◦N of 14.5×10²¹J is larger than the sum of heat content anomaly increase and anomaly air–sea heat loss of 7 to 9×10²¹J. As stated earlier, the region considered here south of 25◦N does not include the Gulf of Mexico and Caribbean Sea where there were not enough Argo floats to estimate heat content change.
We do not attempt a full heat budget analysis for either region north or south of 26◦N because there is no boundary section of observational quality as good as the Rapid 26◦N section with which to measure ocean heat transport diver-gence. In a careful and impressive analysis of the northern subtropical region between 26 and 41◦N (Cunningham et al.,
rors for every ocean region. This is the inverse problem: use the principle of heat conservation along with the time history of heat content from Argo profiles and air–sea fluxes to de-rive the time-varying circulation that is necessary to conserve heat. Here we concentrate on the forward problem: how does the time-varying circulation modify the distribution of tem-perature in the North Atlantic Ocean. During the slowdown of the AMOC in 2009–2010, northward ocean heat transport across 25◦N decreased, causing temperatures in the northern
subtropics to decrease substantially (as has also been demon-strated by Cunningham et al., 2013) and temperatures in the tropics to increase. Air–sea fluxes contributed little to the ob-served temperature changes. The slowdown in the overturn-ing circulation produced the spatial pattern of cooler waters north of 25◦N and warmer waters south of 25◦N that peaked in summer 2010.
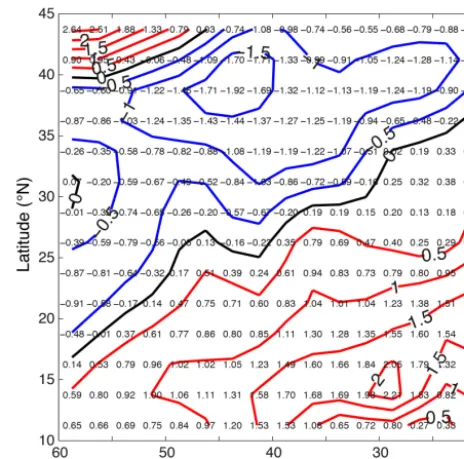
5 Response of the atmosphere to the rapid event At the end of the Rapid event in summer 2010, the temper-ature anomaly pattern at 50 m depth derived from the Argo analysis (Fig. 7) shows the impact of the 5.6 Sv slowdown in the overturning circulation over 14 months on the upper ocean temperature patterns that interact with the atmosphere. Temperatures south of 25◦N are as much as 2◦C warmer in
the tropical regions extending southwestward from Africa; maximum warming is at 15◦N 30◦W. Temperatures north of 25◦N are more than 1.5◦C colder in the northern central subtropics; maximum cooling occurs at 40◦N 42.5◦W. The contour of no change in 50 m temperature anomaly does not exactly follow 25◦N but stretches from 14◦N 60◦W (near Barbados) to 40◦N 20◦W (towards northwestern France). In this temperature pattern one can see the dipole anomaly pattern that has been suggested to re-emerge in winter 2010– 2011 to affect the winter atmospheric circulation and produce a second winter of extreme NAO negative conditions (Taws et al., 2011) Also one can see the warm upper ocean tropical temperatures along the traditional hurricane trajectory west-ward from Africa across the tropical Atlantic (Emmanuel, 1987, 2005; Goni et al., 2009) that arguably contributed to the intensity of the 2010 Atlantic hurricane season that was the strongest since 2005.
Model studies (Cassou et al., 2007; Buchan et al., 2014) have shown that the upper ocean temperature distribution as-sociated with a severe NAO-negative winter pushes the atmo-spheric circulation in the succeeding winter towards stronger negative NAO conditions. In models, the NAO-negative
Figure 7. Temperature anomaly at 50 m depth averaged for May–
July 2010 at the end of the slowdown in the AMOC.
temperature distribution in winter is a tripole pattern con-sisting of warm anomalies in the tropics south of 25◦N,
cold anomalies in the northern subtropics north of 25◦N and
6 Discussion
The slowdown in the AMOC in 2009–2010 was unantici-pated and its magnitude was exceptional compared with in-terannual variability in coupled climate models. Its origin remains uncertain 5 years on: there have been suggestions that wind stress curl variability 2 to 3 years earlier may have generated increased southward gyre flow associated with the slowdown (Duchez et al., 2014) or that ocean–atmosphere boundary conditions, partially set by the ocean thermal state, could generate the event (Roberts et al., 2013). Such efforts representing attempts to show that the atmosphere must drive all ocean variability do not yet explain why the slowdown also shows up in a reduction in the southward flow of Lower North Atlantic Deep Water below 3000 m depth, but not in a change to the southward flow of upper North Atlantic Deep Water between 1000 and 3000 m depth. The cooling south of 25◦N (Fig. 4) preceding the warming during the 2009–2010
event suggests to us that the slowdown started earlier further south. At this point in time the evidence is that the ocean ex-hibits modes of variability that are not explained by recent atmospheric forcing: the ocean has a mind of its own.
The surface temperature distribution in the Atlantic dur-ing December 2009 has previously been linked with strongly negative NAO conditions associated with severe winter weather in the UK (Taws et al., 2011; Jung et al., 2011). Here we show that the pattern of cooler waters north of 25◦N and warmer waters south of 25◦N was generated not by anomalous air–sea fluxes but by an event in the AMOC during which it was 30 % below its “normal” value for about 14 months. The slowdown in the AMOC reduced northward ocean heat transport across 25◦N by 0.4 PW, decreasing tem-peratures north of 25◦N and increasing temperatures south of 25◦N. To the extent that the upper ocean temperature spa-tial pattern nudged the atmospheric circulation into a strong NAO-negative state during winters 2010–2011 (Buchan et al., 2014) and 2009–2010, the anomalous upper ocean tem-peratures were the result of the slowdown of the AMOC, as quantified by Rapid observations at 25◦N. With ongoing
can be ignored. The best available estimate of the uncertainty of temperature at an OI grid point is given by the OI mapping error. This takes account of the variability of data that were included in the mapped estimate, and the number and spatial distribution of those data.
The heat content of a region is the sum of the individual gridded estimates. To estimate the uncertainty in heat con-tent, we need to know the quality of individual estimates, and the number of statistically independent estimates being accumulated. We examine the median over space and time, as a representative value, of the temperature mapping error. This is of order 0.2◦C at the surface, 0.17◦C over the up-per 300 m, 0.12◦C from 300 to 1400 m and 0.08◦C below 1400 m. Conservatively, we use 0.2◦C as a representative er-ror over all depths, regions and time.
The OI mapping is done with a length scale of 500 km in latitude and longitude and we assume that the mapped val-ues are independent between 700 km×700 km areas, equal
so the uncertainty in heat content for the northern region is 1.6×10²¹J (equal to
√
16.5×3.9×1020J). The region 10– 25◦N, 60–20◦W is 14.4 times larger than the independent re-gion so the uncertainty in heat content for the southern rere-gion is 1.5×10²¹J. Conservatively, we take the error for either northern or southern region to be 2×10²¹J for the 30-day average values in Fig. 4. We estimate integral timescales for the heat content time series to be 25 days so that 50-day heat content values are independent of each other and the uncer-tainty in 12-month running mean heat content is 0.7×10²¹J (equal to 2×10²¹J divided by√365/50).
For the temperature profiles in Fig. 5, the uncertainty in seasonally averaged temperature anomaly is about 0.04◦C (equal to 0.2◦C divided by
√ 16.5 or
√
14.4 and divided by √
Acknowledgements. This work formed the basis for H. L. Bryden’s Nansen Medal Lecture at the European Geosciences Union (EGU) Meeting, April 2013. H. L. Bryden thanks the EGU for awarding him the Nansen Medal and for supporting his presentation in Vienna. We thank Natural Environment Research Council (NERC) for long-term support for the analysis of the Rapid observations. B. A. King and E. L. McDonagh are supported by NERC under the MONACO project of Rapid-WATCH. G. D. McCarthy is supported by NERC under the continuing Rapid-WATCH moni-toring programme. Observations in the Rapid array along 26◦N are funded by the Natural Environment Research Council (UK) and National Science Foundation (USA) and are freely available from www.rapid.ac.uk/rapidmoc. As part of the Rapid monitoring, Florida Current transport estimates are funded by the National Oceanic and Atmospheric Administration and are available from www.aoml.noaa.gov/phod/floridacurrent. Argo profiles are freely available from www.argodatamgt.org. NOC air–sea heat fluxes are freely available from http://noc.ac.uk/science-technology/ earth-ocean-system/atmosphere-ocean/noc-surface-flux-dataset and ERA-Interim air–sea fluxes were obtained from the ECMWF Data Server.
Edited by: J. M. Huthnance
References
Berry, D. I. and Kent, E. C.: A new air-sea interaction gridded dataset from ICOADS with uncertainty estimates, B. Am. Me-teorol. Soc., 90, 645–656, 2009.
Buchan, J., Hirschi, J. J.-M., Blaker, A. T., and Sinha, B.: North Atlantic SST anomalies and the cold North European weather events of Winter 2009/10 and December 2010, Mon. Weather Rev., 142, 922–932, 2014.
Cassou, C., Deser, C., and Alexander, M. A.: Investigating the im-pact of re-emerging sea surface temperature anomalies on the winter atmospheric circulation over the North Atlantic, J. Cli-mate, 20, 3510–3526, 2007.
Cunningham, S. A., Kanzow, T., Rayner, D., Baringer, M. O., Johns, W. E., Marotzke, J., Longworth, H. R., Grant, E. M., Hirschi, J. J.-M., Beal, L. M., Meinen, C. S., and Bryden, H. L.: Temporal Variability of the Atlantic Meridional Overturning Circulation at 26.5◦N, Science, 317, 935–938, 2007.
Cunningham, S. A., Roberts, C. D., Frajka-Williams, E., Johns W. E., Hobbs, W., Palmer, M. D., Rayner, D., Smeed, D. A., and McCarthy, G.: Atlantic meridional overturning circulation slow-down cooled the subtropical ocean, Geophys. Res. Lett., 40, 6202–6207, doi:10.1002/2013GL058464, 2013.
Dee, D. P., Uppala, S. M., Simmons, A. J., Berrisford, P., Poli, P., Kobayashi, S., Andrae, U., Balmaseda, M. A., Balsamo, G., Bauer, P., Bechtold, P., Beljaars, A. C. M., van de Berg, L., Bid-lot, J., Bormann, N., Delsol, C., Dragani, R., Fuentes, M., Geer, A. J., Haimberger, L., Healy, S. B., Hersbach, H., Hólm, E. V., Isaksen, L., Kållberg, P., Köhler, M., Matricardi, M., McNally, A. P., Monge-Sanz, B. M., Morcrette, J.-J., Park, B.-K., Peubey, C., de Rosnay, P., Tavolato, C., Thépaut, J.-N., and Vitart, F.: The ERA-Interim reanalysis: Configuration and performance of the data assimilation system, Q. J. Roy. Meteorol. Soc., 137, 553– 597, 2011.
Duchez, A., Hirschi, J. J.-M., Cunningham, S. A., Blaker, A. T., Bryden, H. L., de Cuevas, B., Atkinson, C. P., McCarthy, G. D., Frajka-Williams, E., Rayner, D., Smeed, D., and Mizielinski, M. S.: A new index for the Atlantic Meridional Overturning Circu-lation at 26◦N, J. Climate, in press, 2014.
Emmanuel, K. A.: The dependence of hurricane intensity on cli-mate, Nature, 326, 483–485, 1987.
Emmanuel, K. A.: Increasing destructiveness of tropical cyclones over the past 30 years, Nature, 436, 686–688, 2005.
Goni, G., Demaria, M., Knaff, J., Sampson, C., Ginis, I., Bringas, F., Mavume, A., Lauer, C., Lin, I. I., Ali, M. M., Sandery, P., Ramos-Buarque, S., Kang, K., Mehra, A., Chassignet, E., and Halliwell, G.: Applications of satellite-derived ocean measure-ments to tropical cyclone intensity forecasting, Oceanography, 22, 190–197, 2009.
Johns, W. E., Baringer, M. O., Beal, L. M., Cunningham, S. A., Kan-zow, T., Bryden, H. L., Hirschi, J. J.-M., Marotzke, J., Meinen, C. S., Shaw, B., and Curry, R.: Continuous, array-based estimates of Atlantic Ocean heat transport at 26.5◦N, J. Climate, 24, 2429– 2449, 2011.
Jung, T., Vitart, F., Ferranti, L., and Morcrette, J.-J.: Origin and pre-dictabiity of the extreme negative NAO winter of 2009/10, Geo-phys. Res. Lett., 38, L07701, doi:10.1029/2011GL046786, 2011. Maidens, A., Arribas, A., Scaife, A. A., MacLachlan, C., Peterson, D., and Knight, J.: The influence of surface forcings on predic-tion of the North Atlantic Oscillapredic-tion regime of Winter 2010–11, Mon. Weather Rev., 141, 3801–3813, doi:10.1175/MWR-D-13-00033.1, 2013.
McCarthy, G., Frajka-Williams, E., Johns, W. E., Baringer, M. O., Meinen, C. S., Bryden, H. L., Rayner, D., Duchez, A., Roberts, C., and Cunningham, S. A.: Observed interannual variability of the Atlantic meridional overturning circulation at 26.5◦N, Geophys. Res. Lett., 39, L19609, doi:10.1029/2012/GL052933, 2012.
Osborn, T. J.: Winter 2009/2010 temperatures and a record– breaking North Atlantic Oscillation index, Weather, 66, 19–21, 2011.
Roberts, C. D., Waters, J., Peterson, K. A., Palmer, M. D., Mc-Carthy, G. D., Frajka-Williams, E., Haines, K., Lea, D. J., Mar-tin, M. J., Storkey, D., Blockley, E. W., and Zuo, H.: Atmo-sphere drives recent interannual variability of the Atlantic merid-ional overturning circulation at 26.5◦N, Geophys. Res. Lett., 40, 5164–5170, 2013.
Smeed, D. A., McCarthy, G. D., Cunningham, S. A., Frajka-Williams, E., Rayner, D., Johns, W. E., Meinen, C. S., Baringer, M. O., Moat, B. I., Duchez, A., and Bryden, H. L.: Observed decline of the Atlantic meridional overturning circulation 2004– 2012, Ocean Sci., 10, 29–38, doi:10.5194/os-10-29-2014, 2014. Taws, S. L., Marsh, R., Wells, N. C., and Hirschi, J.: Re-emerging ocean temperature anomalies in late-2010 associated with a repeat negative NAO, Geophys. Res. Lett., 38, L20601, doi:10.1029/2011GL048978, 2011.