www.atmos-meas-tech.net/8/5009/2015/ doi:10.5194/amt-8-5009-2015
© Author(s) 2015. CC Attribution 3.0 License.
Intercomparison of snowfall estimates derived from the CloudSat
Cloud Profiling Radar and the ground-based weather radar
network over Sweden
L. Norin1, A. Devasthale1, T. S. L’Ecuyer2, N. B. Wood3, and M. Smalley2
1Atmospheric Remote Sensing Unit, Research Department, Swedish Meteorological and Hydrological Institute, Norrköping, Sweden
2Department of Atmospheric and Oceanic Sciences, University of Wisconsin-Madison, Madison, Wisconsin, USA 3Cooperative Institute for Meteorological Satellite Studies, University of Wisconsin-Madison, Madison, Wisconsin, USA Correspondence to: L. Norin ([email protected])
Received: 10 July 2015 – Published in Atmos. Meas. Tech. Discuss.: 6 August 2015 Revised: 17 November 2015 – Accepted: 20 November 2015 – Published: 1 December 2015
Abstract. Accurate snowfall estimates are important for both weather and climate applications. Ground-based weather radars and space-based satellite sensors are often used as vi-able alternatives to rain gauges to estimate precipitation in this context. In particular, the Cloud Profiling Radar (CPR) on board CloudSat is proving to be a useful tool to map snow-fall globally, in part due to its high sensitivity to light precip-itation and its ability to provide near-global vertical struc-ture. CloudSat snowfall estimates play a particularly impor-tant role in the high-latitude regions as other ground-based observations become sparse and passive satellite sensors suf-fer from inherent limitations.
In this paper, snowfall estimates from two observing sys-tems – Swerad, the Swedish national weather radar net-work, and CloudSat – are compared. Swerad offers a well-calibrated data set of precipitation rates with high spatial and temporal resolution, at very high latitudes. The measure-ments are anchored to rain gauges and provide valuable in-sights into the usefulness of CloudSat CPR’s snowfall esti-mates in the polar regions. In total, 7.2×10⁵ matchups of CloudSat and Swerad observations from 2008 through 2010 were intercompared, covering all but the summer months (June to September). The intercomparison shows encour-aging agreement between the two observing systems de-spite their different sensitivities and user applications. The best agreement is observed when CloudSat passes close to a Swerad station (46–82 km), where the observational condi-tions for both systems are comparable. Larger disagreements outside this range suggest that both platforms have difficulty
with shallow snow but for different reasons. The correlation between Swerad and CloudSat degrades with increasing dis-tance from the nearest Swerad station, as Swerad’s sensitiv-ity decreases as a function of distance. Swerad also tends to overshoot low-level precipitating systems further away from the station, leading to an underestimation of snowfall rate and occasionally to missing precipitation altogether. Several sta-tistical metrics – including the probability of detection, false alarm rate, hit rate, and Pierce’s skill score – are calculated. The sensitivity of these metrics to the snowfall rate, as well as to the distance from the nearest radar station, are sum-marised. This highlights the strengths and the limitations of both observing systems at the lower and upper ends of the snowfall distributions as well as the range of uncertainties that can be expected from these systems in high-latitude re-gions.
1 Introduction
weather prediction models. Characterising snowfall at sub-daily to sub-daily scales is of great societal value. For example, heavy snowfall caused by a convective snow-band event can completely blanket the transportation infrastructure, leading to traffic chaos. For high-latitude countries like Sweden, the timely information on snowfall helps in planning daily com-munal services as well as to better manage tourism and agri-cultural industries. Ground-based weather radars are most commonly used to monitor precipitation for such weather ap-plications.
From the climate perspective, better understanding of snowfall is also warranted (Waliser et al., 2011). For ex-ample, variability in snowfall directly influences variations in surface albedo and temperature and thus has a profound impact on surface radiation balance. Snow cover also im-pacts surface–air interactions by regulating heat and mass ex-changes. Snowfall further has far-reaching impacts via tele-connections. For example, the variability in Eurasian snow cover has been shown to influence Asian monsoon rainfall (Liu and Yanai, 2002), and changes in snow cover onset over Siberia have been reported to influence Southeast Asian monsoon rainfall (Ye et al., 2005). Other studies argue that the increased snowfall over the Himalayas leads to a reduc-tion in Indian monsoon rainfall (Turner and Slingo, 2011), mainly due to increased reflection and cooling of the sur-face, leading to weakened land–sea thermal contrast, which is considered an important trigger for the strength of mon-soonal circulation. During spring, melting snow regulates the surface and river run-off in catchments. Hence long-term changes in snowfall characteristics directly impact the hydro-logical cycle at a regional scale.
The need for snowfall measurements over large regions is often met by using ground-based radar systems. Space-based remote sensing is often used, either as a viable alternative or in combination with ground-based measurements, to monitor precipitation for climate applications. Microwave imagers on board polar-orbiting satellites, for example, have contributed greatly to our understanding of the global precipitation sys-tems in the last few decades. Data from space-borne instru-ments are an important component of the Global Precipi-tation Climatology Project (GPCP; Huffman et al., 2009), while NASA’s Global Precipitation Measurement (GPM) suite offers combined observations from a microwave im-ager and a dual-frequency precipitation radar, which have po-tential for snowfall studies (Hou et al., 2014). Geostationary satellites also help in monitoring precipitation, but for a very high latitude country like Sweden their usefulness is limited due to the high viewing and relative azimuth angles, espe-cially in the northern parts of Sweden.
In spite of its importance, characterising snowfall globally has been difficult due either to the absence or limited cov-erage or due to the limited capabilities of the observing sys-tems. In situ measurements from precipitation gauges pro-vide invaluable data, but they are mainly restricted to land areas and are geographically inhomogeneous and sparse,
es-pecially over high-latitude regions. Apart from networks of ground-based weather radars, covering very small geograph-ical areas in both hemispheres, a reliable source of snow-fall information over the high latitudes and the polar regions (where snowfall matters most) is generally lacking. Space-based observation of snowfall is, in a broader sense, in its in-fancy. The satellite sensors that operate at microwave or mil-limetre wavelengths are showing promise to obtain quantita-tively reliable estimates (Noh et al., 2009; Surussavadee and Staelin, 2009; Levizzani et al., 2011; Liu and Seo, 2013), but they are still of inadequate quality over the high latitudes, es-pecially over land and ice-covered surfaces. Optical imaging sensors do provide information on the snow cover extent, but the critical information on snowfall rate still remains illusive. This is, however, changing since the launch of CloudSat, as a part of the A-Train convoy of satellites, in 2006 (L’Ecuyer and Jiang, 2010). For the first time, the active Cloud Pro-filing Radar (CPR) on board CloudSat offers a possibility of obtaining realistic estimates of snowfall rate from space (Liu, 2008; Kulie and Bennartz, 2009; Wood, 2011; Wood et al., 2013).
As every observing system has its strengths and weak-nesses, the estimates of snowfall rates from both the Cloud-Sat CPR and ground-based weather radar systems could be improved if the synergy of these platforms could be ex-ploited (Cao et al., 2014; Smalley et al., 2014). With their better spatial and temporal resolution and calibration against high-quality rain gauges, ground-based weather radars offer an independent source of information to intercompare snow-fall estimates from the CloudSat CPR. On the other hand, the snowfall estimates from CloudSat CPR, unlike those from weather radars, are uniformly calibrated. Furthermore, ground-based radar beams can overshoot shallow precipitat-ing systems, missprecipitat-ing them as the observation distance from the radar increases. But even though CloudSat is generally insensitive to the vertical location of the precipitating sys-tem, the lowermost few bins of CloudSat, ranging roughly from 600 to 1200 m in height, can also be affected by ground clutter (Maahn et al., 2014). With regard to detectability, CloudSat is about an order of magnitude more sensitive to very light precipitation than any other existing space-based sensor (Skofronick-Jackson et al., 2012). On the other hand, unlike weather radars, CloudSat can saturate in the case of heavy-snowfall events (Cao et al., 2014). All of these con-siderations suggest that quantifying the strengths and weak-nesses of these two observing systems (i.e. CloudSat CPR and ground-based weather radars) would not only be bene-ficial to improve their snowfall estimates but would also help in bracketing the spread in their expected uncertainties. Such knowledge could certainly help in evaluating snowfall vari-ability simulated by climate models.
precipitation estimate (NMQ) (Zhang et al., 2011). The study found that CloudSat has good detectability for light snowfall but underestimates moderate and heavy snowfall, due to at-tenuation. In another study Smalley et al. (2014) compared all precipitation measurements (rain as well as snow) from CloudSat to that of the NMQ. They found that the NMQ ob-serves significantly fewer precipitation events than CloudSat and that the performance of the NMQ, compared to Cloud-Sat, decreases for near-surface temperatures below 0◦C. Evi-dently, both these observing systems have their strengths and weaknesses. In order to further evaluate CloudSat’s perfor-mance it is therefore important to compare its measurements to other ground-based data sets.
The main focus of the present study is to quantita-tively intercompare snowfall estimates from CloudSat and the ground-based weather radar network over Sweden. The Swedish radar network has been operational since the 1980s, and more than a decade of archived precipitation data ex-ist to intercompare with space-based estimates (Michelson et al., 2000; Michelson and Koistinen, 2002; Michelson, 2006; Devasthale and Norin, 2014). Apart from offering an independent source of snowfall estimates, the high-latitude geographical position of the Swedish radars entails sampling of different meteorological regimes under which CloudSat CPR data could be intercompared. The next section provides an overview of CloudSat CPR and the Swedish weather radar data set, followed by a description of the results in the third section. The results are summarised in the final section. 2 Data sets and processing
2.1 Snowfall product 2C-SNOW-PROFILE from CloudSat
CloudSat snowfall estimates were obtained from the 2C-SNOW-PROFILE data product, release R04 (Wood, 2011; Wood et al., 2013). This product uses a Bayesian optimal es-timation retrieval algorithm (Rodgers, 2000) to estimate ver-tically resolved properties of snowfall from vertical profiles of W-band (94 GHz) reflectivities measured by CloudSat’s CPR. The CloudSat orbit is such that the radar makes ob-servations between 82◦N and 82◦S latitude, completing one orbit approximately every 99 min (Tanelli et al., 2008) and repeating its orbital ground track every 16 days. This orbit leads to moderately dense spatial sampling at high latitudes. Profiles have a horizontal spatial resolution of 1.7 km along-track by 1.4 km cross-along-track. The radar has an intrinsic verti-cal resolution of 485 m, but measurements are oversampled to provide an effective vertical resolution of 239 m.
Rather than assuming a fixed relationship between reflec-tivity and snowfall rate (a so-called Z–S relationship), the 2C-SNOW-PROFILE retrieval algorithm estimates vertical profiles of the probability density functions (PDFs) of snow particle size distribution parameters. These posterior PDFs are estimated by minimising a cost function that incorporates
a priori estimates of the environmental distributions of these parameters as well as uncertainty-weighted differences be-tween the observed and forward-modelled radar reflectivity profile. The reflectivity forward model uses high-quality de-scriptions of the PDFs of snow particle microphysical and scattering properties as functions of size (Wood et al., 2015) as well as treatments for attenuation and multiple scattering by snow particles. The estimates of the size distribution pa-rameters are then used along with the forward model’s micro-physical properties to construct the vertically resolved PDFs of snowfall rate and other snow properties.
A retrieval is performed if the 2C-PRECIP-COLUMN product (Haynes et al., 2009) has categorised the surface pre-cipitation as snow or as mixed-phase with a melted mass fraction of less than 10 %. The melted mass fraction is esti-mated based on the height of the freezing level and assump-tions about the environmental lapse rate below the freezing level. Temperature information is obtained from reanalysis products of the European Centre for Medium-Range Weather Forecasting co-located to the CloudSat profile.
The surface snowfall rate is estimated from the retrieved profile of snowfall rates. Ground clutter affects the CPR mea-surements in the radar range bins nearest the surface, so these near-surface bins cannot be included in the reflectivity pro-files when retrievals are performed, creating what is some-times called a blind zone. Over land, this zone extends about 1 km above the surface. Consequently, the approach taken currently by 2C-SNOW-PROFILE is to estimate the surface snowfall rate as the rate retrieved in the radar bin immedi-ately above the blind zone. This surface snowfall rate is as-signed a confidence value from “none” to “high” depending on the expected performance of the forward model and the reliability of the temperature-based estimate of the precipita-tion phase, among other factors.
2.2 Snowfall product based on the Swedish weather radar network
The Swedish weather radar network consists of 12 horizon-tally polarised C-band Doppler radars. These radars measure three spectral moments: reflectivity, radial velocity, and spec-trum width. From these moments quantities such as precipi-tation rate, wind speed, and turbulence are estimated. In this work we focus only on reflectivity as our main interest is the snowfall rate.
sig-nal increases (see, e.g., Doviak and Zrni´c, 2006) which also leads to an increase in the upper limit ofZmin.
To suppress ground echoes, the Swedish weather radars are equipped with clutter filters. The clutter filters work by omitting the amplitudes of the three frequency channels clos-est to zero in the frequency spectrum, suppressing echoes with radial velocities less than±1 m s−1. The radar receiver is protected from overload by damping nearby signals by 60 dB, making data from the first 4 km from the radar un-usable.
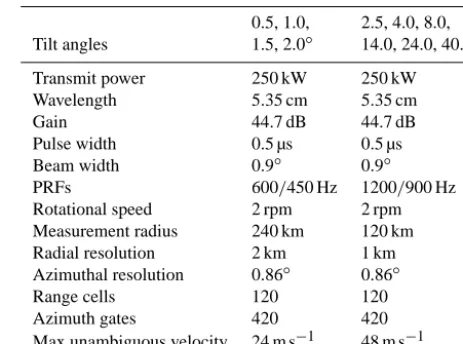
The scan strategy of the Swedish radars consists of per-forming azimuthal scans around a vertical axis for 10 differ-ent tilt angles,θ. The lowest scan is made atθ=0.5◦, and the highest is made atθ=40◦. These scans, which together make up a polar volume data set, are repeated every 15 min. Relevant radar characteristics are summarised in Table 1.
From polar volume data sets horizontal cross sections of radar reflectivity at a certain altitude can be generated. Over areas where no data exist at the specified altitude the mea-surement nearest in height is selected. Such cross sections are referred to a as pseudo-constant altitude plan position in-dicator (PCAPPI). In Sweden, the PCAPPIs are defined at 500 m altitude above the corresponding radar.
Nordrad (Carlsson, 1995) is a close collaboration among the Swedish Meteorological and Hydrological Insti-tute (SMHI); the Norwegian Meteorological InstiInsti-tute; the Finnish Meteorological Institute; the Estonian Environment Agency; and the Latvian Environment, Geology and Meteo-rology Agency. An additional agreement exists with the Dan-ish Meteorological Institute. Within the Nordrad collabora-tion radar PCAPPIs are exchanged in real time. All together, there are currently 35 weather radars operating in Sweden, Norway, Finland, Estonia, Latvia, and Denmark.
At the SMHI, composite radar images covering the Nordic countries are generated using PCAPPI data from as many available weather radars as possible. Before merging the PCAPPIs into a composite image, some quality adjustments are made. Radar measurements may be affected by nearby obstacles such as trees or mountains. A beam blockage cor-rection, based on the method by Bech et al. (2003), is ap-plied to correct for the reduction in reflectivity due to topog-raphy. Radar measurements may also contain echoes from non-precipitating objects such as ground clutter or clear-air targets. Non-precipitation echoes are removed by a filter us-ing satellite observations. Radar echoes from areas which are classified as cloud free by the satellite are removed by the fil-ter (Michelson, 2006).
Due to a combination of the positive non-zero angle of the lowest scan and the curvature of the Earth’s surface, mea-surements at increasing distances from the radars correspond to increasing heights (with increasing risk of completely or partially overshooting precipitating clouds); see, e.g., Fig. 2. Furthermore, since the beam widens with distance, the mea-surement volume becomes larger, which increases the risk for incomplete beam filling. As a result, precipitation
es-Table 1. Selected characteristics of the Swedish weather radars.
0.5, 1.0, 2.5, 4.0, 8.0, Tilt angles 1.5, 2.0◦ 14.0, 24.0, 40.0◦
Transmit power 250 kW 250 kW
Wavelength 5.35 cm 5.35 cm
Gain 44.7 dB 44.7 dB
Pulse width 0.5 µs 0.5 µs
Beam width 0.9◦ 0.9◦
PRFs 600/450 Hz 1200/900 Hz
Rotational speed 2 rpm 2 rpm
Measurement radius 240 km 120 km
Radial resolution 2 km 1 km
Azimuthal resolution 0.86◦ 0.86◦
Range cells 120 120
Azimuth gates 420 420
Max unambiguous velocity 24 m s−1 48 m s−1
timates at large distances from the radar may be of lower quality than those within 100 km from the radar. In order to correct for this distance dependence, data from rain gauges, which are considered to measure precipitation accurately, are used to calibrate the PCAPPIs. In order to compare radar flectivities to the rain-gauge-measured precipitation, the re-flectivities are converted to precipitation rateR(mm h−1) us-ing the empirical relationshipZ=aRb, wherea=200 and b=1.5 (see, e.g., Battan, 1973).
The radar data are adjusted to the rain gauges by fit-ting a second-degree polynomial to the logarithmic gauge-to-radar ratio, as a function of distance to the nearest radar. Radar measurements above 0.1 mm and rain gauge measure-ments above 0.5 mm from 1 week’s worth of time, to ensure that sufficiently many data pairs exist, are used in the cal-culations. The gauge adjustment method is described in de-tail in Michelson and Koistinen (2002). The quality-adjusted PCAPPIs are used to produce a composite image, Nordrad, covering the Nordic countries. The Nordrad composite im-age has a spatial resolution of 2 km×2 km and is generated every 15 min.
Figure 1. Area covered by the Nordrad composite (light blue). Cov-erage by all Nordic radars is shown in blue. Data originating from Swedish radars (Swerad) are displayed in dark blue. The positions of the Swedish radars are depicted by red stars, whereas the loca-tions of the other radars are shown by red circles. Tracks of the selected CloudSat passes are illustrated by white lines.
rain gauge adjustment corrects for the range dependence, the large reflectivities occasionally caused by melting snow (so-called bright-band effects) are not treated, which can some-times lead to an overestimation of precipitation. For a recent study of the performance of Nordrad, see Berg et al. (2015). For the purpose of this study, a simple but robust snowfall product was generated by combining Nordrad’s precipitation composite with 2 m temperatures from SMHI’s system for operational mesoscale univariate analyses of selected meteo-rological parameters (MESAN; Häggmark et al., 2000). The model domain of MESAN covers Scandinavia and the en-tire drainage basin of the Baltic Sea. The analysis is per-formed on a rotated latitude–longitude grid with a spatial resolution of 0.1◦(11 km) and a time resolution of 1 h. For every Nordrad composite image the 2 m temperature field from MESAN nearest in time and space was used to gen-erate a snowfall product. If the 2 m temperature was less than or equal to 0◦C, the corresponding precipitation from
Nor-drad was classified as snow, otherwise as rain.
In this work we have used snowfall estimates from the Nordrad composites but only selected measurements orig-inating from the area covered by Swedish radars. For the purpose of this paper we call this selection of data Swerad. Figure 1 shows the area covered by Nordrad and Swerad to-gether with the location of all radars as well as the selected tracks of CloudSat.
Distance (km)
Height above the radar (km)
0 50 100 150 200
0 1 2 3 4 5
Figure 2. Measurement height as a function of distance for Swerad (thick, solid line). Thin, dashed lines show the range limits that were used to divide the Swerad data into 10 range rings with an equal number of observations (0–46, 46–65, 65–82, 82–96, 96–110, 110– 125, 125–143, 143–168, 168–199, and>199 km).
2.3 Processing
During 2007 a modification was made to the Swedish radar hardware to implement Doppler processing for all scans. In order to have a homogeneous data set, we have therefore only used radar data collected after 1 January 2008, even though CloudSat was launched in 2006. For the present study, we used all ascending and descending passes of CloudSat (ex-cept during summer months, June to September) from 1 Jan-uary 2008 to 31 December 2010 between 54 and 70◦N lati-tude bands. In total, we analysed 1143 tracks, and the maxi-mum number of matchups for any track was 1741.
For every CloudSat pass over Sweden, its coordinates and time were extracted and the Swerad radar pixels nearest in time and space were selected. If the distance to an observa-tion by CloudSat was larger than 2 km or if the difference in time was more than 7.5 min, the data were discarded. Fur-thermore, only CloudSat observations with a confidence flag corresponding to “moderate” or “high” were analysed. For every CloudSat pass 77–1741, co-located observations were collected. In total, 716 545 observational pairs were collected and analysed.
It should be noted that frontal systems, which are mainly responsible for snowfall over Sweden, could advect by as much as 5 km in the maximum 7.5 min co-location time dif-ference allowed between CloudSat and Swerad. The aver-age temporal difference is, however, below 4 min, and even though this time difference can introduce some uncertainty while comparing the snowfall retrievals, especially if any one of the observing system leads or lags the passing front, the impact on the results of this study is expected to be small.
In the Supplement, Fig. S1 shows a histogram of the 2 m temperatures from MESAN, corresponding to the snow-fall measurements reported by CloudSat. From Fig. S1 it is seen that more than 90 % of CloudSat’s measurements corre-spond to 2 m temperatures below 0◦C and that the most fre-quent temperature was approximately−2◦C. CloudSat and Swerad therefore seem to agree well on when snowfall oc-curs.
3 Results and discussion
In order to get an overview of how the snowfall retrievals from CloudSat and Swerad compare, we first investigated their empirical cumulative distribution function (ECDF). The ECDF is defined as
P (x)=1−
∞
Z
x
p(x0)dx0, (1)
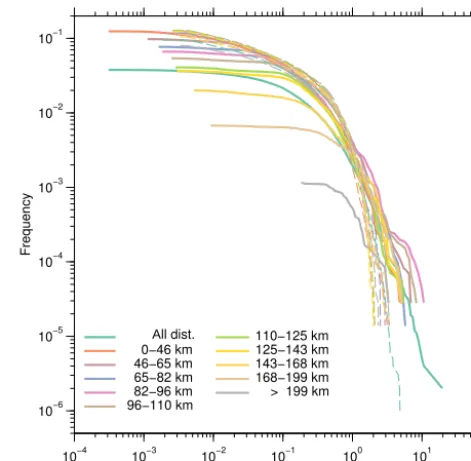
where p(x) is the probability that a measurement has the valuex andP (x)is the probability that a measurement has a value equal to or greater thanx. In Fig. 3 ECDFs are shown for the observations made by CloudSat and Swerad. In ad-dition to the ECDF for all distances, Fig. 3 shows the cor-responding functions for the various range rings defined in Sect. 2.3.
From Fig. 3 it can be seen that the CloudSat ECDFs are, as expected, unaffected by the distance to the nearest ground-based radar. During all the co-located passes, CloudSat mea-sured snow approximately 10 % of the time. A snowfall rate, S, higher than 0.1 mm h−1was measured less than 5 % of the time. For heavier snowfall,S >1 mm h−1, a rapid decrease in the frequency of occurrence can be seen. Only 2 ‰ of Cloud-Sat’s observations estimated a snowfall rateS >1 mm h−1.
The ECDFs from Swerad, on the other hand, show a larger variation depending on the distance to the nearest radar. The differences are most clearly seen for light-snowfall rates, S <0.1 mm h−1. The greater the distance to the nearest radar, the larger the lowest estimated snowfall rate. The frequency of observed snowfall is also seen to be lower for increasing distances.
At large distances to the nearest radar (d >199 km) snow-fall was only detected in 1 ‰ of the observations, whereas close to the radars (0≤d≤46 km) snow was reported over 10 % of the time. For intermediate snowfall rates, 0.1≤
Snowfall intensity (mm/h)
Frequency
10−4 10−3 10−2 10−1 100 101 102 10−6
10−5 10−4 10−3 10−2 10−1
$All dist. 0−46 km 46−65 km 65−82 km 82−96 km 96−110 km
110−125 km 125−143 km 143−168 km 168−199 km > 199 km
Figure 3. Empirical cumulative distribution functions for observa-tions of snowfall intensities from Swerad (solid lines) and Cloud-Sat (dashed lines), for various distances to the nearest ground-based radar.
S≤1 mm h−1, and small to medium distances to the near-est radar,d <125 km, the ECDFs of CloudSat and Swerad are similar. However, for large snowfall rates,S >1 mm h−1, Swerad recorded more frequent and larger snowfall rates compared to CloudSat. The largest snowfall rate was es-timated by Swerad asS≈20 mm h−1, whereas the largest snowfall rate detected by CloudSat was estimated nearS=
5 mm h−1. It is interesting to note that Swerad reported snow-fall rates larger than 5 mm h−1for almost all distances to the nearest radar. As non-precipitation echoes (i.e. ground clutter or clear-air returns) are mainly expected to occur close to the radars, it seems that these large snowfall rates originate from precipitation and not from clutter. This suggests either that Swerad overestimates the snowfall rate for large reflectivities or that the current 2C-SNOW-PROFILE algorithm may have limited ability to retrieve heavy precipitation. Since Swerad assumes a fixedZ–Rrelationship, as described in Sect. 2.2, it is expected that Swerad may overestimate snowfall rates for high reflectivity values. High reflectivity values can occur as a result of bright-band effects, which are not corrected in Swerad (see Sect. 2.2). On the other hand, as reported by Cao et al. (2014), CloudSat may also underestimate heavy snow-fall due to attenuation or non-Rayleigh scattering effects that limit the sensitivity of W-band reflectivity to particle size in heavy snow.
Swerad overshooting shallow snowfall at large distances and from Swerad’s decrease in sensitivity for larger distances.
To compare the detection capabilities of each platform, the CloudSat and Swerad matchups were evaluated using the fol-lowing metrics:
1. probability of detection (POD) for both snowfall and no snowfall (hereafter referred to as clear conditions), 2. false alarm rate (FAR) for both snowfall and clear
con-ditions, 3. hit rate (HR),
4. Pierce’s skill score (PSS).
These quantities are defined as follows, using the notation in the contingency matrix in Table 2:
PODsnow= d
c+d, (2)
PODclear= a
a+b, (3)
FARsnow= b
b+d, (4)
FARclear= c
a+c, (5)
HR= a+d
a+b+c+d, (6)
PSS= ad−bc
(a+b)(c+d). (7)
The POD and FAR estimate how efficient the evaluated system is in determining either snow or clear conditions. High values of POD as well as low values of FAR are ex-pected for observational pairs that agree well. The HR mea-sures the efficiency of the evaluated system’s ability to cor-rectly classify clear or snowy conditions. As more than 90 % of the co-located observations originate in clear conditions, the HR score is expected to be high, even though the classi-fication of snow might not be as good. The PSS score takes the uneven classification distribution into account and pro-vides a more balanced measure of how well the evaluated system separated the snow from clear conditions.
The lower limit of detectable snowfall,Slim, is ultimately determined by the sensitivity of the radar receiver. For CloudSat the lowest retrieved snowfall rate was S=2×
10−3mm h−1, whereas for Swerad the lowest detected snow-fall varied betweenS=3×10⁻⁴andS=2×10⁻¹mm h−1, depending on the distance to the nearest radar (cf. Fig. 3). In order to take the different sensitivities into account, we have calculated the statistical scores using different values for lower limit of detectable snowfall, Slim: 0, 0.01, 0.02, 0.03, 0.05, 0.1, 0.15, 0.25, and 0.35 mm h−1. As there are no error-free measurements to compare the snowfall esti-mates to (no “ground truth”), each score is calculated for both
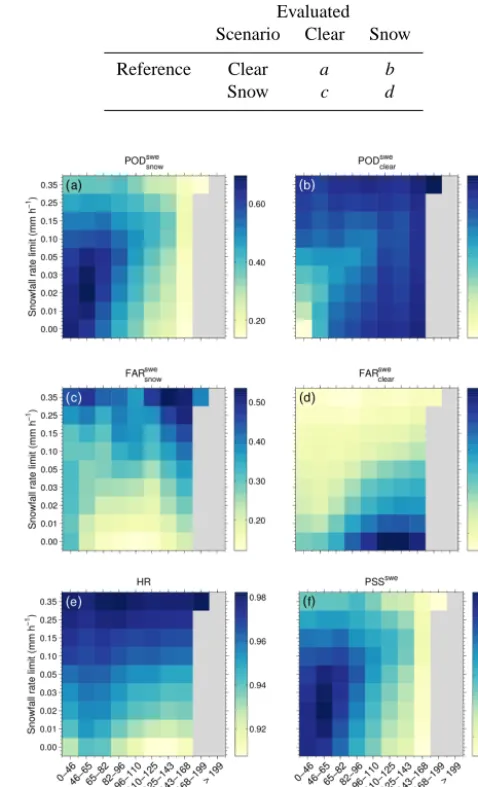
Table 2. Contingency matrix for observations from CloudSat and Swerad.
Evaluated Scenario Clear Snow
Reference Clear a b
Snow c d
Figure 4. Statistical scores for Swerad using CloudSat as a refer-ence. The scores are shown as a function of distance to the nearest radar as well for different lower limits of the snowfall rate. The panels show the probability of detecting snow (a), the probability of detecting clear conditions (no precipitation) (b), false alarm rate of snow (c), false alarm rate of clear conditions (d), hit rate (e), and Pierce’s skill score (f).
CloudSat and Swerad using the other observing system as a reference.
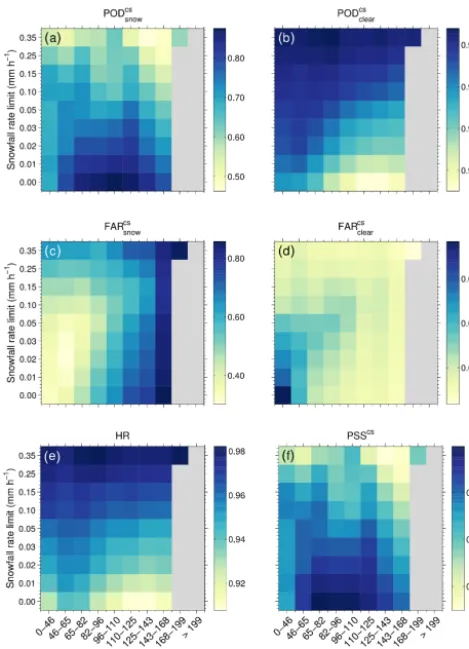
Figure 5. Statistical scores for CloudSat using Swerad as a refer-ence. The scores are shown as a function of distance to the nearest radar as well for different lower limits of the snowfall rate. The panels show the probability of detecting snow (a), the probability of detecting clear conditions (no precipitation) (b), false alarm rate of snow (c), false alarm rate of clear conditions (d), hit rate (e), and Pierce’s skill score (f).
skill scores (swe for Swerad and cs for CloudSat) denotes the evaluated system.
In Fig. 4a it is seen that the PODswesnow ranges from 0.15 to 0.7. The highest values of the PODswesnow are found for small distances to the nearest ground-based radar, 46< d < 65 km, together with 0.01≤Slim≤0.05 mm h−1. For larger distances the PODswesnowdecreases, and ford >143 km it ap-proaches 0.1 for all values of Slim. The decreasing val-ues of the PODswesnow for increasing distances mean either that Swerad underestimates the frequency of snowfall or that CloudSat overestimates it. Since the altitude at which Swerad’s measurements are made increases with increasing distance (cf. Fig. 2) while CloudSat exhibits a uniform beam height independent of range to the ground radar, it is likely that Swerad misses snowfall at large distances due to par-tial or complete overshooting. Furthermore, the sensitivity of the Swedish radars decreases with increasing distance, which
would also lead to a decrease in the PODswesnow, especially for low values ofSlim.
In Fig. 4a it is also seen that for increasing distances the PODswesnow obtains a maximum for increasing values of Slim. This can be understood by examining the ECDFs pre-sented in Fig. 3. The maximum value of the PODswesnow, for a given range ring, is found for the value of Slim where the ECDFs of CloudSat and Swerad meet. For example, for 96< d <110 km the ECDFs meet for a snowfall intensity of 0.1 mm h−1, and for this value ofSlim the PODswesnow ob-tains its maximum. For higher values ofSlimthe PODswesnowis expected to decrease due to the variability in snowfall inten-sity in the observations from the evaluated system (Swerad) together with increasing the threshold for snowfall in the ref-erence system (CloudSat).
The PODsweclear, shown in Fig. 4b, ranges from 0.96 to almost 1. Lower values of the PODsweclearare only found close to the radar,d <46 km, in light snow (Slim≤0.02 mm h−1). Close to the ground Swerad can detect non-precipitation echoes such as ground clutter or returns from clear-air targets. It is therefore expected that Swerad occasionally reports false precipitation at these distances. On the other hand, Cloud-Sat can miss shallow snowfall that forms in its blind zone, as mentioned in Sect. 2.1. The PODsweclearincreases for increasing Slim, indicating that this effect is most pronounced for weak echoes or light snowfall.
Figure 4c shows the FARswe
snow, which ranges from 0.1 to 0.55. Except for very small distances to the nearest radar (d <46 km) the FARswesnowis seen to increase for increasing values of Slim. This is a result of selecting higher snow-fall intensities from the evaluated system (Swerad) together with the variability in intensity of the snowfall observations from the reference system (CloudSat). However, nearest to the ground-based radar,d <46 km, the FARswesnowobtains its minimum for Slim=0.1 mm h−1. This is again the result of Swerad reporting echoes from non-precipitation targets in combination with CloudSat missing snowfall in its blind zone.
The FARsweclear, shown in Fig. 4d, is low, FARsweclear<0.04, close to the nearest ground-based radar, indicating that Swerad is good at detecting snowfall at this range. Further from the nearest radar the FARsweclear increases up to 0.09 for Slim=0 mm h−1. However, for Slim≥0.1 mm h−1 the FARsweclear<0.03 for all distances. This confirms the previ-ously discussed suspicion that Swerad misses light snowfall at large distances due to partial overshooting or decreased sensitivity.
be-yond which it decreases monotonically. This result represents a combination of the previously discussed problems occur-ring close (non-precipitation echoes detected by Swerad and blind zone for CloudSat) and far (overshooting and decreased sensitivity by Swerad) from the nearest ground-based radar. The distance where HR obtains its maximum shows the opti-mum distance when comparing the intensity estimates from both systems. Referring to Fig. 2, it is encouraging to note that the radar beam is at an altitude of about 1 km at this range from the radar, coinciding with the height to which the CloudSat observations correspond.
Figure 4f shows Pierce’s skill score, PSSswe. This score varies within 0.15<PSSswe<0.7. The lowest values of the PSSsweare found for large distances from the nearest ground-based radar, reflecting the low values of the PODswesnowseen in Fig. 4a. The highest values of the PSSsweare found for small to moderate distances to the nearest radar (46< d <65 km) together with low to moderate lower limits of the snowfall rate (0.01≤Slim≤0.05 mm h−1). This shows the distances and the values of Slim for which the observations from the measurement systems agree best, when using CloudSat as a reference.
In Fig. 5 the same set of skill scores is shown but now us-ing Swerad as the reference. However, not all skill scores are independent of those shown in Fig. 4. From the definitions of the skill scores (see Eqs. 2–7) and the contingency matrix (cf. Table 2) it can be seen that PODswe/cssnow =1−FARcs/swesnow and PODcs/sweclear =1−FARswe/csclear .
The PODcssnow is shown in Fig. 5a. For low to moderate lower limits of the snowfall rate, 0≤Slim=0.1 mm h−1, the PODcssnowranges from 0.6 to 0.9, whereas for high lower lim-its of the snowfall rate,Slim≥0.4 mm h−1, the PODcssnow de-creases down to almost 0.45. The decreasing values of the PODcssnow for increasing values ofSlim are explained by the variability in the snowfall intensity of the evaluated system (CloudSat) together with the increasing threshold for snow-fall of the reference system (Swerad). Close to the radars, d <46 km, CloudSat underestimates the frequency of snow-fall reported by Swerad more than for larger distances, for Slim≤0.1 mm h−1. This was also seen in Fig. 4b and is at-tributed to a combination of CloudSat missing shallow snow-fall in its blind zone and Swerad reporting non-precipitation echoes.
The PODcsclear, shown in Fig. 5b, is very high, close to 1, ex-cept ford >82 km in combination withSlim≤0.01 mm h−1, where PODcsclear<0.94. The lower values of the PODcsclearare, as previously discussed, explained by Swerad missing or par-tially overshooting snowfall at large distances together with Swerad’s decreased sensitivity for larger distances.
The FARcssnow (see Fig. 5c) ranges from 0.3 to 0.9. The FARcssnow is low close to the radars, d <82 km, together withSlim≤0.1 mm h−1, indicating good agreement between the observing systems. For larger distances to the nearest ground-based radar the values of FARcssnowdecrease as a
re-sult of Swerad missing snowfall due to overshooting and de-creased sensitivity.
It can further be seen that for increasing distances the min-imum value of the FARcssnowis found for increasing values of Slim. This can again be explained by a combination of Swerad missing observations of snowfall due to overshooting and de-creased sensitivity and the variability in snowfall intensity in the observations from the reference system (Swerad) to-gether with an increasing of the threshold of snowfall for the evaluated system (CloudSat).
Figure 5d shows the FARcsclear which is almost zero ev-erywhere, meaning that when CloudSat reports clear con-ditions Swerad almost never reports snow. Higher values, FARcsclear>0.02 are only found close to the nearest ground-based radar, d <65 km, and for Slim≤0.03 mm h−1. The higher values of the FARcsclearconfirm the previous observa-tion that for these distances CloudSat measures snow less of-ten than Swerad, due to CloudSat’s blind zone and Swerad reporting non-precipitation echoes. Even very close to the nearest radar,d <46 km, the FARcsclear approaches zero for increasing values ofSlim, suggesting that CloudSat predomi-nantly underestimates light snowfall near the radars.
The hit rate, shown in Fig. 5e, is reproduced for con-venience but is exactly the same as the hit rate shown in Fig. 4e since HR is symmetric with respect to the choice of reference. The PSS, however, differs depending on which system is used as a reference. The PSScs, using Swerad as a reference, is shown in Fig. 5f. This score varies within 0.4<PSScs<0.8. The lowest values of the PSScsare found for high values of the lower limit of the snowfall rate limit, Slim≥0.25 mm h−1, which reflects the corresponding low values of the PODcssnow(cf. Fig. 5a). For the highest value of the lower limit of the snowfall rate,Slim=0.35 mm h−1, the PSScsdecreases for all distances and attains values between 0.4 and 0.6. High values of the PSScsare found for intermedi-ate distances to the nearest radar (46< d <143 km) together withSlim≤0.03 mm h−1. This is a result of the correspond-ing high values of the PODcssnow. This shows again that an op-timum range to the nearest ground-based radar exists where the problems close to (non-precipitation echoes from Swerad and CloudSat’s blind zone) and far from (Swerad’s decreased sensitivity and beam overshooting) the radars are minimised. It is worth noting that these skill scores provide a clear demonstration of why, in the absence of a clearly superior data set, it is important to alternate the observing system used as the reference. The impact of different sensitivities, obser-vational capabilities, and statistical artefacts resulting from these differences is clearly visible in the two sets of skill scores presented in Figs. 4 and 5.
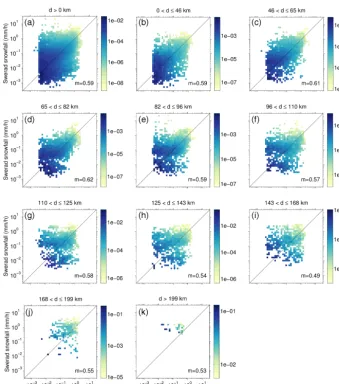
Figure 6. 2-D probability density functions (PDFs) of observational pairs of snowfall by CloudSat and Swerad. Panel (a) shows the 2-D PDF for all observational pairs, whereas panels (b–k) show the 2-D PDF for various distances to the nearest ground-based radar. Note the logarithmic scales. The metricmestimates how well the observations agree (0≤m≤1, wherem=1 is perfect agreement).
observing principles, some scatter is expected. In order to provide an objective measure of the agreement between the observational pairsxi andyi, a simple metric, based on the normalised minimum distance of allNobservational pairs to the line of equality, was defined:
m=1− 1
N N
X
i=1
q
(xi−yi)2
xi+yi
, (8)
where 0≤m≤1 andm=1 corresponds to all observational pairs lying on the line of equality.
In Fig. 6a the 2-D PDF for all observational pairs is shown. It can be seen that the most frequently observed snowfall rates were estimated as S <0.1 mm h−1 for both CloudSat and Swerad. The general agreement between the measure-ment systems is good,m=0.59, and the agreement is even better for snowfall ratesS >0.1 mm h−1. For light-snowfall
rates, S <0.05 mm h−1, Swerad tends to estimate slightly lower snowfall rates than CloudSat.
As shown in Fig. 3, the snowfall retrievals from Swerad are sensitive to the distance from the radar station. In order to investigate sensitivity to this distance, Fig. 6b–k show the 2-D PDFs for all observational pairs for different distances to the nearest ground-based radar (cf. Sect. 2.3 and Fig. 3). In Fig. 6b we see that close to the radar,d <46 km, the agree-ment between CloudSat and Swerad is good,m=0.59. Very low snowfall rates, S <0.05 mm h−1, tend to be estimated somewhat lower by Swerad. The same tendency is also seen for the next distance bin, 46< d <65 km, shown in Fig. 6c, but for this range to the nearest radar the overall agreement is higher,m=0.61.
decreased sensitivity with increasing distance and by partial beam overshooting of the snowfall, discussed in Sects. 2.2 and 3. The agreement metric is seen to decrease fromm=
0.62 to m=0.49 (with the exception of slightly higher scores, m=0.55 and m=0.53, for Fig. 6j and k). How-ever, for snowfall rates 0.1≤S≤1 mm h−1 the agreement remains good, regardless of distance.
4 Conclusions
In the present study, we exploited data from the Swedish ground-based radar network (Swerad) and the Cloud Pro-filing Radar on board the CloudSat satellite (2C-SNOW-PROFILE) to provide insights into their performance in snowing scenes. The different sensitivities and observing principles of these two systems offer increased understand-ing of their strengths and limitations. Furthermore, the high-latitude geographical location of Sweden allowed us to sam-ple and intercompare snowfall retrievals under different me-teorological and surface conditions than previously reported. In total, more than 7.2×10⁵ co-located observations were evaluated from 1 January 2008 till 31 December 2010, ex-cluding the summer months.
The intercomparison shows encouraging agreement be-tween the two observing systems. The distributions of snow-fall rates are similar for CloudSat and Swerad for the range between 0.1 and 1.0 mm h−1. The results from the sensitiv-ity studies indicate that the best agreement is observed when CloudSat passes close to a Swerad station (46–82 km), where the observational conditions for both systems are compa-rable. Larger disagreements outside this range suggest that both platforms have difficulty with shallow snow, but for dif-ferent reasons. We observed a clear tendency for the correla-tion between Swerad and CloudSat to degrade with increas-ing distance from the nearest Swerad station. This mainly occurs due to Swerad’s decreased sensitivity for increasing distances but also as Swerad systematically overshoots low-level precipitating systems further away from the station, leading to an underestimation of the snowfall rate and occa-sionally to miss precipitation altogether. Data pairs close to the radar, on the other hand, suggest that some some shallow-snow events that are detected by the ground-based radars are missed by CloudSat, due to ground clutter.
Several common performance metrics also show a clear tendency that the scores degrade with increasing distance from the Swerad stations. A closer inspection of the observa-tions shows that the 2C-SNOW-PROFILE has limited ability to retrieve at the higher end of snowfall intensity distribution (>1 mm h−1), causing deviation from the corresponding dis-tribution from Swerad. This is in agreement with the results found by Cao et al. (2014). On the lower end of the distri-bution, both observing systems seem to suffer from limita-tions. While Swerad detects non-precipitating, low-intensity echoes closest to the stations that are often misclassified as light snowfall, CloudSat CPR is also affected in the
lower-most kilometre from the surface, where its sensitivity is re-duced considerably. These limitations make comparison of light-snowfall events difficult and impractical.
Finally, it should be mentioned that, although the de-sign purpose and end users of these two observing sys-tems are different, intercomparisons help to assess the per-formance of ground-based systems for weather applications, while also providing uncertainty information for climate ap-plications that use satellite products (Boening et al., 2012; Palerme et al., 2014). The fact that Swerad and CloudSat CPR broadly agree with one another in the 0.1–1.0 mm h−1 intensity range, recorded by the majority of snowfall events, could be exploited in future studies to reconcile differences between these two systems and in particular to improve the statistical relationship between reflectivity and snowfall rate derived from ground-based radars.
The results of this study suggest that clear improvements can be made to the Swerad data set. Correcting the ground-based radar data with a vertical profile of reflectivity would help eliminate bright-band effects and reduce some overesti-mated snowfall measurements. Furthermore, as Swerad does not use aZ–S relationship for snowfall, there exists addi-tional room for improvement. Formulating a representative Z–S relationship has been one of the chronic problems, of-ten discussed widely in the scientific community. CloudSat with its uniform calibration and beam height (together with information on cloud microphysics) has potential to be a re-alistic reference in this context.
The Supplement related to this article is available online at doi:10.5194/amt-8-5009-2015-supplement.
Acknowledgements. The portion of this research by T. S. L’Ecuyer,
N. B. Wood, and M. Smalley was performed at the University of Wisconsin-Madison for the Jet Propulsion Laboratory, California Institute of Technology, sponsored by the National Aeronautics and Space Administration CloudSat programme.
Edited by: I. Moradi
References
Battan, L. J.: Radar Observation of the Atmosphere, University of Chicago Press, Chicago, USA, 324 pp., 1973.
Bech, J., Codina, B., Lorente, J., and Bebbington, D.: The sensitivity of single polarization weather radar beam block-age correction to variability in the vertical refractivity gradi-ent, J. Atmos. Ocean. Tech., 20, 845–855, doi:10.1175/1520-0426(2003)020<0845:TSOSPW>2.0.CO;2, 2003.
Boening, C., Lebsock, M., Landerer, F., and Stephens, G.: Snowfall-driven mass change on the East Antarctic ice sheet, Geophys. Res. Lett., 39, L21501, doi:10.1029/2012GL053316, 2012. Cao, Q., Hong, Y., Chen, S., Gourley, J. J., Zhang, J., and
Kirstet-ter, P. E.: Snowfall detectability of NASA’s CloudSat: the first cross-investigation of its 2c-snow-profile product and national multi-sensor mosaic QPE (NMQ) snowfall data, Prog. Electro-magn. Res., 148, 55–61, doi:10.2528/PIER14030405, 2014. Carlsson, I.: NORDRAD – weather radar network, in: COST 75
Weather Radar Systems, edited by: Collier, C. G., European Commission, Luxembourg, 45–52, 1995.
Devasthale, A. and Norin, L.: The large-scale spatio-temporal variability of precipitation over Sweden observed from the weather radar network, Atmos. Meas. Tech., 7, 1605–1617, doi:10.5194/amt-7-1605-2014, 2014.
Doviak, R. J. and Zrni´c, D. S.: Doppler Radar and Weather Obser-vations, 2 edn., Dover Publications, Mineola, New York, USA, 2006.
Germann, U. and Joss, J.: Mesobeta Profiles to Extrapolate Radar Precipitation Measurements above the Alps to the Ground Level, J. Appl. Meteorol., 41, 542–557, doi:10.1175/1520-0450(2002)041<0542:MPTERP>2.0.CO;2, 2002.
Häggmark, L., Ivarsson, K.-I., Gollvik, S., and Olofsson, P.-O.: Mesan, an operational mesoscale analysis system, Tellus A, 52, 2–20, doi:10.1034/j.1600-0870.2000.520102.x, 2000.
Haynes, J. M., L’Ecuyer, T. S., Stephens, G. L., Miller, S. D., Mitrescu, C., Wood, N. B., and Tanelli, S.: Rainfall retrieval over the ocean with spaceborne W-band radar, J. Geophys. Res., 114, D00A22, doi:10.1029/2008JD009973, 2009.
Hou, A. Y., Kakar, R. K., Neeck, S., Azarbarzin, A. A., Kummerow, C. D., Kojima, M., Oki, R., Nakamura, K., and Iguchi, T.: The Global Precipitation Measurement Mission, B. Am. Meteorol. Soc., 95, 701–722, doi:10.1175/BAMS-D-13-00164.1, 2014. Huffman, G. F., Adler, R. F., Bolvin, D. T., and Gu, G.: Improving
the Global Precipitation Record: GPCP Version 2.1, Geophys. Res. Lett., 36, L17808, doi:10.1029/2009GL040000, 2009. Kulie, M. and Bennartz, R.: Utilizing spaceborne radars to
retrieve dry snowfall, J. Appl. Meteorol., 48, 2564–2580, doi:10.1175/2009JAMC2193.1, 2009.
L’Ecuyer, T. S. and Jiang, J.: Touring the atmosphere aboard the A-Train, Phys. Today, 63, 36–41, 2010.
Levizzani, V., Laviola, S., and Cattani, E.: Detection and mea-surement of snowfall from space, Remote Sensing, 3, 145–166, doi:10.3390/rs3010145, 2011.
Liu, G.: Deriving snow cloud characteristics from Cloud-Sat observations, J. Geophys. Res., 113, D00A09, doi:10.1029/2007JD009766, 2008.
Liu, G. and Seo, E. K.: Detecting snowfall over land by satellite high-frequency microwave observations: the lack of scattering signature and a statistical approach, J. Geophys. Res.-Atmos., 118, 1376–1387, doi:10.1002/jgrd.50172, 2013.
Liu, X. and Yanai, M.: Influence of Eurasian spring snow cover on Asian summer rainfall, Int. J. Climatol., 22, 1075–1089, doi:10.1002/joc.784, 2002.
Maahn, M., Burgard, C., Crewell, S., Gorodetskaya, I. V., Kneifel, S., Lhermitte, S., Van Tricht, K., and Van Lipzig, N. P. M.: How does the spaceborne radar blind zone affect derived surface snowfall statistics in polar regions?, J. Geophys.
Res.-Atmos., 119, 13604–13620, doi:10.1002/2014JD022079, 2014.
Michelson, D.: The Swedish weather radar production chain, in: Proceedings of the Fourth European Conference on Radar in Me-teorology and Hydrology, Barcelona, Spain, 18–22 September 2006, 382–385, ERAD, 2006.
Michelson, D. B. and Koistinen, J.: Gauge-radar network adjust-ment for the Baltic Sea Experiadjust-ment, Phys. Chem. Earth Pt. B, 25, 10–12, 2002.
Michelson, D. B., Andersson, T., Koistinen, J., Collier, C. G., Riedl, J., Szturc, J., Gjertsen, U., Nielsen, A., and Overgaard, S.: BALTEX Radar Data Centre Products and their Methodolo-gies, Reports Meteorology and Climatology RMK 90, SMHI, Norrköping, Sweden, 76 pp., 2000.
Noh, Y. J., Liu, G., Jones, A. S., and Vonder Haar, T. H.: To-ward snowfall retrieval over land by combining satellite and in situ measurements, J. Geophys. Res.-Atmos., 114, D24205, doi:10.1029/2009JD012307, 2009.
Palerme, C., Kay, J. E., Genthon, C., L’Ecuyer, T., Wood, N. B., and Claud, C.: How much snow falls on the Antarctic ice sheet?, The Cryosphere, 8, 1577–1587, doi:10.5194/tc-8-1577-2014, 2014. Rasmussen, R., Dixon, M., Vasiloff, S., Hage, F., Knight, S.,
Vivekanandan, J., and Xu, M.: Snow Nowcasting Using a Real-Time Correlation of Radar Reflectivity with Snow Gauge Ac-cumulation, J. Appl. Meteorol., 42, 20–36, doi:10.1175/1520-0450(2003)042<0020:SNUART>2.0.CO;2, 2003.
Rodgers, C.: Inverse Methods for Atmospheric Sounding, World Scientific Publishing, Singapore, 2000.
Skofronick-Jackson, G. M., Johnson, B. T., and Munchak, S. J.: Detection thresholds of falling snow from satellite-borne active and passive sensors, IEEE T. Geosci. Remote, 51, 4177–4189, doi:10.1109/TGRS.2012.2227763, 2012.
Smalley, M., L’Ecuyer, T., Lebsock, M., and Haynes, J.: A compar-ison of precipitation occurrence from the NCEP StageIV QPE Product and the CloudSat Cloud Profiling Radar, J. Hydrol., 15, 444–458, doi:10.1175/JHM-D-13-048.1, 2014.
Surussavadee, C. and Staelin, D. H.: Satellite retrievals of Arc-tic and equatorial rain and snowfall rates using millime-ter wavelengths, IEEE T. Geosci. Remote, 47, 3697–3707, doi:10.1109/TGRS.2009.2029093, 2009.
Tanelli, S., Durden, S. L., Im, E., Pak, K. S., Reinke, D. G., Par-tain, P., Haynes, J. M., and Marchand, R. T.: CloudSat’s Cloud Profiling Radar after two years in orbit: performance, calibration, and processing, IEEE Trans. Geosci. Remote, 46, 3560–3573, 2008.
Turner, A. G. and Slingo, J. M.: Using idealized snow forc-ing to test teleconnections with the Indian summer monsoon in the Hadley Centre GCM, Clim. Dynam., 36, 1717–1735, doi:10.1007/s00382-010-0805-3, 2011.
Waliser, D. E., Li, J.-L. F., L’Ecuyer, T. S., and Chen, W.-T.: The impact of precipitating ice and snow on the radiation bal-ance in global climate models, Geophys. Res. Lett., 38, L06802, doi:10.1029/2010GL046478, 2011.
Wood, N. B., L’Ecuyer, T., Vane, D. G., Stephens, G. L., and Partain, P.: Level 2C snow profile process description and interface control document, Tech. rep., Colorado State Univer-sity, available at: http://www.cloudsat.cira.colostate.edu/sites/ default/files/products/files/2C-SNOW-PROFILE_PDICD.P_ R04.20130210.pdf (last access: 3 August 2015), 2013.
Wood, N. B., L’Ecuyer, T. S., Heymsfield, A. J., and Stephens, G. L.: Microphysical constraints on millimeter-wavelength scattering properties of snow particles, J. Appl. Meteorol. Clim., 54, 909–931, doi:10.1175/JAMC-D-14-0137.1, 2015.
Ye, H., Bao, Z., and Feng, X.: Connections of Siberian snow onset dates to the following summer’s monsoon condi-tions over Southeast Asia, Int. J. Climatol., 25, 1567–1584, doi:10.1002/joc.1201, 2005.