doi:10.5194/se-5-1277-2014
© Author(s) 2014. CC Attribution 3.0 License.
Relative tectonic activity classification in the Kermanshah area,
western Iran
M. Arian1and Z. Aram2
1Department of Geology, Science and Research Branch, Islamic Azad university, Tehran, Iran 2Department of Geology, Kermanshah Branch, Islamic Azad University, Kermanshah, Iran
Correspondence to: M. Arian (mehranarian@yahoo.com)
Received: 17 July 2014 – Published in Solid Earth Discuss.: 31 July 2014
Revised: 29 October 2014 – Accepted: 5 November 2014 – Published: 4 December 2014
Abstract. Due to the closing of the subduction zone and the collision of the Arabian and Eurasian plates, the High Za-gros region has always been affected by a wide range of tec-tonic variations. In this research, the Gharasu River basin, which is located in the Kermanshah area, was selected as the study area, six geomorphic indices were calculated, and the results of each one were divided into three classes. Then, us-ing the indices, relative tectonic activity was calculated, and their values were classified and analysed in four groups. Re-gions were identified as very high, high, moderate and low. In analysing the results and combining them with field observa-tions and regional geology, the results were often associated and justified with field evidence. The highest value is located on the Dokeral anticline in the crush zone in Zagros. Most of the areas with high and moderate values of Index of Active Tectonics (IAT) are also located in the crush zone in Zagros. Crushing in this zone is because of the main fault mechanism of the Zagros region. The result in this paper confirms pre-vious research in this region. At the eastern end of the study area, the value of Iat is high, which could be the result of the Sarab and Koh-e Sefid fault mechanisms.
1 Introduction
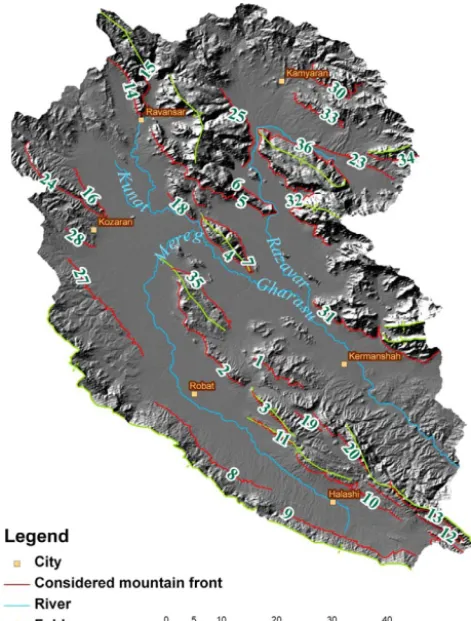
The study area is the Gharasu River basin, which is in the west of Iran. The river is located in the Zagros fold–thrust belt in the Kermanshah area (Fig. 1). The aim of this selec-tion, as a study area, is to calculate different geomorphic in-dices to assess active tectonics of the area. The north-eastern area consists of a thin imbricate fan (thrust sequence) that causes the creation of fault breccias, shear zones, general
crushing of formations with the development of a linear joint system, sudden cutting of layers and changing of their age and lithology in the nearby area. In this area, we can see a lot of tectonic windows (Karimi, 1999).
Since the rivers are sensitive to the recent tectonic activi-ties and show a rapid reaction, the Gharasu River and other secondary rivers are selected for calculation of the indices. The geomorphologic studies of active tectonics in the late Pleistocene and Holocene are of utmost importance in eval-uating earthquake hazard in tectonically active areas such as the Zagros (Keller and Pinter, 2002).
1278 M. Arian and Z. Aram: Relative tectonic activity classification in the Kermanshah area
20
-Figure 1. Location of the study area in Iran and Zagros fold-thrust belt. 400
401
402 403 404 405
Figure 1. Location of the study area in Iran and the Zagros fold–thrust belt.
21 - 406
407 408
Figure 2. Geological map(1:250000) in the study area. 409
Figure 2. Geological map (1:250 000) of the study area.
2 Regional and geological setting of the study area
The area is located between latitudes 34 to 35◦ north and longitudes 46.30 to 47.30◦west. The study area (3470 km2), which is located along the Zagros fold–thrust belt, with 1500 m in length, extends from the Taurus Mountains in south-eastern Turkey to the Minab fault to the east of the Strait of Hormuz (Mirzaei et al., 1998).
The study area according to the division of Braud (1979) contains some parts of autochthon Zagros, allochthon Zagros and thin imbricate fan (thrust sequence) (Fig. 2). Thrust dips in the area are less than 45◦, but sometimes reach up to 70◦ and form reverse faults (Karimi, 1999). The accomplished studies on area joints prove the largest direction of the main stress axis to be formed in the north, the north-east to the south, and the south-west (Nazari, 1998).
Since the area is influenced by Arabian plate pressure and since the thrust of central Iran has also occurred by the omis-sion of the Neotethys Ocean on the Arabian plate, some of the faults are of a thrust kind and have a northwest–southeast trend, and the thrust is southwesterly.
3 Materials and methods
To study the indices, there is a formula to which we turn to describe each one of the indices; it is necessary to have some primary maps to calculate the indices, the most im-portant of which are a digital elevation model (DEM), the
Figure 3.SLindex along the drainage network.
drainagenetwork and the sub-basin map of the Gharasu River basin that have been extracted from the DEM; DEM (The Shuttle Radar Topography Mission (SRTM)) extracted from a digitized topographic map (1:30 000).
3.1 The stream–gradient index (SL)
The rivers flowing over rocks and soils of various strengths tend to reach equilibrium with specific longitudinal pro-files and hydraulic geometrics (Hack, 1973; Bull, 2007). Hack (1957, 1973, 1982) defined the index (SL) to discuss influences of environmental variables on longitudinal stream profiles, and to test whether streams has reached an equilib-rium. The calculation formula is in this manner:
SL=(1H /1L)L, (1)
where (1H /1L) is the local slope of the channel segment that is located between two contours, and L is the nel length from the division to the midpoint of the chan-nel reaches for which the index is calculated. To calculate the amount of (1H /1L) andL, we need the contour and the drainage network map. The contours are gained from the DEM. In this study, the contour distances are set at 10 m. This
Figure 4. Distribution of rock strength levels in the area.
index is calculated along the master river for each sub-basin (Fig. 3) and, then, theSLaverage is calculated for each one. The amount ofSL is not calculated for two sub-basins (49 and 57), because the values of contours which cut the master river are not adequate.
In Table 1, sub-basin 84 is brought up as an example. The SL index can be used to evaluate relative tectonic activity (Keller and Pinter, 2002). An area of soft rocks with high SLvalues can be indicative of active tectonics.
TheSLvalue is classified into three categories, which are class 1 (SL>500), class 2 (300< SL<500), and class 3 (SL<300) (El Hamdouni et al., 2008). The minimum value of SL is 1.33, in sub-basin 2, and the maximum value is 7893.97, in sub-basin 88. After averaging each sub-basin, the maximum value is obtained for sub-basin 88 (16 669), and two sub-basins, 49 and 57, do not possess any values (Table 1).
1280 M. Arian and Z. Aram: Relative tectonic activity classification in the Kermanshah area
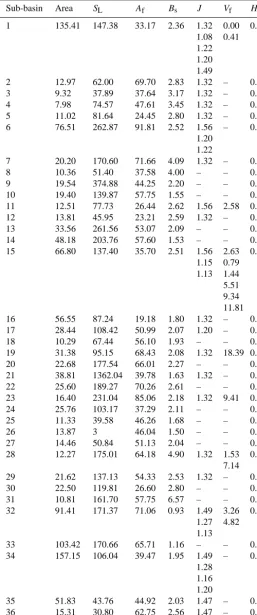
Table 1. Values of six geomorphic indices for 88 sub-basins of the Gharasu River basin (SL: stream length – gradient index;Af: drainage basin asymmetry;Hi: hypsometric integral;Vf: ratio of the valley floor width to the valley height;Bs: index of the drainage basin shape;J: index of mountain-front sinuosity).
Sub-basin Area SL Af Bs J Vf Hi
1 135.41 147.38 33.17 2.36 1.32
1.08 1.22 1.20 1.49
0.00 0.41
0.14
2 12.97 62.00 69.70 2.83 1.32 – 0.25
3 9.32 37.89 37.64 3.17 1.32 – 0.16
4 7.98 74.57 47.61 3.45 1.32 – 0.32
5 11.02 81.64 24.45 2.80 1.32 – 0.28
6 76.51 262.87 91.81 2.52 1.56
1.20 1.22
– 0.23
7 20.20 170.60 71.66 4.09 1.32 – 0.38
8 10.36 51.40 37.58 4.00 – – 0.22
9 19.54 374.88 44.25 2.20 – – 0.36
10 19.40 139.87 57.75 1.55 – – 0.41
11 12.51 77.73 26.44 2.62 1.56 2.58 0.43
12 13.81 45.95 23.21 2.59 1.32 – 0.18
13 33.56 261.56 53.07 2.09 – – 0.44
14 48.18 203.76 57.60 1.53 – – 0.32
15 66.80 137.40 35.70 2.51 1.56
1.15 1.13
2.63 0.79 1.44 5.51 9.34 11.81
0.30
16 56.55 87.24 19.18 1.80 1.32 – 0.27
17 28.44 108.42 50.99 2.07 1.20 – 0.42
18 10.29 67.44 56.10 1.93 – – 0.44
19 31.38 95.15 68.43 2.08 1.32 18.39 0.25
20 22.68 177.54 66.01 2.27 – – 0.33
21 38.81 1362.04 39.78 1.63 1.32 – 0.36
22 25.60 189.27 70.26 2.61 – – 0.35
23 16.40 231.04 85.06 2.18 1.32 9.41 0.32
24 25.76 103.17 37.29 2.11 – – 0.49
25 11.33 39.58 46.26 1.68 – – 0.47
26 13.87 3 46.04 1.50 – – 0.34
27 14.46 50.84 51.13 2.04 – – 0.45
28 12.27 175.01 64.18 4.90 1.32 1.53
7.14 0.24
29 21.62 137.13 54.33 2.53 1.32 – 0.16
30 22.50 119.81 26.60 2.80 – – 0.31
31 10.81 161.70 57.75 6.57 – – 0.34
32 91.41 171.37 71.06 0.93 1.49
1.27 1.13
3.26 4.82
0.39
33 103.42 170.66 65.71 1.16 – – 0.24
34 157.15 106.04 39.47 1.95 1.49
1.28 1.16 1.20
– 0.23
35 51.83 43.76 44.92 2.03 1.47 – 0.11
36 15.31 30.80 62.75 2.56 1.47 – 0.10
37 21.79 47.91 63.53 2.05 – – 0.21
Table 1. Continued.
Sub-basin Area SL Af Bs J Vf Hi
38 47.53 254.04 60.69 2.20 1.47 1.44 0.17
39 51.89 54.58 65.76 1.52 – – 0.25
40 20.21 20.90 29.02 2.08 1.51 – 0.23
41 21.29 13.55 62.40 1.21 1.28 – 0.17
42 15.00 89.76 47.07 0.98 1.47 1.56
0.18 0.17
43 16.98 67.68 31.48 1.58 1.47 – 0.25
44 100.39 137.96 25.03 2.26 1.51 – 0.17
45 72.40 30.64 83.18 1.36 – – 0.14
46 35.74 116.66 47.17 3.12 1.51 1.05 0.29
47 105.46 79.98 15.13 2.70 1.49
1.27
– 0.21
48 21.91 102.71 66.03 2.98 1.27 4.14 0.21
49 9.01 – 64.77 1.62 – – 0.24
50 155.18 154.77 44.84 1.14 1.47 0.40 0.27
51 53.96 26.48 70.40 2.15 1.28
1.27
– 0.14
52 42.75 9.65 46.92 1.23 1.27 12.41 0.11
53 108.39 125.42 45.95 4.61 1.51 – 0.13
54 38.29 85.19 48.13 6.11 1.43 3 0.22
55 47.24 132.10 59.68 2.47 1.43 – 0.15
56 194.59 558.88 58.04 0.70 2.00 0.08 0.18
57 18.32 – 16.59 2.73 1.45 – 0.07
58 146.18 112.99 69.69 3.81 1.51 0.38 0.28
59 107.98 101.77 59.69 2.46 1.45
1.24 1.30
0.2 0.2 0.85
0.09
60 38.55 1289.77 59.04 3.05 2.00 0.38
0.50 0.40
61 24.70 94.38 61.94 1.69 1.45
1.30 1.14
0.82 0.23
62 24.43 39.60 52.66 1.31 2.00 – 0.15
63 12.32 965.73 60.08 2.31 1.42 – 0.53
64 18.38 9.82 50.90 1.70 1.45 – 0.27
65 7.28 27.89 13.89 1.43 2.00 – 0.22
66 118.71 76.09 66.94 1.55 1.26
1.25 13.51 9.66 19.44
0.17
67 152.17 85.69 61.84 0.74 1.23
1.42 1.21
4.89 3.10 3.32 1.59
0.20
68 53.01 403.87 64.82 2.78 1.14 – 0.33
69 11.70 197.91 48.41 2.55 1.59 1.38 0.41
70 28.94 742.88 33.88 5.36 1.42 – 0.49
71 24.79 10.93 43.62 3.22 1.59 – 0.44
72 98.37 137.32 57.94 1.77 1.25 – 0.36
73 14.85 69.15 70.96 3.42 – – 0.36
74 20.40 129.56 62.15 2.74 1.23
1.68
– 0.31
75 22.75 212.17 63.63 2.27 1.59 1.97 0.42
76 12.66 98.62 58.45 2.45 1.68 – 0.31
1282 M. Arian and Z. Aram: Relative tectonic activity classification in the Kermanshah area
Table 1. Continued.
Sub-basin Area SL Af Bs J Vf Hi
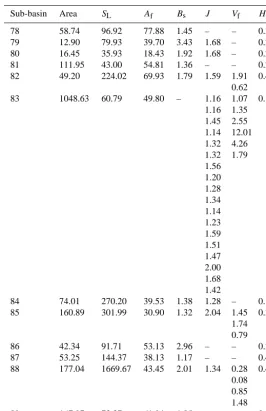
78 58.74 96.92 77.88 1.45 – – 0.32
79 12.90 79.93 39.70 3.43 1.68 – 0.29
80 16.45 35.93 18.43 1.92 1.68 – 0.24
81 111.95 43.00 54.81 1.36 – – 0.25
82 49.20 224.02 69.93 1.79 1.59 1.91
0.62 0.42
83 1048.63 60.79 49.80 – 1.16
1.16 1.45 1.14 1.32 1.32 1.56 1.20 1.28 1.34 1.14 1.23 1.59 1.51 1.47 2.00 1.68 1.42
1.07 1.35 2.55 12.01 4.26 1.79
0.13
84 74.01 270.20 39.53 1.38 1.28 – 0.15
85 160.89 301.99 30.90 1.32 2.04 1.45
1.74 0.79
0.38
86 42.34 91.71 53.13 2.96 – – 0.21
87 53.25 144.37 38.13 1.17 – – 0.43
88 177.04 1669.67 43.45 2.01 1.34 0.28
0.08 0.85 1.48
0.40
89 167.97 73.37 61.94 1.05 – – 0.26
(older alluvial fan deposits), moderate resistance (shale, silt), high resistance (limestone, tuff, conglomerate, sandstone) and very high resistance (monzodiorite, monzogabbro, quar-tesite) are specified (Memarian, 2001).
By studyingSLvalues, it can be seen that in the northern part of the area, in spite of the existence of very highly re-sistant stone, the SLvalue decreases (Fig. 3). The reason is the intense breakage of sediments and volcanic rocks, which thrust onto others by up-thrusting. Most of the sub-basins with high and moderateSLvalues are located in the middle part of the study area, which has the same trending and strike as the main valleys and faults (north-west to south-east). Ma-jor exposed rocks above the area are crushed limestone. In the southern part of the area, the tectonic activity is often low, due to it going out from the active fault, low resistance of the rock, and young alluvial deposits. Some of the
longi-tudinal river profiles and the measuredSLindex are shown in Fig. 5.
3.2 Asymmetry factor (Af)
This index is related to two-tectonic and no-tectonic factors. No-tectonic factors may relate to lithology and rock fabrics. It is a way of evaluating the existence of tectonic tilting at the scale of a drainage basin. The method may be applied over a relatively large area (Hare and Gardner, 1985; Keller and Pinter, 2002). The index is defined as follows:
Af=(Ar/At)100, (2)
whereAr is the right-side area of the master stream basin (looking downstream) andAtis the total area of the basin that can be measured by Geographic Information System (GIS) software. To calculate this index in the area,At andAr are
Basin 17
1350 1400 1450 1500 1550 1600 1650
0 2000 4000 6000 8000 10000 12000 14000
Distance(m)
Al
ti
tude
(m)
0 50 100 150 200 250
SL index
A B C D
C SL
River actual profile
D:Shale C:Limestone B: Undivided rock A: Gravel
Basin 60
0 500 1000 1500 2000 2500 3000
0 2000 4000 6000 8000 10000 12000 14000 16000 Distance(m)
Al
ti
tude
(m)
0 500 1000 1500 2000 2500 3000 3500 4000
SL inde
x
A
B B: Limestone A: Gravel
SL
River actual profile
Figure 5. Longitudinal river profiles and measuredSLvalues for three sub-basins in the study area.
obtained using the sub-basins and the master river maps.Af is close to 50 if there is no or little tilting perpendicular to the direction of the master stream.Afis significantly greater or smaller than 50 under the effects of active tectonics or strong lithologic control. The values of this index are divided into three categories: 1 (Af<35 or Af>63), 2 (57< Af<65 or 35< Af<43) and 3 (43< Af<57) (El Hamdouni et al., 2008) (Table 1).
Among the obtained values, the minimum value belongs to sub-basin 65, with 13.89 %, and the maximum value belongs to sub-basin 6, with 91.81 %. Regarding this index, we often see that all categories are scattered in the region, but class 3 is seen in the valleys and the sub-basins with low depth, and class 1 is spotted in the south-western margin of the study area.
3.3 Hypsometric integral index (Hi)
1284 M. Arian and Z. Aram: Relative tectonic activity classification in the Kermanshah area
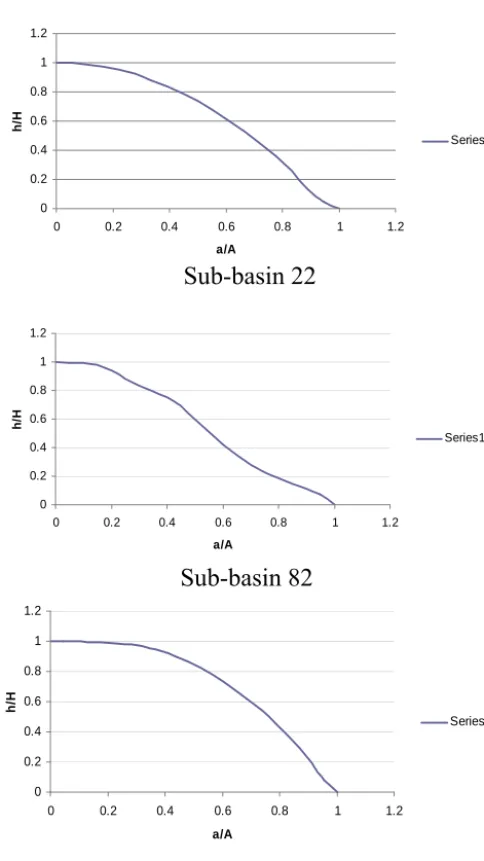
26
-457
Sub
-
basin 22
458
459
460
461
Sub
-
basin 82
462
463
464
465
Sub
-
basin 89
466
467
468
Figure 6.
Hypsometry- curves of 3
sub-basins
in the study area. (A) is the total surface
469
of the basin. (a) is the surface area within the basin above a given line of elevation(h).
470
(H) is the highest elevation of the basin.
471
472
0 0.2 0.4 0.6 0.8 1 1.20 0.2 0.4 0.6 0.8 1 1.2
a/A h/ H Series1 0 0.2 0.4 0.6 0.8 1 1.2
0 0.2 0.4 0.6 0.8 1 1.2
a/A h/ H Series1 0 0.2 0.4 0.6 0.8 1 1.2
0 0.2 0.4 0.6 0.8 1 1.2
a/A
h/H
Series1
Figure 6. Hypsometry curves of three sub-basins in the study area. A is the total surface of the basin. a is the surface area within the
basin above a given line of elevation h. H is the highest elevation of the basin.
The hypsometric integral reveals the maturity stages of to-pography that can, indirectly, be an indicator of active tec-tonics.
In general, high values of the hypsometric integral are con-vex, and these values are generally greater than 0.5. Interme-diate values tend to be more concave convex or straight, and generally have values between 0.4 and 0.5. Finally, lower val-ues (<0.4) tend to have concave shapes (El Hamdouni et al., 2008).
The interesting point in the interpretation of the hypso-metric index map is that the high to moderate values are ap-proximately in the middle part of the study area, and they are almost similar toSLanomalies too. The high and
mod-erate values in this part have NE–SW trending (according to the trending of the area fault). Of course, there are other sub-basins with high and moderate values that after the men-tioned area often show an increase in sub-basins which are located close to the Gharasu River in the south-eastern cor-ner of the study area.
3.4 Valley floor width–valley height ratio (Vf)
Another index sensitive to tectonic uplift is the valley floor width to valley height ratio (Vf). This index can separate v-shaped valleys with small amounts from u-v-shaped valleys with greater amounts. The calculation formula is in this man-ner:
Vf=2Vf,w/ (Ald+Ard−2Asc) , (3) whereVf,wis the width of the valley floor, andAld,Ard and Asc are the altitudes of the left and right divisions (look-ing downstream) and the stream channel, respectively (Bull, 2007). Bull and McFadden (1977) found significant differ-ences inVfbetween tectonically active and inactive mountain fronts. Also, they found significant differences inVfbetween tectonically active and inactive mountain fronts (Fig. 7), be-cause a valley floor is narrowed due to rapid stream down-cutting.
Valleys upstream from the mountain front tend to be narrow (Ramirez-Herrera, 1998), and Vf is usually com-puted at a given distance upstream from the mountain front (Silva et al., 2003). We set a distance to 2 km, and within the mountain range. TheVfof the main transverse valleys in the study area was calculated by a cross section that is drawn from the DEM and the topographic map (Fig. 8).
TheVf,w value is obtained by measuring the length of a line which cuts the river and is limited to two sides of a con-tour through which the river crosses. Values ofAld(Altitude of the river-right valley divide) ,Ard(Altitude of the river-left valley divide), andAsc (Altitude of the stream channel) are measured using the drawn profile. Since finding that the place ofVfis independent of the sub-basins, it is possible that some of them have noVfvalue and that some others have various Vfvalues (Table 1).Vfvalues are divided into three classes: 1 (Vf<0.3), 2 (0.3< Vf<1), and 3 (Vf>1) (El Hamdouni, 2008) (Fig. 9).
Some sub-basins, due to the lack of a suitable valley, have no value, and others have values from zero for sub-basin 1 to 19.44 for sub-basin 66. Most of the valleys are in class 3 and show U-shaped valleys, but the moderate to high values are often located in the northern part of the study area. The inter-esting point is that in the middle part of the area, theVfindex in the north-westerly–south-easterly direction in the same di-rection as other indices such asSLandHishows moderate to high classes, which is in accordance with the main faults of the Zagros.
M. Arian and Z. Aram: Relative tectonic activity classification in the Kermanshah area 1285
27 - 474
475
Figure7 .Thirty-six Mountain fronts for the assessment of the J index. 476
Figure 7. Thirty-six mountain fronts for the assessment of theJ index.
3.5 Basin shape index (Bs)
Relatively young drainage basins in active tectonic areas tend to be more elongated than their normal shape on the to-pographic slope of a mountain. The elongated shape tends to evolve into a more circular shape (Bull and McFadden, 1977). The horizontal projection of the basin shape may be described by the basin shape index or elongation ratio, Bs (Cannon, 1976; Ramirez-Herrera, 1998). The calculation for-mula isBs=Bl/Bw, whereBlis the length of the basin mea-sured from the headwater to the mountain, and Bw is the basin width at the widest point of the basin.
To calculate this index in the area,BlandBware obtained using the sub-basins and the master river maps; then, the val-ues are divided into three classes: 1 (Bs>4), 2 (3< Bs<4), and 3 (Bs<3) (El Hamdouni et al., 2008) (Fig. 9; Table 1). The minimum value belongs to sub-basin 56, with 0.7, and the maximum value belongs to sub-basin 31, with 6.37. The other sub-basins have values between these two values.
Bsvalues show a few activities in most parts of the study area, but classes 2 and 3 are often scattered in the south-western margin and the middle part of the study area.
Figure 8. Location of the section forVfcalculation.
3.6 Mountain-front sinuosity index (J)
This index represents a balance between stream erosion pro-cesses tending to cut some parts of a mountain front and ac-tive vertical tectonics that tend to produce straight mountain fronts (Bull and McFadden, 1977; Keller, 1986). The index of mountain-front sinuosity (Bull and McFadden, 1977; Bull, 2007) is defined by
J=Lj/Ls, (4)
whereLj is the planimetric length of the mountain along the mountain–piedmont junction, andLsis the straight-line length of the front. The mountain fronts of the study area are drawn by fault and fold sites.J is commonly less than 3, and approaches 1 where steep mountains rise rapidly along a fault or fold (Bull, 2007). Therefore, this index can play an important role in tectonic activity. Considering the fact that mountain-front sites are independent of sub-basin places, chances are that some of them have various fronts and that the others have no mountain fronts (Table 1).
Values ofJ are readily calculated from topographic maps or aerial photography for 36 mountain fronts (Fig. 7).J val-ues are divided into three classes: 1 (J <1.1), 2 (1.1< J < 1.5), and 3 (J >1.5) (El Hamdouni, 2008).
1286 M. Arian and Z. Aram: Relative tectonic activity classification in the Kermanshah area
Figure 9. Distribution of six indices,Hi,Vf,J,Bs,Af, andSL, and classification of them into three classes.
4 Results and discussion
The average of the six measured geomorphic indices (Vf,J, Bs,Af,Hi, andSL) was used to evaluate the distribution of relative tectonic activity. Each of the indices was divided into three classes. By averaging these six indices, we obtain one index that is a known relative active tectonic (Iat) (El Ham-douni et al., 2008). The values of the index were divided into
four classes to define the degree of active tectonics: 1 – very high (1< Iat<1.5), 2 – high (1.5< Iat<2), 3 – moderate (2< Iat<2.5), and 4 – low (2.5< Iat) (El Hamdouni et al., 2008)
The distribution of these four classes is shown in Fig. 10. In this map, the high and moderate values of Iat in the middle part of the area are obvious, and sub-basins 1, 2, and 6 (at the end of the south-western part of the area) have high to
M. Arian and Z. Aram: Relative tectonic activity classification in the Kermanshah area 1287
30 - 485
486 487
Figure10. Distribution of Iat classes. 488
Figure 10. Distribution ofIatclasses. 489 490 491 492 493 494 495
Figure 11. A view of faulting at north of the study area, looking to north western. 496 497 498 499 500 501 502 503 504 505 506 507 508 509 510 511
Figure 11. A view of faulting north of the study area, looking to the
north-west.
moderate values of Iat too. Table 2 shows the result of the classification for each sub-basin. Also, based on Arian and Hashemi (2008), this area is a high seismic risk zone, with the following seismicity parameters:a=3.79,b=0.50, and β=1.72, and lambda forM=4 is 1.47.
In the study area from the south to the north, we have three subdivisions: (1) autochthon Zagros; (2) radiolaritic over-thrust nappes, Bisotun limestone and Ophiolite; and a (3) thin imbricate fan (thrust sequence) (Broud, 1979). In the north-ern parts of the area, complexities of flysch (Cretaceous– Paleocene) and Ophiolite assemblage (like disturbed basic layers) appear.
In the Neogene, basic magma intruded along the Mor-varide fault (Fig. 11) and formed a broad gabbro-diorite
mas32
-512 513 514
515
Figure12 .Intense folding and crushing in Biseton limestone located 60km northeast of
516
the village Bencheleh, looking toward northeastern. 517 518 519 520 521 522 523 524 525
Figure 12. Intense folding and crushing in Biseton limestone
lo-cated 60 km north-east of the village of Bencheleh, looking towards the north-east. 33 - 526 527 528 529
Figure 13. A view of the Kuh-e Sefid Fault located 6km east of Halashi, looking 530 toward north. 531 532 533 534 535 536 537 538 539 540 541 542 543 544 545
Figure 13. A view of the Koh-e Sefid fault located 6 km east of
Halashi, looking north.
sive body in the northern Kamyaran. The function of tectonic phases results in the existence of regional metamorphisms such as green schist facies in flysch stones (Cretaceous– Paleocene). The traces of this metamorphism cause the ap-pearance of serpentine in the area (Sadeghian and Delavar, 2007).
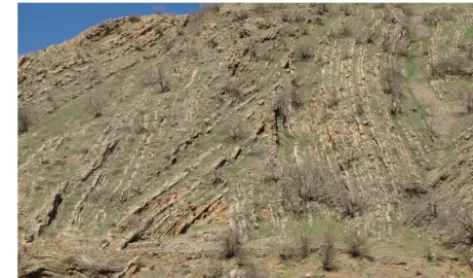
In the southern part of the area, thrust faults of a listric extensional kind are seen, striking from north-northwest to south-southeast (Karimi, 1999). It seems that the activity of these faults led to an increase in the relative tectonic activity of class 3. The limestone of Bisotun and the radiolarite of Kermanshah, which are extended in the centre of the study area, are separated from autochthon Zagros by the Koh-e Sefid fault. Bisotun limestone is a very thick and mainly stony unit which contains upper Triassic to upper Cretaceous age range (Braud, 1979). Bisotun limestone has intense folds (Fig. 12) and faults in the area which have caused the creation of important anticlines such as Dokral, Naraman, Chalabad, and Shahoo in their direction, and classes 1, 2, and 3 of the Iat
1288 M. Arian and Z. Aram: Relative tectonic activity classification in the Kermanshah area
Table 2. Classification of theIat(relative tectonic activity index) in the sub-basins of the Gharasu River basin (SL: stream length – gradient index;Af: drainage basin asymmetry;Hi: hypsometric integral;Vf: ratio of the valley floor width to the valley height;Bs: index of drainage basin shape;J: index of mountain-front sinuosity).
Sub-basin Area SL Af Bs J Vf Hi S/n Iat
1 135.41 3 1 3 2 1 1 1.83 2
2 12.97 3 1 3 2 – 3 2.40 3
3 9.32 3 2 2 2 – 3 2.40 3
4 7.98 3 3 2 2 – 3 2.60 4
5 11.02 3 1 3 2 – 3 2.40 3
6 76.51 3 1 3 2 – 3 2.40 3
7 20.20 3 1 1 2 – 3 2.00 3
8 10.36 3 2 2 – – 3 2.50 4
9 19.54 2 3 3 – – 3 2.75 4
10 19.40 3 2 3 – – 2 2.50 4
11 12.51 3 1 3 3 3 2 2.50 4
12 13.81 3 1 3 2 – 3 2.40 3
13 33.56 3 3 3 – – 2 2.75 4
14 48.18 3 2 3 – – 3 2.75 4
15 66.80 3 2 3 2 3 3 2.67 4
16 56.55 3 1 3 2 – 3 2.40 3
17 28.44 3 3 3 2 – 2 2.60 4
18 10.29 3 3 3 – – 2 2.75 4
19 31.38 3 1 3 2 3 3 2.50 4
20 22.68 3 1 3 – – 3 2.50 4
21 38.81 1 2 3 2 – 3 2.50 4
22 25.60 3 1 3 – – 3 2.50 4
23 16.40 3 1 3 2 3 3 2.75 4
24 25.76 3 2 3 – – 2 3.00 4
25 11.33 3 3 3 – – 2 2.75 4
26 13.87 3 3 3 – – 3 2.33 3
27 14.46 3 3 3 – – 2 2.80 4
28 12.27 3 2 1 2 3 3 2.50 4
29 21.62 3 3 3 2 – 3 2.25 3
30 22.50 3 1 3 – – 3 2.50 4
31 10.81 3 2 1 – – 3 2.50 4
32 91.41 3 1 3 2 3 3 2.60 4
33 103.42 3 1 3 – – 3 2.80 4
34 157.15 3 2 3 2 – 3 2.60 4
35 51.83 3 3 3 2 – 3 2.75 4
36 15.31 3 2 3 2 – 3 2.67 4
37 21.79 3 2 3 – – 3 2.50 4
38 47.53 3 2 3 2 3 3 2.60 4
39 51.89 3 1 3 – – 3 2.60 4
40 20.21 3 1 3 3 – 3 2.67 4
41 21.29 3 2 3 2 – 3 2.40 3
42 15.00 3 3 3 2 2 3 2.60 4
43 16.98 3 1 3 2 – 3 2.50 4
44 100.39 3 1 3 3 – 3 3.00 4
45 72.40 3 1 3 – – 3 2.40 3
46 35.74 3 3 3 3 3 3 2.50 4
47 105.46 3 1 3 2 – 3 2.67 4
48 21.91 3 1 3 2 3 3 2.50 4
49 9.01 – 2 3 – – 3 2.40 3
50 155.18 3 3 3 2 1 3 2.83 4
51 53.96 3 1 3 2 – 3 2.60 4
52 42.75 3 3 3 2 3 3 2.50 4
53 108.39 3 3 1 3 – 3 2.60 4
Table 2. Continued.
Sub-basin Area SL Af Bs J Vf Hi S/n Iat
54 38.29 3 3 1 2 3 3 2.17 3
55 47.24 3 2 3 2 – 3 2.25 3
56 194.59 1 2 3 3 1 3 2.17 3
57 18.32 – 1 3 2 – 3 2.33 3
58 146.18 3 1 2 3 1 3 1.83 2
59 107.98 3 2 3 2 1 3 2.50 4
60 38.55 1 2 2 3 1 2 3.00 4
61 24.70 3 2 3 2 2 3 2.20 3
62 24.43 3 3 3 3 – 3 2.80 4
63 12.32 3 2 3 2 – 1 2.60 4
64 18.38 3 3 3 2 – 3 2.50 4
65 7.28 3 1 3 3 – 3 2.67 4
66 118.71 3 1 3 2 3 3 2.40 3
67 152.17 3 2 3 2 3 3 2.83 4
68 53.01 2 2 3 2 – 3 1.40 1
69 11.70 3 3 3 3 3 2 2.50 4
70 28.94 1 1 1 2 – 2 2.60 4
71 24.79 3 3 2 – – 2 2.25 3
72 98.37 3 2 3 2 – 3 2.80 4
73 14.85 3 1 2 – – 3 2.67 4
74 20.40 3 2 3 3 – 3 2.80 4
75 22.75 3 2 3 3 3 2 2.60 4
76 12.66 3 2 3 3 – 3 2.50 4
77 81.52 3 2 3 2 – 3 2.60 4
78 58.74 3 1 3 – – 3 2.60 4
79 12.90 3 2 2 3 – 3 3.00 4
80 16.45 3 1 3 3 – 3 2.50 4
81 111.95 3 3 3 – – 3 2.80 4
82 49.20 3 1 3 3 3 2 2.83 4
83 1048.63 3 3 – 2 3 3 2.50 4
84 74.01 3 3 3 2 – 3 2.75 4
85 160.89 3 2 3 3 3 3 2.00 3
86 42.34 3 1 3 – – 3 3.00 4
87 53.25 3 3 3 – – 2 2.80 4
88 177.04 1 2 3 2 2 2 2.50 4
89 167.97 3 3 3 – – 3 2.20 3
Table 3. The area and occupation percentage of each class of geomorphic index.
Class 3 Class 2 Class 1 No value Geomorphic
indices
Occupation Area Occupation Area Occupation Area Occupation Area
percentage percentage percentage percentage
36.2 1981.05 3.8 216.73 13.96 777.88 45.78 2495.17 Vf
17.86 995.22 63.01 3454.9 – – 19.32 1020.72 Sm,f
70.69 3938.40 4.8 264.92 3.92 218.89 19.96 1048.62 Bs
38.47 2143.36 31.6 1730.88 28.65 1596.60 – – Af
87.83 4893.04 1.70 72.54 8.57 477.93 0.69 27.32 SL
1290 M. Arian and Z. Aram: Relative tectonic activity classification in the Kermanshah area
index, which have the same direction as Biseton limestone, are also seen in the area.
The south-western border Kermanshah radiolarite is bounded to the Koh-e Sefid fault (Fig. 13). This fault has thrusted Kermanshah radiolarites onto Amiran flysches.
The thickness of fault breccias in this place reaches up to 100 m. The mentioned breccias are made of radiolarite, lime-stone, and sandstone elements. The activity of the Koh-e Se-fid and Sarab faults can be a reason for the increase in relative tectonic activity at the end of the study area. The Koh-e Sefid anticline (Fig. 7) is located between the Gharasu and Mereg rivers. Although the Mereg source is located 15 km south of the Gharasu River, to reach the Gharasu, this river needs to travel almost 140 km towards the north-west to join the Gha-rasu in the Doab region.
5 Conclusions
It seems that the calculated geomorphic indices by using GIS are suitable for assessment of the tectonic activity of the study area. The geomorphic indices such as stream– gradient index (SL), drainage basin asymmetry (Af), hyp-sometric integral (Hi), valley floor width–valley height ratio (Vf), drainage basin shape (Bs), and mountain-front sinuos-ity (J), are calculated in the Gharasu basin. Therefore, firstly, the area was divided into 89 sub-basins and, for each one, in-dices were calculated; then, all of the inin-dices were divided into three classes. Afterwards, six measured indices for each sub-basin were compounded and a unit index obtained as the relative tectonic activity (Iat). This index was divided into four classes of tectonic activities: very high, high, moderate, and low. The area and occupation percentage for each class of index were calculated. As can be seen (in Table 3), most of the high percentages in the area are located in class 3, which shows low tectonic activity.
The total area is composed of class 1 (Iat) with an area of about 28.94 km2 (0.53 %), class 2 (Iat) with an area of about 173.96 km2(3.18 %), class 3 (Iat) with an area of about 1162.97 km2 (21.26 %), and class 4 (Iat) with an area of about 4104.98 km2(75.03%). Class 1 is located around the Dokeral anticline, class 2 is located to the north-eastern flank of the Nesar and Naraman mountains, class 3 is scattered to the western border of the study area, and a part of it has the same trending, with Bisotun limestone in the middle part of the study area.
The other parts of the area have class 4 ofIat. Sub-basin 68 is a single sub-basin with a very high value ofIatlocated on the Dokeral anticline in the crush zone in Zagros.
Most of the areas with high and moderate values of latitude are located in the crush zone in the Zagros region too. Crush-ing of this zone is due to the main fault mechanism of the Zagros region. Seeing that these faults have a NE–SW direc-tion, the areas with high and moderate values tend to develop in this direction. The results of this paper confirm previous
research in this region. At the end of the eastern part of the study area, the value ofIatis high, which could be the result of the Sarab and Koh-e Sefid fault mechanisms.
Acknowledgement. This work is funded by the department of geology, Islamic Azad University, Science and Research branch, Tehran, Iran. Also, Special thanks to Prof. A. Jordán to refine our article and vice-President for Research in the Science and Research branch, Tehran.
Edited by: A. Jordán
References
Arian, M. and Hashemi, S. A.: Seismotectonic Zoning in the Za-gros, J. Sci., 18, 63–74, 2008.
Braud, J.: Geological map of Kermanshah area, scale 1:250 000 Geologic Survey of Iran, 1979.
Bull, W. B.: Tectonic geomorphology of mountains: a new approach to paleoseismology, Blackwell, Malden, 2007.
Bull, W. B. and McFadden, L. D.: Tectonic geomorphology north and south of the Garlock fault, California, in: Geomorphology in Arid Regions, edited by: Doehring, D. O., Proceedings of the Eighth Annual Geomorphology Symposium, State University of New York, Binghamton, 115–138, 1977.
Cannon, P. J.: Generation of explicit parameters for a quantitative geomorphic study of Mill Creek drainage basin, Oklahoma Ge-ology Notes, 1, 3–16, 1976.
Dehbozorgi, M., Pourkermani, M., Arian, M., Matkan, A. A., Mo-tamedi, H., and Hosseiniasl, A.: Quantitative analysis of relative tectonic activity in the Sarvestan area, central Zagros , Iran. Ge-omorphol., 121, 329–341, 2010.
El Hamdouni, R., Irigaray, C., Fernandez, T., Chacon, J., and Keller, E. A.: Assessment of relative active tectonics, southwest border of Sierra Nevada (southern Spain), Geomorphology, 96, 150– 173, 2008.
Hack, J. T.: Studies of longitudinal stream-profiles in Virginia and Maryland, US Geol. Surv. Profess. Paper, 294B, 45–97, 1957. Hack J. T.: Stream-profiles analysis and stream-gradient index, J.
Res. USA, Geol. Surv., 1, 421–429, 1973.
Hack, J. T.: Physiographic division and differential uplift in the piedmont and Blue Ridge, US Geol. Surv. Profess. Paper, 1265, 1–49, 1982.
Hare, P. W. and Gardner, T. W.: Geomorphic indicators of vertical neotectonism along converging plate margins, Nicoya Peninsula, Costa Rica, in: Tectonic Geomorphology, edited by: Morisawa, M. and Hack, J. T., Proceedings of the 15th Annual Binghamton Geomorphology Symposium, Allen and Unwin, Boston, 123– 134, 1985.
Karimi, A. R.: Geological map of Kermanshah area, scale 1: 100 000, Geologic Survey of Iran, 1999.
Keller, E. A.: Investigation of active tectonics: use of surficial Earth processes, in: Active tectonics, edited by: Wallace, R. E., Studies in Geophysics, National Academy press, Washington DC, 136– 147, 1986.
Keller, E. A. and Pinter, N.: Active tectonics: Earthquakes, Uplift, and Landscape (2nd Edn.), Prentice Hall, New Jersey, 432, 2002.
Memarian, H.: Geology for engineers, Tehran University Press, 2001 (in Persian).
Mirzaei, N., Gao, M., and Chen, Y. T.: seismic source regionaliza-tion for seismic zoning of Iran: Major seismotectonic provinces, J. Earth. Predict. Res., 7, 465–495, 1998.
Molin, P., Pazzaglia, F. J., and Dramis, F.: Geomorphic expression of active tectonics in a rapidly-deforming forearc, sila massif, Calabria, southern Italy, Am. J. Sci., 304, 559–589, 2004. Nazari, H.: Geological map of Harsin area scale 1:100 000,
Geo-logic Survey of Iran, 1998.
Ramirez-Herrera, M. T.: Geomorphic assessment of active tectonics in the Acambay Graben, Mexican volcanic belt, Earth Surf. Proc. Land., 23, 317–332, 1998.
Rockwell, T. K., Keller, E. A., and Jonson, D. L.: Tectonic geomor-phology of alluvial fans and mountain fronts near Ventura, Cal-ifornia, in: Tectonic Geomorphology, edited by: Morisawa, M., Proceedings of the 15th Annual Geomorphology Symposium, Allen and Unwin Publishers, Boston, 183–207, 1985.
Sadeghian, M. and Delavar, S. T.: Geological map of Kamyaran area scale 1:100 000, Geologic Survey of Iran, 2007.
Silva, P. G.: Evolutiongeodinamica de la depression del Guadalentindesde el Miocene superior hasta la Actualidad: Neotectonic age omorfologia, Ph.D. Dissertation, Complutense University, Madrid, 1994.
Silva, P. G., Goy, J. L., Zazo, C., and Bardajm, T.: Fault generated mountain fronts in Southeast Spain: geomorphologic assessment of tectonic and earthquake activity, Geomorphology, 250, 203– 226, 2003.
Strahler, A. N.: Hypsometric (area-altitude) analysis of erosional topography, Geol. Soc. Am. Bull., 63, 1117–1142, 1952. Wells, S. G., Bullard, T. F., Menges, T. M., Drake, P. G., Karas, P.