SXUCFN-Core: STS Models Integrating FrameNet Parsing Information
Sai Wang, Ru Li, RuiboWang, ZhiqiangWang, Xia Zhang Shanxi University, Taiyuan, China
enrique.s.wang@gmail.com {liru, wangruibo}@sxu.edu.cn {zhiq.wang, caesarzhangx}@163.com
Abstract
This paper describes our system submitted to *SEM 2013 Semantic Textual Similarity (STS) core task which aims to measure semantic si-milarity of two given text snippets. In this shared task, we propose an interpolation STS model named Model_LIM integrating Fra-meNet parsing information, which has a good performance with low time complexity com-pared with former submissions.
1 Introduction
The goal of Semantic Textual Similarity (STS) is to measure semantic similarity of two given text snippets. STS has been recently proposed by Agirre et al. (2012) as a pilot task, which has close relationship with both tasks of Textual Entailment and Paraphrase, but not equivalent with them and it is more directly applicable to a number of NLP tasks such as Question Answering (Lin and Pantel, 2001), Text Summarization (Hatzivassiloglou et al., 1999), etc. And yet, the acquiring of sentence simi-larity has been the most important and basic task in STS. Therefore, the STS core task of *SEM 2013 conference, is formally defined as the degree of semantic equivalence between two sentences as follows:
5: completely equivalent, as they mean the same thing.
4: mostly equivalent, but some unimpor-tant details differ.
3: roughly equivalent, but some impor-tant information differs/missing.
2: not equivalent, but share some details.
1: not equivalent, but are on the same top-ic.
0: on different topics.
In this paper, we attempt to integrate semantic information into STS task besides the lower-level word and syntactic information. Evaluation results show that our STS model could benefit from se-mantic parsing information of two text snippets. The rest of the paper is organized as follows: Sec-tion 2 reviews prior researches on STS. SecSec-tion 3 illustrates three models measuring text similarity. Section 4 describes the linear interpolation model in detail. Section 5 provides the experimental re-sults on the development set as well as the official results on all published datasets. Finally, Section 6 summarizes our paper with direction for future works.
2 Related Work
Several techniques have been developed for STS. The typical approach to finding the similarity be-tween two text segments is to use simple word matching method. In order to improve this simple method, Mihalcea et al. (2006) combine two cor-pus-based and six knowledge-based measures of word similarity, but the cost of their algorithm is expensive. In contrast, our method treats words and texts in essentially the same way.
In 2012 STS task, 35 teams participate and sub-mit 88 runs. The two top scoring systems are UKP
and Takelab. The former system (Bär et al., 2012) uses a simple log-linear regression model to com-bine multiple text similarity measures (related to content, structure and style) of varying complexity.
While the latter system Takelab (Šarić et al., 2012)
uses a support vector regression model with mul-tiple features measuring word-overlap similarity and syntax similarity.
The results of them score over 80%, far exceed-ing that of a simple lexical baseline. But both share one characteristic: they integrate lexical and syntax information without semantic information, espe-cially FrameNet parsing information. In addition, the complexity of these algorithms is very high. Therefore, we propose a different and simple mod-el integrating FrameNet parsing information in this paper.
3 Linear Interpolation Model
In this paper, we propose a combination interpola-tion model which is constructed by the results of three similarity models based on words, WordNet, FrameNet , which are called simWD(·), simWN(·) and
simFN(·) respectively. The overall similarity
simLIM(S1, S2) between a pair of texts S1, S2 is
com-puted in the following equation:
simLIM(S1, S2)=ω1 · simWD(S1, S2)
+ω2 · simWN(S1, S2) +ω3 · simFN(S1, S2)
(1)
In which, ω1, ω2and ω3 are respectively the
weights of the similarity models, i.e.,ω1 +ω2+ω3
= 1; and they are all positive hyperparameters. Now, we describe the three models used in this equation.
3.1 Similarity Based on Words
This model is motivated by Vector Space Model (Salton et al., 1975). We present each sentence as a
vector in the multidimensional token space. Let Sc
denote the set of all words in the c-th text snippets
(c = 1, 2); the words of bag is W = S1 S2. Hence,
the similarity of a pair of sentences, formally ex-pressed as:
simWD(S1, S2) =
∑| | , · ,
∑| | , · ∑| | , (2)
In which, we can find , 1,2, … , | |;
1,2 by solving:
, 1,0, , (3)
From these two equations above, we can see the more identical words in a text pair, the more simi-lar the two snippets are. Whereas, by intuition, many high-frequency functional words would not be helpful to the estimation of the similarity given in Eq.(2). Therefore, in the preprocessing stage, we compute the word frequencies per dataset, and then remove the high frequency words (top 1% in fre-quency list) in each segment.
3.2 Similarity Based on WordNet
This model measures semantic similarity with the help of such resources that specifically encode re-lations between words or concepts like WordNet (Fellbaum, 1998). We use the algorithms by Lin (1998) on WordNet to compute the similarity be-tween two words a and b, which we call simLin(a,
b). Let S1, S2 be the two word sets of two given text
snippets, we use the method below:
simWN(S1, S2)
= ∑ , · ,
| |,| |
| |,| |
(4)
In which, , 1,2 . In the numerator of
Eq.(4),we try to max(·), avg(·) and mid(·) respec-tively, then we find the max(·) is the best.
3.3 Similarity Based on FrameNet
FrameNet lexicon (Fillmore et al., 2003) is a rich linguistic resource containing expert knowledge about lexical and predicate-argument semantics in English. In a sentence, word or phrase tokens that
evoke a frame are known as targets. Each frame
definition also includes a set of frame elements, or
roles, corresponding to different aspects of the
concept represented by the frame, such as
partici-pants, props, and attributes. We use the term
ar-gument to refer to a sequence of word tokens
annotated as filling a frame role.
All the data are automatically parsed by
SEMFOR1 (Das and Smith, 2012; Das and Smith,
2011). Figure 1 shows the parser output of a sen-tence pair given in Microsoft Research Video De-scription Corpus with annotated targets, frames and role argument pairs. It can be noticed that FrameNet parsing information could give some clues of the similarity of two given snippets and we think that integrating this information could improve the accuracy of STS task. For example, the sentences in the Figure 1 both illustrate “some-body is moving”. However, our model depends on the precision of that parser. If it would be im-proved, the results in STS task would be better.
Figure 1: This is a pair of sentences in 2013 STS train-ing data: (a) Girls are walking on the stage; (b) Women models are walking down a catwalk. The words in bold correspond to targets, which evoke semantic frames that are denoted in capital letters. Every frame is shown in a distinct color; the arguments of each frame are anno-tated with the same color, and marked below the sen-tence, at different levels; the spans marked in the block of dotted liens fulfill a specific role.
For a given sentence Sc (c = 1,2) with a set of
evoked frame Fc = < f1,f2, …, fn > (n is the number
of evoked frames), a set of target word with each frame Tc = < t1, t2, …, tn > and the set of roles
(namely, frame elements) c = {Rc,1, Rc,2, …,Rc,n},
each frame contains one or more arguments
Rc,i = {rj} (i = 1, 2, …, n; j is an integer that is
greater or equal to zero). Take Figure 1 as an ex-ample,
T1= <grils, walking>,
F1= <PEOPLE, SELF_MOTION>, 1= {R1,1, R1,2},
R1,1 = {girls},
R1,2 = {girls, on the stage};
T2 = <women, models, walking, down>,
F2= <PEOPLE, VEHICLE,
SELF_MOTION, DIRECTION>,
2 = {R2,1, R2,2, R2,3, R2,4},
R2,1= {women}, R2,2 = {models},
R2,3 = {women models}, R2,4 = {down}.
In order to compute simFr(·) simply, we also use
a interpolation model to combine the similarities based on target words simTg(·), frames simFr(·) and
frame relations simRe(·). They are estimated as the
following:
When computing the similarity on target word level simTg(S1, S2), we also consider each sentence
as a vector of target words as is seen in Eq.(5).
T = T1 T2;
simTg(S1, S2)=
∑|T| , · ,
∑| | , · ∑| | ,
(5)
In which, we can find t , 1,2, … , | |;
1,2 by solving:
,
1, , ,
1,2, … , | | 0,
(6)
Let simFr(S1, S2) be the similarity on frame level
as shown in Eq.(7), with each sentence as a vector of frames. We define f1,i, f2,i like , in Eq.(3).
F = F1 F2;
simFr(S1, S2)=
∑| | , · ,
∑| | , · ∑| | ,
(7)
Before computing the role relationship between
the pair of sentences, we should find the
contain-ment relationship of each pair of frames in one
sentence. We use a rule to define the containment relationship:
Given two frames fc,i, fc,j in a sentence Sc, if
, , , then fc,j contains fc,i - and that is
fc,i is a child of fc,j. After that we add them into the
set of frame relationship ,, ,
, , 0 .
We consider the relationship between two frames in a sentence as a 2-tuple, and again use Figure 1 as an example,
Rlt1 = <PEOPLE, SELF_MOTION> ;
Rlt2 = <PEOPLE, SELF_MOTION>,
Besides, we do exactly the same with both
frames, namely , c 1,2 the value
of , is 1. The similarity on frame relationship
level simRe(S1, S2) presents each sentence as a
vec-tor of roles as shown in Eq.(8).
Rlt = Rlt1 Rlt2;
simRe(S1, S2)=
∑| | , · ,
∑| | , · ∑| | ,
(8)
Lastly, the shallow semantic similarity between two given sentences is computed as:
SimFN(S1, S2)=α · simTg(S1, S2)
+β · simFr(S1, S2) +γ · simRe(S1, S2)
(9)
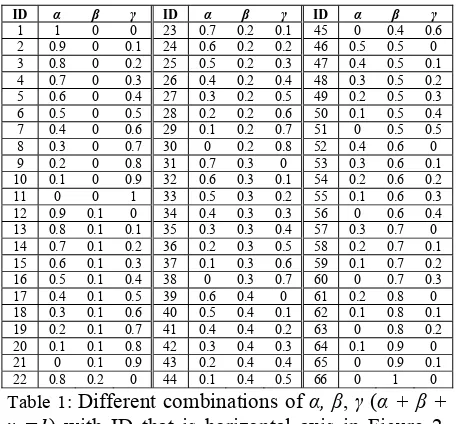
[image:4.612.316.535.80.227.2]In which, α + β + γ =1, and they are all positive hyperparameters. As shown in Figure 2, we plot the Pearson correlation (vertical axis) against the combination of parameters (horizontal axis) in all 2013 STS train data (2012 STS data). We notice that generally the Pearson correlation is fluctuates, and the correlation peak is found at 32, which in Table 1 is α=0.6, β=0.3, γ=0.1.
[image:4.612.75.303.399.611.2]ID α β γ ID α β γ ID α β γ 1 1 0 0 23 0.7 0.2 0.1 45 0 0.4 0.6 2 0.9 0 0.1 24 0.6 0.2 0.2 46 0.5 0.5 0 3 0.8 0 0.2 25 0.5 0.2 0.3 47 0.4 0.5 0.1 4 0.7 0 0.3 26 0.4 0.2 0.4 48 0.3 0.5 0.2 5 0.6 0 0.4 27 0.3 0.2 0.5 49 0.2 0.5 0.3 6 0.5 0 0.5 28 0.2 0.2 0.6 50 0.1 0.5 0.4 7 0.4 0 0.6 29 0.1 0.2 0.7 51 0 0.5 0.5 8 0.3 0 0.7 30 0 0.2 0.8 52 0.4 0.6 0 9 0.2 0 0.8 31 0.7 0.3 0 53 0.3 0.6 0.1 10 0.1 0 0.9 32 0.6 0.3 0.1 54 0.2 0.6 0.2 11 0 0 1 33 0.5 0.3 0.2 55 0.1 0.6 0.3 12 0.9 0.1 0 34 0.4 0.3 0.3 56 0 0.6 0.4 13 0.8 0.1 0.1 35 0.3 0.3 0.4 57 0.3 0.7 0 14 0.7 0.1 0.2 36 0.2 0.3 0.5 58 0.2 0.7 0.1 15 0.6 0.1 0.3 37 0.1 0.3 0.6 59 0.1 0.7 0.2 16 0.5 0.1 0.4 38 0 0.3 0.7 60 0 0.7 0.3 17 0.4 0.1 0.5 39 0.6 0.4 0 61 0.2 0.8 0 18 0.3 0.1 0.6 40 0.5 0.4 0.1 62 0.1 0.8 0.1 19 0.2 0.1 0.7 41 0.4 0.4 0.2 63 0 0.8 0.2 20 0.1 0.1 0.8 42 0.3 0.4 0.3 64 0.1 0.9 0 21 0 0.1 0.9 43 0.2 0.4 0.4 65 0 0.9 0.1 22 0.8 0.2 0 44 0.1 0.4 0.5 66 0 1 0 Table 1: Different combinations of α, β, γ(α + β +
γ =1) with ID that is horizontal axis in Figure 2.
This table also apples to different combinations of
ω1, ω2, ω3 (ω1 +ω2 +ω3 =1) with ID that is
hori-zontal axis in Figure 3.
Figure 2: This graph shows the variation of Pearson correlation (vertical axis) in all 2013 STS train data (2012 STS data), with numbers (horizontal axis) indicat-ing different combinations α, β, γ in Table 1 and when the value of result confidence is 100. The effect values are represented by a vertical line (i.e. ID = 32).
4 Tuning Hyperparameters
Eq.(1) is a very simple linear interpolation model, and we tune the hyperparameters on the whole 2012 STS data.
As shown in Figure 3,we plot the Pearson corre-lation (vertical axis) for the different combination of parameters ω1, ω2 and ω3 (horizontal axis). We
notice that generally the Pearson correlation fluc-tuates with a dropping tendency in most cases, and the correlation peak presents at 13, which in Table 1 is ω1=0.8, ω2=0.1, ω3=0.1.
[image:4.612.316.536.478.621.2]5 Results
We submit four runs: the first one (Model_WD) is based on word similarity; the second one (Mod-el_WN) which is only using the similarity based on WordNet, is submitted with the team name of SXULLL; the third one (Model_FN) which uses FrameNet similarity defined in Section 3.3; and the last one in which we combine the three similarities described in Section 4 together with an interpola-tion model. In addiinterpola-tion, we map our outputs mul-tiply by five to the [0-5] range.
It is worth notice that in the first model, we lo-wercase all words and remove all numbers and punctuations. And in the third model, we extract all frame-semantic roles with SEMFOR.
In the experiment, we use eight datasets totally - namely MSRpar, MSRvid, SMTeuroparl, OnWN, SMTnews, headlines, FNWN and SMT - with their gold standard file to evaluate the performance of the submitted systems. Evaluation is carried out using the official scorer which computes Pearson correlation between the human rated similarity scores and the system’s output. The final measure is the score that is weighted by the number of text pairs in each dataset (”Mean”). See Agirre et al. (2012) for a full description of the metrics.
5.1 Experiments on STS 2012 Data
There is no new train data in 2013, so we use 2012 data as train data. From Table 2, 3 we can see that the Model_LIM has better performance than the other three models.
MSRpar MSRvid SMTeuroparl Mean
[image:5.612.83.298.504.551.2]Model_WD 0.4532 0.4487 0.6467 0.5153 Model_WN 0.2718 0.5410 0.6225 0.4774 Model_FN 0.4437 0.5530 0.5178 0.5048 Model_LIM 0.4896 0.5533 0.6681 0.5696 Table 2: Performances of the four models on 2012 train data. The highest correlation in each column is given in bold.
From Table 2, we notice that all the models ex-cept Model_FN, are apt to handle the SMTeuroparl that involves long sentences. For Model_FN, it performs well in computing on short and similarly structured texts such as MSRvid (This will be con-firmed in test data later). Although WordNet and FrameNet model has a mere weight of 20% in
Model_LIM (i.e. ω1 +ω2 = 0.2), the run which
in-tegrate more semantic information displays a
con-sistent performance across the three train sets (es-pecially in SMTeuroparl, the Pearson correlation rises from 0.5178 to 0.66808), when compared to the other three.
MSRpar MSRvid SMTeuroparl OnWN SMTnews Mean
Baseline 0.4334 0.2996 0.4542 0.5864 0.3908 0.4356
Model_WD 0.4404 0.5464 0.5059 0.6751 0.4583 0.5346
Model_WN 0.1247 0.6608 0.0637 0.4089 0.3436 0.3417
Model_FN 0.3830 0.6082 0.3537 0.6091 0.4061 0.4905
Model_LIM 0.4489 0.6301 0.5086 0.6841 0.4872 0.5631
UKP_run2 0.6830 0.8739 0.5280 0.6641 0.4937 0.6773 Table 3: Performances of our three models as well as the baseline and UKP_run2 (that is ranked 1 in last STS task) results on 2012 test data. The highest correlation in each column is given in bold.
The 2012 STS test results obtained by first rank-ing UKP_run2 and baseline system are shown in Table 3, it is interesting to notice that performance of Model_WD is similar with Model_LIM except on MSRvid, the text segments in which there are fewer identical words because of the semantic equivalence. For Model_FN, we can see it per-forms well on short and similarly structured texts (MSRvid and OnWN) as mentioned before. This is because the precision of FrameNet parser took ef-fect on the FrameNet-based models performance. Compared to UKP_run2, the performance of Mod-el_LIM is obviously better on OnWN set, while on SMTeuroparl and SMTnews this model scores slightly lower than UKP_run2. Finally, Mod-el_LIM did not perform best on MSRpar and MSRvid compared with UKP_run2, but it has low time complexity and integrates semantic informa-tion.
5.2 Official Results on STS 2013 Test Data
headlines OnWN FNWN SMT Mean
[image:6.612.74.303.92.160.2]Baseline 0.5399 (66) 0.2828 (80) 0.2146 (66) 0.2861 (65) 0.3639 (73) Model_WD 0.6806 (24) 0.5355 (44) 0.3181 (48) 0.3980 (4) 0.5198 (27) Model_WN 0.4840 (78) 0.7146 (12) 0.0415 (83) 0.1543 (86) 0.3944 (69) Model_FN 0.4881 (76) 0.6146 (27) 0.4237 (9) 0.3844 (6) 0.4797 (46) Model_LIM 0.6761 (29) 0.6481 (23) 0.3025 (51) 0.4003 (3) 0.5458 (14)
Table 4: Performances of our systems as well as base-line on STS 2013 individual test data, accompanied by their rank (out of 90) shown in brackets. Scores in bold denote significant improvements over the baseline.
As seen from the system rank in table, the op-timal runs in the three submitted system remain with Model_LIM. Not only Model_LIM performs best on two occasions, but also Model_FN ranks top ten twice, in FNWN and SMT respectively, we owe this result to the contribution of FrameNet parsing information.
6 Conclusion
We have tested all the models on published STS datasets. Compared with the official results, Mod-el_LIM system is apt to handle the SMT that in-volves long sentences. Moreover, this system just integrates words, WordNet and FrameNet semantic information, thus it has low time complexity. There is still much room for improvement in our work. For example, we will attempt to use multiva-riate regression software to tuning the hyperpara-meters.
Acknowledgments
This work is supported by the National Nature Science Foundation of China (No.60970053), by the National High-tech Research and Development Projects (863) grant No.2006AA01Z142, by the State Language Commission of China No.YB125-19 as well as by the International Cooperation of Shanxi Province, Contracts 2010081044. And we would like to thank the organizer for the tremend-ous effort they put into formulating this challeng-ing work.
References
Eneko Agirre, Daniel Cer, Mona Diab, and Aitor Gon-zalez-Agirre. 2012. SemEval-2012 Task 6: A Pilot on Semantic Textual Similarity. In Proceedings of the 6th International Workshop on Semantic Evaluation, in conjunction with the 1st Joint Conference on Lexi-cal and Computational Semantics, 385–393.
Dekang Lin, Patrick Pantel. 2001. Discovery of Infe-rence Rules for Question Answering. Natural Lan-guage Engineering, 7(4):343-360.
Vasileios Hatzivassiloglou, Judith L. Klavans, and Eleazar Eskin. 1999. Detecting Text Similarity over Short Passages: Exploring Linguistic Feature Combi-nations via Machine Learning. In proceedings of the Joint SIGDAT Conference on Empirical Methods in Natural Language Processing and Very Large Cor-pora, 224-231.
Rada Mihalcea, Courtney Corley, and Carlo Strapparava. 2006. Corpus-based and Knowledge-based Measures of Text Semantic Similarity. In Proceedings of the National Conference on Artificial Intelligence, 21(1): 775-780.
Daniel Bär, Chris Biemann, Iryna Gurevych, and Tors-ten Zesch. 2012. UKP: Computing Semantic Textual Similarity by Combining Multiple Content Similarity Measures. In Proceedings of the 6th International Workshop on Semantic Evaluation, in conjunction with the 1st Joint Conference on Lexical and Compu-tational Semantics, 435-440.
Frane Šarić, Goran Glavaš, Mladen Karan, Jan Šnajder, and Bojana Dalbelo Bašić. 2012. TakeLab: Systems for Measuring Semantic Text Similarity. In Proceed-ings of the 6th International Workshop on Semantic Evaluation, in conjunction with the 1st Joint Confe-rence on Lexical and Computational Semantics, 441-448.
G. Salton, A. Wong, C.S. Yang. 1975. A Vector Space Model for Automatic Indexing. Communications of the ACM, 18(11):613-620.
C. J. Fillmore, C. R. Johnson and M. R.L. Petruck. 2003. Background to FrameNet. International Journal of Lexicography, 16: 235-250.
Dipanjan Das and Noah A. Smith. 2012. Graph-Based Lexicon Expansion with Sparsity-Inducing Penalties. In Proceedings of the Conference of the North Amer-ican Chapter of the Association for Computational Linguistics, 677-687.
Dipanjan Das and Noah A. Smith. 2011. Semi-Supervised Frame-Semantic Parsing for Unknown Predicates. In Proceedings of Annual Meeting of the Association for Computational Linguistics, 1435-1444.
Christiane Fellbaum. 1998. WordNet: An Electronic Lexical Database. MIT Press.