Original Article
EGF rs4444903A allele may decrease hepatocellular
carcinoma risk in Chinese individuals: a meta-analysis
Yinyue Zhang1*, Jing Zhang2*, Nan Shen3, Kewei Ren4
1Department of General Surgery, Jiangyin No. 3 People’s Hospital, Jiangyin 214433, P. R. China; 2Department of Electrocardiogram, The Affiliated No. 2 Hospital of Southeast University, Nanjing 210003, P. R. China; 3Department of Clinical Pharmacy, The Affiliated Jiangyin Hospital of Southeast University Medical School, Jiangyin 214400, P. R. China; 4Department of Orthopedics, The Affiliated Jiangyin Hospital of Southeast University Medical School, Jiangyin 214400, P. R. China. *Co-first authors.
Received April 26, 2015; Accepted February 13, 2016; Epub March 15, 2016; Published March 30, 2016
Abstract: The epidermal growth factor (EGF) pathway stimulates the proliferation and differentiation of epidermal and epithelial tissues, and plays an important role in tumorigenesis, including the initiation and development of hepatocellular carcinoma (HCC). Since the association between EGF rs4444903A/G polymorphism and the risk of HCC is still controversial and ambiguous, this meta-analysis aimed to evaluate and confirm this relationship. We conducted a literature search in the PubMed and WanFang databases, covering all papers published by July 10, 2014. Overall, 9 case-control studies comprising 1,874 patients and 2,302 healthy controls were retrieved based on the search criteria for HCC susceptibility related to the rs4444903A/G polymorphism. Odds ratio (OR) and 95% confidence interval (CI) were used to assess the strength of this association. We found that in the overall analy-sis, EGF rs4444903A/G polymorphism decreased HCC risk (A-allele vs. G-allele, OR = 0.93, 95% CI = 0.88-0.98,
Pheterogeneity = 0.118). However, this finding was not observed in Chinese individuals, who carried the A allele (AA+AG vs. GG, OR = 0.93, 95% CI = 0.88-0.99, Pheterogeneity = 0.249). This trend was observed in both hospital-based and population-based subgroups. Our study showed that the A allele of EGF rs4444903 was a poor protective factor of HCC risk in Chinese individuals.
Keywords: Chinese, epidermal growth factor, hepatocellular carcinoma, meta-analysis, polymorphism, risk
Introduction
Hepatocellular carcinoma (HCC) is the fifth most common malignancy worldwide and ac- counts for more than 600,000 deaths annually, more than half of which occur in China [1]. Most patients with HCC have chronic liver disease, especially liver cirrhosis, which is mainly attrib-uted to hepatitis virus infection [2]. In the US and Europe, chronic hepatitis C virus (HCV) infection represents the main risk factor [3], while in Asia and Africa, chronic hepatitis B virus (HBV) infection is the leading risk factor [4]. Only a few patients with HCC are candi-dates for potentially curative treatments of resection, transplantation, and ablation. Be- cause of its poor prognosis, HCC is the third leading cause of cancer-related deaths world-wide [5]. Therefore, identification of biomarkers related to an increased risk of HCC would
indicat-ing its vital role in malignant cell transforma-tion, and tumor initiation and development by promoting cell division via autocrine or para-crine pathways, EGFR gene amplification, and by activating mutations [8, 9]. Further, EGF is a mitogen for the cultured adult and fetal hepato-cytes, and its expression level can be upregu-lated during liver regeneration [10, 11]. It has been reported that transgenic mice with liver-targeted overexpression of the secreted EGF fusion protein develop HCC [12]. Gene expres-sion profiles comparing normal liver tissue with liver tumors in these mice suggest the role of an autocrine mechanism during EGF-induced hepatocarcinogenesis [13].
Shahbazi et al. first reported a functional single nucleotide polymorphism (SNP) involving an A to G mutation at position 61 in the 5’-untrans-lated region of the EGF gene (rs4444903) [14]. They demonstrated that the G allele showed an increased EGF protein expression by affecting DNA folding or mRNA transcription in vitro, and revealed that patients with malignant melano-ma of the skin had a significantly higher fre-quency of G allele compared with the general population. Another recent study showed a relationship between this functional polymor-phism and the risk for development of HCC [15]. In this study consisting of 207 patients, it was observed that the frequencies of GG or (GG+GA) genotypes were associated with the risk for aggressiveness of HCC in liver cirrhosis, through modulation of EGF levels.
Two meta-analyses proved that rs4444903G allele was a risk factor for HCC, while rs44- 44903A allele was a protective factor [16, 17]. However, in these studies, the control group was not completely devoid of patients with hepatitis or liver cirrhosis, which may have increased the publication bias and heterogene-ity. Thereafter, several novel studies were pub-lished; it is necessary to collate the data from all previous related studies to conduct an updated analysis, while considering the influ-ence of the controls. To the best of our knowl-edge, thus far, a total of 9 case-control studies on HCC have been reported.
Materials and methods
Identification and eligibility of relevant studies
We conducted literature searches in the PubMed and Wan Fang databases (last search
updated on July 10, 2014), using keywords such as ‘EGF’ or ‘epidermal growth factor’, ‘polymorphism’ or ‘variant’ and ‘hepatocellular carcinoma’ or ‘liver disease’, without imposing any restriction on the language or year of publi-cation. Using these terms, a total of 15 articles were retrieved, 7 of which adhered to the in- clusion criteria of this study. We also screened the references of the retrieved articles and reviewed them manually.
Inclusion and exclusion criteria
Studies that assessed the correlation between HCC and EGF rs4444903A/G polymorphism, case-control studies, studies that had suffi-cient genotype numbers for patients and con-trols, and those in which the genotype distri- butions of controls were consistent with the Hardy-Weinberg equilibrium (HWE) were includ-ed in our analysis. Studies that had no control population, those with no available genotype frequency, and duplicate publications were ex- cluded from our analysis.
Data extraction
Two investigators independently extracted all data, ensuring compliance with the selection criteria. The following items were collected: first author’s last name, year of publication, country of origin, ethnicity, total no. of patients/con-trols, source of conpatients/con-trols, HWE of conpatients/con-trols, and genotyping method.
Statistical analysis
Odds ratio (OR) and 95% confidence interval (CI) were used to measure the strength of the association between EGF rs4444903A/G poly-morphism and HCC based on the genotype fre-quencies in patients and controls. Initially, sub-group analysis stratified by ethnicity was per-formed. According to the source of controls, the articles were defined as population-based (PB) or hospital-based (HB).
‘low’, those ~50% were considered ‘moderate’ and those > 75% were considered ‘high’ [18]. If P was ≤ 0.05 or I2 was ≥ 50%, a random-effects model using the DerSimonian and Laird meth-od [19], which yields wider confidence intervals, was adopted. Alternatively, if P was > 0.05 or I2 was < 50%, a fixed-effects model using the Mantel-Haenszel method [20] was used.
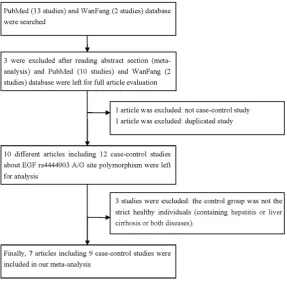
[image:3.629.100.388.81.363.2]A total of 15 published studies assessing the association of EGF rs4444903A/G polymor-phism and HCC were retrieved by searching the PubMed and Wan Fang databases. Through abstract appraisal, 12 articles were identified as eligible for full-text appraisal. Of these, 5 articles (1 duplication, 1 case only study, and 3 without strictly healthy controls [15, 23, 24]) Figure 1. Flowchart illustrating the search strategy for EGF rs4444903A/G
polymorphism and the risk of HCC.
For EGF rs4444903A/G, we investigated the relationsh- ip between genetic variants and HCC risk in allelic con-trast (A-allele vs. G-allele), homozygote comparison (AA vs. GG), heterozygote com-parison (AG vs. GG), domi-nant genetic model (AA+AG vs. GG), and recessive genet-ic model (AA vs. AG+GG). In addition, Begg’s funnel plots and Egger’s regression test were used to assess the pub-lication bias. P < 0.05 in both tests indicated the presence of publication bias [21, 22]. Significant departures of all- ele frequencies of EGF poly-morphism from expectation under HWE were assessed in controls using the Pearson’s chi-square test. P < 0.05 was considered statistically sig-nificant. All statistical tests were performed using Stata software (version 10.0; Sta- taCorp LP, College Station, TX, USA).
Genotyping method
Genotyping for rs4444903- A/G SNP of EGF gene was conducted using polymerase chain reaction-restriction fr- agment length polymorphism (PCR-RFLP) and the TaqMan method.
Results
Study selection and charac-teristics of the meta-analysis Table 1. Characteristics of studies of EGF rs4444903A/G
polymor-phism included in this meta-analysis
First author/
Year Country/Ethnicity ControlCase/ Source of Control GenotypingMethod HWE ofControl
Abbas/2012 Egypt/Caucasian 20/20 HB PCR-RFLP 0.371
Wu/2013 China/Chinese 404/623 HB TaqMan 0.094
Qi/2009 China/Chinese 215/208 HB PCR-RFLP 0.615
Li/2009 China/Chinese 186/186 HB PCR-RFLP 0.564
Chen/2011 China/Chinese 120/120 HB PCR-RFLP 0.971
Wang/2009 China/Chinese 376/477 PB PCR-RFLP 0.335
Wang/2009 China/Chinese 186/198 PB PCR-RFLP 0.550
Yuan/2013 USA/Chinese 250/245 HB TaqMan 0.533
Yuan/2013 USA/Mixed 117/225 PB TaqMan 0.162
[image:3.629.99.387.440.579.2]were excluded. Finally, 7 articles involving 9 case-control studies were finalized, and data from these were extracted for further assess-ment in our meta-analysis (Figure 1). All essen-tial information [25-31] is listed in Table 1. If a study consisted of two or more races as its research subjects, we considered it as mixed population. Two articles [25, 28] that consisted of two groups each were considered as two independent case-control studies. The distribu-tion of genotypes in all controls was in agree-ment with the HWE.
[image:4.629.96.529.94.469.2]Quantitative data synthesis and test of hetero -geneity
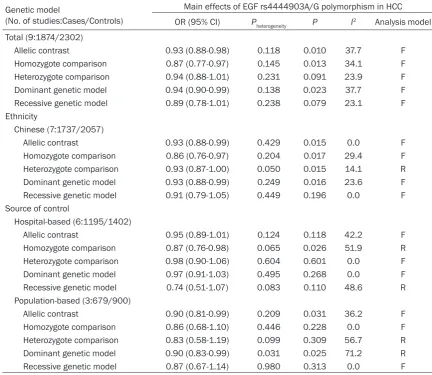
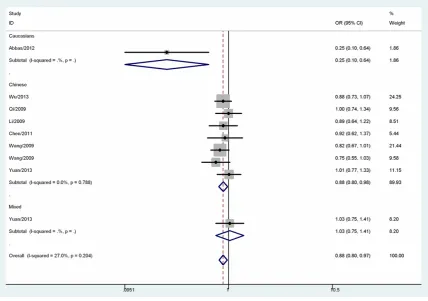
Table 2 shows the summary OR of EGF rs4444903A/G based on 1,874 HCC patients and 2,302 healthy controls. We observed a decreased association between the EGF rs- 4444903A/G polymorphism and HCC in the
total population (AA vs. GG, OR = 0.76, 95% CI = 0.61-0.94, Pheterogeneity = 0.540, P = 0.013, I2 = 0.0; AA+AG vs. GG, OR = 0.94, 95% CI = 0.90-0.99, Pheterogeneity = 0.138, P = 0.023, I2 = 37.7; A-allele vs. G-allele, OR = 0.88, 95% CI = 0.80-0.97, Pheterogeneity = 0.204, P = 0.010, I2 = 27.0, Figure 2). Given the ethnic differences in the allele frequency of this sequence variant, we evaluated the effect of EGF rs4444903A/G polymorphism in Chinese, European, and Mixed population. The association of rs4444903A/G polymorphism with decreased HCC risk in Chinese population was observed under homo-zygote comparison (OR = 0.75, 95% CI = 0.60-0.95, Pheterogeneity = 0.956, P = 0.017, I2 = 0.0), heterozygote comparison (OR = 0.93, 95% CI = 0.87-1.00, Pheterogeneity = 0.050, P = 0.015, I2 = 14.1), dominant genetic model (OR = 0.93, 95% CI = 0.88-0.99, Pheterogeneity = 0.249, P = 0.016, I2 = 23.6), and allelic contrast (OR = 0.88, 95% CI = 0.80-0.98, P = 0.788, P Table 2. Stratified analyses of the EGF rs4444903A/G polymorphism on HCC risk
Genetic model
(No. of studies:Cases/Controls)
Main effects of EGF rs4444903A/G polymorphism in HCC
OR (95% CI) Pheterogeneity P I2 Analysis model
Total (9:1874/2302)
Allelic contrast 0.93 (0.88-0.98) 0.118 0.010 37.7 F
Homozygote comparison 0.87 (0.77-0.97) 0.145 0.013 34.1 F
Heterozygote comparison 0.94 (0.88-1.01) 0.231 0.091 23.9 F
Dominant genetic model 0.94 (0.90-0.99) 0.138 0.023 37.7 F
Recessive genetic model 0.89 (0.78-1.01) 0.238 0.079 23.1 F
Ethnicity
Chinese (7:1737/2057)
Allelic contrast 0.93 (0.88-0.99) 0.429 0.015 0.0 F
Homozygote comparison 0.86 (0.76-0.97) 0.204 0.017 29.4 F
Heterozygote comparison 0.93 (0.87-1.00) 0.050 0.015 14.1 R
Dominant genetic model 0.93 (0.88-0.99) 0.249 0.016 23.6 F
Recessive genetic model 0.91 (0.79-1.05) 0.449 0.196 0.0 F
Source of control
Hospital-based (6:1195/1402)
Allelic contrast 0.95 (0.89-1.01) 0.124 0.118 42.2 F
Homozygote comparison 0.87 (0.76-0.98) 0.065 0.026 51.9 R
Heterozygote comparison 0.98 (0.90-1.06) 0.604 0.601 0.0 F
Dominant genetic model 0.97 (0.91-1.03) 0.495 0.268 0.0 F
Recessive genetic model 0.74 (0.51-1.07) 0.083 0.110 48.6 R
Population-based (3:679/900)
Allelic contrast 0.90 (0.81-0.99) 0.209 0.031 36.2 F
Homozygote comparison 0.86 (0.68-1.10) 0.446 0.228 0.0 F
Heterozygote comparison 0.83 (0.58-1.19) 0.099 0.309 56.7 R
Dominant genetic model 0.90 (0.83-0.99) 0.031 0.025 71.2 R
= 0.015, I2 = 0.0, Figure 2). Summary OR for rs4444903A/G polymorphism stratified by source of control was evaluated. We also observed decreased association in homozy-gote comparison (OR = 0.87, 95% CI = 0.76-0.98, Pheterogeneity = 0.065, P = 0.026, I2 = 51.9) in HB studies, while significant relationships in allelic contrast (OR = 0.90, 95% CI = 0.81-0.99, Pheterogeneity = 0.209, P = 0.031, I2 = 36.2) and dominant genetic model (OR = 0.90, 95% CI = 0.83-0.99, Pheterogeneity = 0.031, P = 0.025, I2 = 71.2) were found in PB studies.
Sensitivity analysis and publication bias
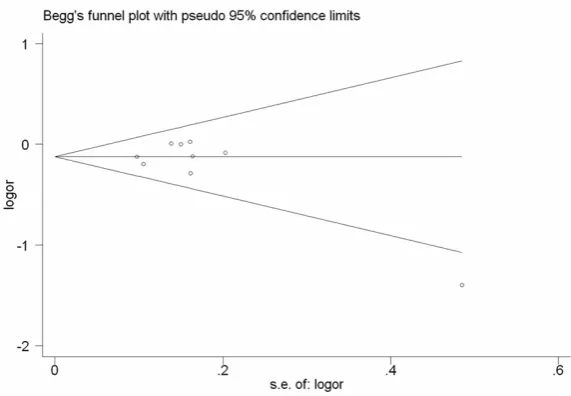
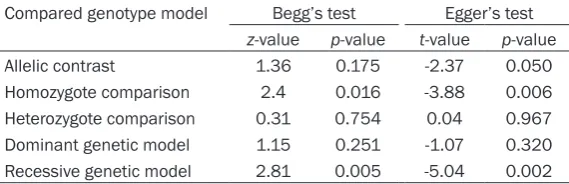
No other single study influenced the summary OR qualitatively, as indicated by the sensitivity analysis (Figure 3). Begg’s funnel plot and Egger’s test were performed to assess the pub-lication bias of the literatures. The shape of the funnel plots seemed asymmetrical in allele comparison for EGF rs4444903A/G polymor-phism, suggesting no publication bias (e.g., z = -0.83, P = 0.404 for allelic contrast, Figure 4).
Subsequently, Egger’s test was used to provide statistical evidence of funnel plot symmetry. However, no evidence of publication bias was detected (e.g., t = -1.44, P = 0.196 for allelic contrast, Figure 5; Table 3).
Discussion
[image:5.629.101.530.81.382.2]ple human malignancies [35-37]. Several stud-ies have attempted to elucidate the mechanism underlying HCC and EGF/EGFR signal pathway. For example, Yoneda et al. [38] reported that the activation of EGF/EGFR signaling pathway via phosphorylation of JNK/SAPK may be close-ly associated with the histogenesis of CK19-positive HCC. EGF increased the proliferative abilities and invasive properties of HCC cell lines, showing an acquisition of more malignant potential and accounting for the poor prognosis of the HCC patients. Reschke et al. [39]
sug-previous related publications to evaluate the relationship between EGF rs4444903A/G poly-morphism and HCC risk. In the overall analysis, decreased association was observed between rs4444903A allele and HCC risk in three genet-ic models. The main finding of our meta-an- alysis is that the association between EGF rs4444903A/G polymorphism and HCC risk is modified by ethnicity; EGF rs4444903A alle- le represents a protective factor for HCC in Chinese individuals. We also found an asso- ciation between EGF rs4444903A/G polymor-Figure 3. Sensitivity analysis between EGF rs4444903A/G polymorphism
[image:6.629.99.383.82.271.2]and HCC risk.
Figure 4. Begg’s funnel plot for publication bias test (G-allele vs. A-allele). Each point represents a separate study for the indicated association. Log [OR], natural logarithm of OR. Horizontal line, mean effect size.
gested that mitogen-induc-ible gene-6 (mig-6) is a sup-pressor of hepatocarcinogen-esis, and the loss of mig-6 in primary human liver tumors might be sufficient to gener-ate increased EGFR signaling, which may lead to the initia-tion and progression of HCC. Some studies have reported conflicting findings on the association of EGF rs444- 4903A/G polymorphism with the risk and prognosis of HCC. Tanabe et al. [15] first studied the role of this SNP in a subtype of HCC, suggesting that the number of copies of G was significantly associat-ed with HCC and the severity of cirrhosis (GG+GA vs. AA, hazard ratio = 3.29; 95% CI = 1.29-9.44). Li et al. [30] also found an association between the +61GG genotype and an increased chronic HBV infec-tion-related HCC risk (OR = 2.78, 95% CI = 1.11-6.91). However, in a recent study, Qi et al. [31] demonstrated that there were no significant dif-ferences in EGF rs444490- 3A/G genotype or allelic fre-quencies or in the tumor st- age and invasiveness betw- een HCC patients and healthy controls.
[image:6.629.99.385.323.521.2]phism and HCC risk in both HB and PB studies.
Meta-analysis has been recognized as an effec-tive method to solve a wide variety of clinical questions by summarizing and reviewing previ-ously published quantitative research; howev-er, our meta-analysis had some limitations. First, the number of published studies included in our meta-analysis was not sufficiently large for a comprehensive analysis, and one study [26] with a small sample size may not have suf-ficient statistical power to explore the real asso-ciation. Second, the gene-gene, gene-environ-ment interactions, and even interactions am- ong different polymorphic loci of the same gene may modulate HCC risk. Third, our meta-analy-sis was based on unadjusted estimates; a more precise analysis should be conducted if indi-vidual data are available, which would allow for adjustment by other covariates including age, sex, family history, environmental factors, can-cer stage, and lifestyle.
rs4444903A/G polymorphism and develop-ment of risk for HCC.
Disclosure of conflict of interest
None.
Address correspondence to: Dr. Kewei Ren, De- partment of Orthopedics, The Affiliated Jiangyin Hospital of Southeast University Medical School, 163 Shoushan Road, Jiangyin 214400, China. Tel: +86-510-86976091; E-mail: renkewei2015@sina. com
References
[1] Bosch FX, Ribes J, Díaz M, Cléries R. Primary liver cancer: worldwide incidence and trends. Gastroenterology 2004; 127: S5-S16.
[2] Coleman WB. Mechanisms of human hepato-carcinogenesis. Curr Mol Med 2003; 3: 573-588.
[image:7.629.98.384.79.277.2][3] Tanaka Y, Hanada K, Mizokami M, Yeo AE, Shih JW, Gojobori T, Alter HJ. A comparison of the Figure 5. Egger’s publication bias plot (G-allele vs. A-allele).
Table 3. Publication bias tests (Begg’s test and Egger’s test) for EGF rs4444903A/G polymorphism
Compared genotype model Begg’s test Egger’s test
z-value p-value t-value p-value
Allelic contrast 1.36 0.175 -2.37 0.050
Homozygote comparison 2.4 0.016 -3.88 0.006
Heterozygote comparison 0.31 0.754 0.04 0.967
Dominant genetic model 1.15 0.251 -1.07 0.320
Recessive genetic model 2.81 0.005 -5.04 0.002
Our meta-analysis also had some advantages. First, a substantial number of pa- tients and controls were po- oled from different studies, which significantly increased the statistical power of the analysis. Second, the quality of case-control studies in- cluded in the current meta-analysis satisfied our selec-tion criteria. Third, the includ-ed control subjects were all healthy individuals, suggest-ing that the results may be reliable.
[image:7.629.99.384.343.435.2]molecular clock of hepatitis C virus in the United States and Japan predicts that hepato-cellular carcinoma incidence in the United States will increase over the next two decades. Proc Natl Acad Sci U S A 2002; 99: 15584-15589.
[4] Srivatanakul P, Sriplung H, Deerasamee S. Epidemiology of liver cancer: an overview. Asian Pac J Cancer Prev 2004; 5: 118-125. [5] Parkin DM, Bray F, Ferlay J, Pisani P. Global
cancer statistics, 2002. CA Cancer J Clin 2005; 55: 74-108.
[6] Ponder BA. Cancer genetics. Nature 2001; 411: 336-341.
[7] Normanno N, De Luca A, Bianco C, Strizzi L, Mancino M, Maiello MR, Carotenuto A, De Feo G, Caponigro F, Salomon DS. Epidermal grow- th factor receptor (EGFR) signaling in cancer. Gene 2006; 366: 2-16.
[8] Jorissen RN, Walker F, Pouliot N, Garrett TP, Ward CW, Burgess AW. Epidermal growth fac-tor recepfac-tor: mechanisms of activation and signaling. Exp Cell Res 2003; 284: 31-53. [9] Limaye PB, Bowen WC, Orr AV, Luo J, Tseng GC,
Michalopoulos GK. Mechanisms of hepatocyte growth factor-mediated and epidermal growth factor-mediated signaling in transdifferentia-tion of rat hepatocytes to biliary epithelium. Hepatology 2008; 47: 1702-1713.
[10] Blanc P, Etienne H, Daujat M, Fabre I, Zindy F, Domergue J, Astre C, Saint Aubert B, Michel H, Maurel P. Mitotic responsiveness of cultured adult human hepatocytes to epidermal growth factor, transforming growth factor alpha, and human serum. Gastroenterology 1992; 102: 1340-1350.
[11] Mullhaupt B, Feren A, Fodor E, Jones A. Liver expression of epidermal growth factor RNA. Rapid increases in immediate-early phase of liver regeneration. J Biol Chem 1994; 269: 19667-19670.
[12] Tönjes RR, Löhler J, O’Sullivan JF, Kay GF, Schmidt GH, Dalemans W, Pavirani A, Paul D. Autocrine mitogen IgEGF cooperates with c-myc or with the Hcs locus during hepatocar-cinogenesis in transgenic mice. Oncogene 1995; 10: 765-768.
[13] Borlak J, Meier T, Halter R, Spanel R, Spanel-Borowski K. Epidermal growth factor-induced hepatocellular carcinoma: gene expression profiles in precursor lesions, early stage and solitary tumours. Oncogene 2005; 24: 1809-1819.
[14] Shahbazi M, Pravica V, Nasreen N, Fakhoury H, Fryer AA, Strange RC, Hutchinson PE, Osborne JE, Lear JT, Smith AG, Hutchinson IV. Asso- ciation between functional polymorphism in EGF gene and malignant melanoma. Lancet 2002; 359: 397-401.
[15] Tanabe KK, Lemoine A, Finkelstein DM, Kawasaki H, Fujii T, Chung RT, Lauwers GY, Kulu Y, Muzikansky A, Kuruppu D, Lanuti M, Goodwin JM, Azoulay D, Fuchs BC. Epidermal growth factor gene functional polymorphism and the risk of hepatocellular carcinoma in pa-tients with cirrhosis. JAMA 2008; 299: 53-60. [16] Yang Z, Wu Q, Shi Y, Nie Y, Wu K, Fan D.
Epidermal growth factor 61A>G polymorphi- sm is associated with risk of hepatocellular carcinoma: a meta-analysis. Genet Test Mol Biomarkers 2012; 16: 1086-1091.
[17] Zhong JH, You XM, Gong WF, Ma L, Zhang Y, Mo QG, Wu LC, Xiao J, Li LQ. Epidermal growth fac-tor gene polymorphism and risk of hepatocel-lular carcinoma: a meta-analysis. PLoS One 2012; 7: e32159.
[18] Higgins JP, Thompson SG, Deeks JJ, Altman DG. Measuring inconsistency in meta-analy-ses. BMJ 2003; 327: 557-560.
[19] Mantel N, Haenszel W. Statistical aspects of the analysis of data from retrospective studies of disease. J Natl Cancer Inst 1959; 22: 719-748.
[20] DerSimonian R, Laird N. Meta-analysis in clini-cal trials. Control Clin Trials 1986; 7: 177-88. [21] Egger M, Davey Smith G, Schneider M, Minder
C. Bias in meta-analysis detected by a simple, graphical test. BMJ 1997; 315: 629-634. [22] Begg CB, Mazumdar M. Operating
characteris-tics of a rank correlation test for publication bias. Biometrics 1994; 50: 1088-1101. [23] Abu Dayyeh BK, Yang M, Fuchs BC, Karl DL,
Yamada S, Sninsky JJ, O’Brien TR, Dienstag JL, Tanabe KK, Chung RT; HALT-C Trial Group. A functional polymorphism in the epidermal growth factor gene is associated with risk for hepatocellular carcinoma. Gastroenterology 2011; 141: 141-149.
[24] Suenaga M, Yamada S, Fujii T, Fuchs BC, Okumura N, Kanda M, Kobayashi D, Tanaka C, Nakayama G, Sugimoto H, Koike M, Nomoto S, Fujiwara M, Takeda S, Hayashi K, Tanabe KK, Goto H, Kodera Y. A functional polymorphism in the epidermal growth factor gene predicts hepatocellular carcinoma risk in Japanese hepatitis C patients. Onco Targets Ther 2013; 6: 1805-1812.
[25] Yuan JM, Fan Y, Ognjanovic S, Wang R, Van Den Berg D, Govindarajan S, Yu MC. Genetic polymorphisms of epidermal growth factor in relation to risk of hepatocellular carcinoma: two case-control studies. BMC Gastroenterol 2013; 13: 32.
carcinoma: a pilot study. Eur J Gastroenterol Hepatol 2012; 24: 458-463.
[27] Wu J, Zhang W, Xu A, Zhang L, Yan T, Li Z, Wu X, Zhu X, Ma J, Li K, Li H, Liu Y. Association of epidermal growth factor and epidermal growth factor receptor polymorphisms with the risk of hepatitis B virus-related hepatocellular carci-noma in the population of North China. Genet Test Mol Biomarkers 2013; 17: 595-600. [28] Wang HX, Xie WM, Zhou GQ. Epidermal grow-
th factor gene polymorphism associated wi- th susceptibility to hepatocellular carcinoma. Guangxi Medical University Master Dissertation 2009.
[29] Chen K, Wei Y, Yang H, Li B. Epidermal growth factor +61 G/A polymorphism and the risk of hepatocellular carcinoma in a Chinese popula-tion. Genet Test Mol Biomarkers 2011; 15: 251-255.
[30] Li Y, Xie Q, Lu F, Zhao J, Mao P, Li Z, Liu S, Zhuang H. Association between epidermal growth factor 61A/G polymorphism and hepa-tocellular carcinoma susceptibility in Chinese patients. Liver Int 2010; 30: 112-118. [31] Qi P, Wang H, Chen YM, Sun XJ, Liu Y, Gao CF.
No association of EGF 5’UTR variant A61G and hepatocellular carcinoma in Chinese pa-tients with chronic hepatitis B virus infection. Pathology 2009; 41: 555-560.
[32] Llovet JM, Bruix J. Molecular targeted thera-pies in hepatocellular carcinoma. Hepatology 2008; 48: 1312-1327.
[33] Morimitsu Y, Hsia CC, Kojiro M, Tabor E. Nodules of less-differentiated tumor within or adjacent to hepatocellular carcinoma: relative expression of transforming growth factor-alpha and its receptor in the different areas of tumor. Hum Pathol 1995; 26: 1126-1132.
[34] Kömüves LG, Feren A, Jones AL, Fodor E. Expression of epidermal growth factor and its receptor in cirrhotic liver disease. J Histochem Cytochem 2000; 48: 821-830.
[35] Almeida LO, Custódio AC, Santos MJ, Almeida JR, Clara CA, Pinto GR, Rey JA, Casartelli C. The A61G EGF polymorphism is associated with de-velopment of extraaxial nervous system tu-mors but not with overall survival. Cancer Genet Cytogenet 2010; 198: 15-21.
[36] Lanuti M, Liu G, Goodwin JM, Zhai R, Fuchs BC, Asomaning K, Su L, Nishioka NS, Tanabe KK, Christiani DC. A functional epidermal growth factor (EGF) polymorphism, EGF serum levels, and esophageal adenocarcinoma risk and out-come. Clin Cancer Res 2008; 14: 3216-3222. [37] Araújo AP, Costa BM, Pinto-Correia AL, Fragoso
M, Ferreira P, Dinis-Ribeiro M, Costa S, Reis RM, Medeiros R. Association between EGF+ 61A/G polymorphism and gastric cancer in Caucasians. World J Gastroenterol 2011; 17: 488-492.
[38] Yoneda N, Sato Y, Kitao A, Ikeda H, Sawada-Kitamura S, Miyakoshi M, Harada K, Sasaki M, Matsui O, Nakanuma Y. Epidermal growth fac-tor induces cytokeratin 19 expression accom-panied by increased growth abilities in human hepatocellular carcinoma. Lab Invest 2011; 91: 262-272.