Proceedings of the Thirteenth Workshop on Innovative Use of NLP for Building Educational Applications, pages 206–211
Grotoco@SLAM: Second Language Acquisition Modeling with Simple
Features, Learners and Task-wise Models
Sigrid Klerke♣ H´ector Mart´ınez Alonso♠ Barbara Plank♥♣ ♥Center for Language and Cognition, University ofGroningen, The Netherlands
♠Thomson Reuters Labs,Toronto, Canada ♣IT University of Copenhagen,Copenhagen, Denmark
[email protected],[email protected],[email protected]
Abstract
We present our submission to the 2018 Duolingo Shared Task on Second Language Acquisition Modeling (SLAM). We focus on evaluating a range of features for the task, in-cluding user-derived measures, while examin-ing how far we can get with a simple linear classifier. Our analysis reveals that errors dif-fer per exercise format, which motivates our final and best-performing system: a task-wise (per exercise-format) model.
1 Introduction
The shared task on Second Language Acquisi-tion Modeling (SLAM) (Settles et al.,2018) con-sisted of an error prediction task, i.e., determining whether a language learner (user) made a token-level mistake.1 Exploring if and how errors can be predicted can provide insights into the learning process and help pinpoint specific constructs that challenge learners of different languages.
The design of each exercise and the time spent on a particular task and language course, which can be expected to influence the performance, are included in the data. The learning context and the learners’ background language skills, which would also influence performance, are not known or controlled for. In general, the courses are structured to minimize errors, by providing fre-quent repetition and only incrementing the diffi-culty level by small steps. Taken together, this makes the error prediction task a potentially hard task due to a sparse target class and noisy data from the unknown variable of user profiles, be-sides the temporal dependency.
With data from three language courses, namely English, Spanish and French, it is possible to ex-plore generic and course-specific aspects of the learning problem.
1Note: we have only access to an error’s corrected form.
2 Our Approach
With a focus on identifying meaningful feature groups, we use the provided train and development data to train and tune a logistic regression classi-fier for each language track. We explore features that describe static aspects of the exercise text, fea-tures that take the source and target language into account and features that describe the user-specific course trajectory. Due to notable biases in the data, we also experimented training separate classifiers on various data splits, namely for the three distinct exercise formats (listen, reverse tap, reverse trans-late) and for different days of the course.
Below, we briefly describe the data before de-tailing each group of features and proceeding to describe the model and results.
2.1 Data
The data splits contain all the same users, and are structured sequentially in time, over a period of 30 learner’s days. Roughly the first 80% are given as training data, the next 10% are development data and the last 10% were the held-out test data.
The dataset contains two time variables:
• days This is a user-relative “timestamp” (the number of days they have been using Duolingo to learn this language). Monotoni-cally increasing, by user.
• time The number of seconds it took the user to construct their response for the current ex-ercise (aka“response time”). Note that this is a measures for the entire response, not for any particular word/token. Some ‘null’ values are in the dataset due to logging issues.
The data further contains meta-data on the user and the exercise type, besides automatically de-rived POS tags and dependency trees:
COURSE USERS TOKENS ERRORS
en-es 2,593 2,622,958 12%
– Listen – – 16%
– Rev. Tap – – 4%
– Rev. Transl. – – 14%
es-en 2,643 1,973,558 16%
– Listen – – 22%
– Rev. Tap – – 8%
– Rev. Transl. – – 21%
fr-en 1,213 926,657 15%
– Listen – – 16%
– Rev. Tap – – 6%
[image:2.595.308.526.64.216.2]– Rev. Transl. – – 23%
Table 1: Training set sizes and error rates.
• format The task to be solved by the user. One of listen, reverse tap and translate.
• user a B64 encoded, 8-digit, anonymized, unique identifier for each user
• countrycountry codes from which this user has done exercises
• client- the student’s device platform (one of: android, ios, or web)
• session - the session type (one of: lesson, practice, or test; explanation below)
There were three tracks for learners of English, Spanish, and French. In particular, en-es con-sists of English learners (who already speak Span-ish), es-en are Spanish learners (who already speak English), and fr-en are French learners (who already speak English). We participated in all three. An overview of the data for the three tracks, including number of users, tokens and av-erage error rate is given in Table1.
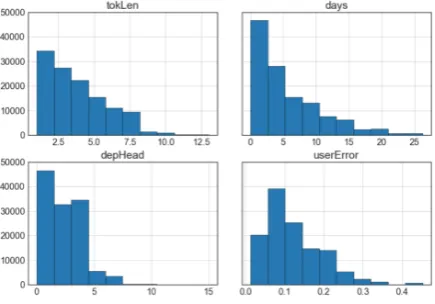
The distribution of four attributes of the text and the users are shown in Figure1. The low values dominating both the token length distribution and the dependency head index distribution reflect a preference for simple sentences. The distribution of the days since course start reveals how user ac-tivity declines steeply. The users’ individual error distributions reflects the proficiency spread.
2.2 Features
We have mostly limited ourselves to features that could be calculated from the shared task data.
Figure 1: Distribution of token lengths, index of depen-dency heads, days since course start and users’ individ-ual proportion of errors. Based on first 200K tokens of theen-es-track.
Each data instance in our dataset describes a word and its context. For performance reasons, we ap-ply binning to all features, given that many of them are real-valued.
1. User,sessionandclient: Non-linguistic data, but also potential sources of error.
2. Task format: Whether a given data point belongs to thelisten, reverse tap orreverse translatetask format. Each task has a differ-ent error prior (Table1).
3. Word properties (base): Basic word prop-erties, i.e., the word form and its stem. We use the NLTK Snowball stemmers (Loper and Bird, 2002) for the three languages at hand. We add the word’s log frequency cal-culated from Universal Dependencies (UD) 2.1 (Nivre et al.,2016).
5. Diacritics: Whether the word contains any non-ASCII characters. We observed that French and Spanish words with accents were hard to type by English speakers, which mo-tivated this feature.
6. Cognates and Character similarity (Form): Whether the target token exists in the source language. We calculate this feature once for forms and one for stems. We obtain our word lists for each language from the respective UD data. Moreover, letter sequences that are different across languages can be a cause of errors for second language learners. We model this difference by calculating the Kullback-Leibler divergence for the 2-3 grams character distributions of the word (and the previous token) in the source with respect to the target language. We also use a measure of character overlap with tokens in the source language.
7. Time properties: The time the exercise was taken since the course start, binned by whole days and by equal log-distance, also cumula-tively. The log time taken for the exercise re-sponse total and per token, both absolute and cumulative.
8. User behavior: We calculate user-dependent characteristics based on the whole training dataset. For a certain word, we calculate whether the user has seen it before, how many times, how many days ago, whether it was an error last, the user’s token-error rate, and the days since the last error. When avail-able, we calculate the features’ cumulative variant.
9. Country: the list of countries in which the user did exercises. Also, whether the coun-try the user is in has the target language as one of its official languages, motivated by the intuition that exposure decreases error rate.
2.3 Model
[image:3.595.312.521.63.221.2]We use Scikit-learn (Pedregosa et al., 2011) and for computational reasons, we have limited our-selves mostly to single linear classifiers instead of ensemble, kernel or neural methods. Our final sys-tem is a logistic regression classifier withL2 reg-ularization,C = 0.2, balanced class-weights and
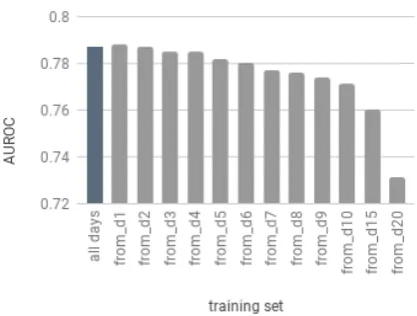
Figure 2: Results for training a single model on all data versus data from later days onwards (fr-endev set).
liblinear as solver. Our code is publicly available.2 We also approach each track separately, thus have trained three separate models per language pair, we however believe that creating one joint model is an interesting research direction. More-over, rather than using format as a feature in one single model, we observed that the error rate prior was strongly determined with the task format, and thus we considered using separate format-wise models, namely by dividing the data by task for-mat, i.e., there is a separate model for English-to-Spanish-Listen, and so on, trained on the task-specific subset of data. At prediction time, the corresponding classifier is applied to each test in-stance.
3 Results
3.1 Results on dev set
During development, we observed that removing the first day of every user’s data was helpful. We claim that first-day errors have more to do with the learning curve of the software, and less with the language itself. Figure 2 illustrates this for one language pair. Removing training instances before day 1 slightly increases performance for all languages. The diminishing data curve shows a pretty flat performance when excluding earlier learner days up to day 4.
3.2 Results on test set
Given the remark that the first day contained more irregular errors, we exclude the first day from the training data, and add the dev section, to train our final classifier.
EN-ES ES-EN FR-EN
r team AUC F1 L r team AUC F1 L r team AUC F1 L 1 SanaLabs 0.86 0.56 0.30 1 SanaLabs 0.84 0.53 0.33 1 SanaLabs 0.86 0.57 0.33 9 Lambda 0.82 0.39 0.32 8 Lambda 0.80 0.34 0.35 8 Lambda 0.82 0.41 0.36 10 Grotoco 0.82 0.46 0.53 9 Grotoco 0.79 0.45 0.54 9 Grotoco 0.81 0.50 0.51 11 jilljenn 0.82 0.33 0.33 10 nihalnayak 0.79 0.34 0.36 10 nihalnayak 0.81 0.43 0.37 15 BL 0.77 0.19 0.36 14 BL 0.75 0.18 0.39 15 BL 0.77 0.28 0.40
Table 2: Results on test set. Rank (r), team name, F1, loss (L) for the three language pairs. The table shows the best system (ranked 1), the baseline provided by the organizers (BL), and finally our system with the scores of the immediate higher and lower in ranking for comparison.
We submitted a single system per track, and a task-wise model. The single system, which used all of the features, achieved on average 0.7754 AUROC across the three tasks, while our task-wise model resulted in a considerably better model, reaching 0.79079 AUROC. This supports the hypothesis that errors (and features) are task-specific. Overall, as summarized in Table2, our final task-wise submission ranked 10 (or 9th) in each of the tracks, which is well above the the SLAM baseline, but also shows that much remains to be done (e.g., integrating forgetting, building a single model for all languages, or integrating dense feature representations).
While we did not further evaluate training more specific task-wise models (with different features), we provide a feature analysis in the next section that could help improve the current model.
3.3 Feature analysis
Figure 3 shows examples of features that differ in prevalence in each class split by task format, both for the gold and predicted labels. Comparing column-wise allows us to compare the feature dis-tribution across languages while row-wise com-parison allows us to inspect how similar the pre-dicted and gold label distributions are.
The depicted values are calculated by first de-termining the feature prevalence as the percentage of data points in each class, where a given fea-ture is ‘on’ and subtract the prevalence in one class from the other. Only features with a difference in prevalence of at least 5 percentage points and at least 20% prevalence in at least one subgroup are shown (i.e., the feature is active in a fifth or more of at least one language/task-format/class combi-nation)3. In feature groups where several subse-quent bins fit these criteria, only the most skewed bins were included for the purpose of illustration.
3This favors features that are active in the smaller positive class, in particular in the easier reverse-tap task.
First we note that prevalence of features is dif-ferent for the three tasks. For instance, client in-formation as well as time binned features differ per exercise format (listen, reverse tap and reverse translate). Overall, one notable pattern is that the predictions all match the gold splits distribution in shape (row-wise comparison), but tend to split the selected feature values more radically than the gold. A clear example is the two leftmost client-features with more extreme values in the left col-umn of figures (predicted) than the right (gold).
A second notable pattern is that the feature dis-tribution in the gold data (right-hand column) has strong similarities across the three language pairs, which is also reflected by the model output (left-hand column). This indicates that training a sin-gle joint model across languages could be fruitful, which we did not consider due to time reasons.
en-es es-en fr-en
all features .8158 .7889 .8121
-user .7637 .7637 .7923
-user-session-client .7903 .7614 .7895
-base .8014 .7743 .8000
-pos .8158 .7889 .8121
-dep .8151 .7886 .8112
-form .8147 .7881 .8113
-time .8108 .7889 .8077
-uvocab .8097 .7829 .8053
-country .8157 .7890 .8121
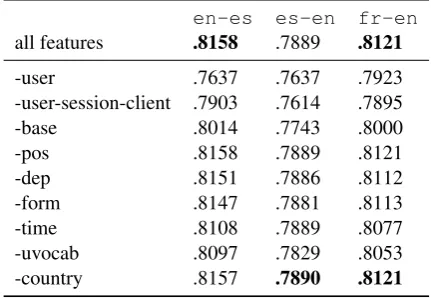
Table 3: Feature ablation (AUROC) for task-wise model (trained on all train data), results on dev sets.
4 Feature ablation and discussion
[image:4.595.308.524.458.607.2]al-Figure 3: Difference in distribution of feature values in predictions (left-hand side) and in gold labels (right-hand side) by course and task-format based on first 100.000 tokens of development data. Y-axis denotes percentage points over-representation in the classes is-error (positive) or is-correct (negative).
ready found in our earlier analysis. The feature with the least impact is the country information. In fact, removing this feature does not drop per-formance, rather, improves it by a tiny bit for the Spanish learners. From the morpho-syntactic fea-tures we found the POS n-grams and dependency relations are the most helpful.
One key trait of our results is the much higher loss when compared with the systems immediate before and after in the ranking. We attribute this much higher loss to having split the data across task formats, which gives sharped distributions in-stead of smoother ones. This argument is sup-ported by a higher F1 than that of the surrounding submissions, which indicates that our system is a better 0–1 labeler than a probability estimator.
5 Conclusions
This paper describes the Grotoco contribution to the Second Language Acquisition Modeling shared task. We have presented our architecture, based on format-wise classification models, and lexical features, as well as user- and time-related features. Training separate models per task turned out to be highly beneficial. We found user-specific and time-related features to be the most informa-tive, beside lexical features and session meta-data. We also found that the first experience with the software to be a possible interference, as remov-ing first-day day improved models consistently.
References
[image:5.595.72.525.62.448.2]Joakim Nivre, Marie-Catherine de Marneffe, Filip Gin-ter, Yoav Goldberg, Jan Hajic, Christopher D. Man-ning, Ryan McDonald, Slav Petrov, Sampo Pyysalo, Natalia Silveira, Reut Tsarfaty, and Daniel Zeman. 2016. Universal dependencies v1: A multilingual treebank collection. InProceedings of the Tenth In-ternational Conference on Language Resources and Evaluation (LREC 2016), Paris, France. European Language Resources Association (ELRA).
F. Pedregosa, G. Varoquaux, A. Gramfort, V. Michel, B. Thirion, O. Grisel, M. Blondel, P. Pretten-hofer, R. Weiss, V. Dubourg, J. Vanderplas, A. Pas-sos, D. Cournapeau, M. Brucher, M. Perrot, and E. Duchesnay. 2011. Scikit-learn: Machine learning in Python. Journal of Machine Learning Research, 12:2825–2830.