Annotating Picture Description Task Responses for Content Analysis
Levi King Indiana University [email protected]
Markus Dickinson Indiana University [email protected]
Abstract
Given that all users of a language can be creative in their language usage, the overar-ching goal of this work is to investigate is-sues of variability and acceptability in writ-ten text, for both non-native speakers (NNSs) and native speakers (NSs). We control for meaning by collecting a dataset of picture de-scription task (PDT) responses from a number of NSs and NNSs, and we define and anno-tate a handful of features pertaining to form and meaning, to capture the multi-dimensional ways in which responses can vary and can be acceptable. By examining the decisions made in this corpus development, we high-light the questions facing anyone working with learner language properties like variability, ac-ceptability and native-likeness. We find re-liable inter-annotator agreement, though dis-agreements point to difficult areas for estab-lishing a link between form and meaning.
1 Introduction
The (written) data of second language learners poses many challenges, whether it is being an-alyzed for grammatical errors (Leacock et al.,
2014), for linguistic patterns (Kyle and Cross-ley,2015), for content analysis (Weigle,2013), or for interactions with intelligent computer-assisted language learning (ICALL) systems (Amaral and Meurers,2007). One of the core issues in doing anything with learner data is the inherent amount of variability in how linguistic forms are used to convey meaning (cf., e.g.,Meurers and Dickinson,
2017). It may indeed seem like learners can use an infinite variety of forms to express a particular meaning; here we attempt to investigate how large the problem of variability in one particular testing context is for computational processing.
To investigate variability and the mappings be-tween linguistic form and meaning, in this paper
we control for meaning by collecting a dataset of picture description task (PDT) responses from a number of NSs and NNSs, and we annotate a handful of features, thereby capturing the multi-faceted ways in which responses can vary and can be acceptable or unacceptable. We call this the SAILS Corpus, for Semantic Analysis of Image-based Learner Sentences—our intended use. By examining the decisions made in this corpus de-velopment, we highlight the questions facing any-one working with learner language properties such as variability, acceptability and native-likeness.
Given the form-meaning aspect of variability, we are interested in how variable linguistic be-havior is for the same content, both within and between NS and NNS groups, and the potential use of NS responses to evaluate NNS responses. There is a long-standing notion that systems pro-cessing learner data would be wise to constrain the data in some way (e.g., Heift and Schulze,
2007;Somasundaran et al., 2015), but we do not know how much constraint is needed—or whether we sacrifice the possibility of observing particu-lar learner behavior for the sake of a constraint— without knowing more about the ways in which variation happens (cf.Bailey and Meurers,2008). The corpus presented here bears some similar-ities to other task-based learner corpora. Meurers et al.(2011) examined German learner responses to short-answer reading comprehension questions. A target answer was produced by an expert, and annotators used this target to label the meaning of responses as correct or incorrect, along with a more detailed set of labels related to form, mean-ing, and task appropriateness. In our own previ-ous work (King and Dickinson,2016, 2013), we annotated a small set of PDT responses as correct or incorrect, with incorrect responses further la-beled as errors of form or meaning.Somasundaran and Chodorow(2014) presented work on PDT
sponses in which respondents used provided vo-cabulary words. Responses were manually anno-tated on a holistic four point scale, and a set of five features (relating to meaning, relevance and language use) were calculated based on statisti-cal assumptions. Somasundaran et al.(2015) per-formed a nearly identical analysis with transcribed texts from a six-picture narration task, but neither of these datasets is publicly available.
Our work reverses this mapping by providing manually annotated features, which we hope will be useful for mapping to holistic scores. For ex-ample, a response may present the main content of an item correctly but add imaginary details, while another may address background information not asked about in the prompt (see section3). The ac-ceptability of a response is thus taken as a function of several interacting features, most of which re-late the text to the known semantic content. Relat-ing to known content is distinct from typical gram-matical error correction (GEC) (Leacock et al.,
2014) and from more linguistically driven work such as parsing (e.g., Cahill et al., 2014;Ragheb and Dickinson, 2014), but providing the dimen-sions of acceptability and elucidating how they are applied provides insight for any enterprise desir-ing to connect learner text with semantic content, in addition to unpacking the sources of variation and of difficulty in processing a range of learner data.
In section 2 we outline the picture description task (PDT) we use, designed with items that elicit specific types of linguistic behavior. Section3 out-lines the annotation, tackling the five-dimensional scheme; inter-anntotator agreement results are in section4. While agreement seems reliable, high-lighting areas of disagreement showcases difficult areas for establishing a link between form and meaning (cf., e.g.,Meurers and Dickinson,2017).
2 Picture Description Task 2.1 PDT Stimuli
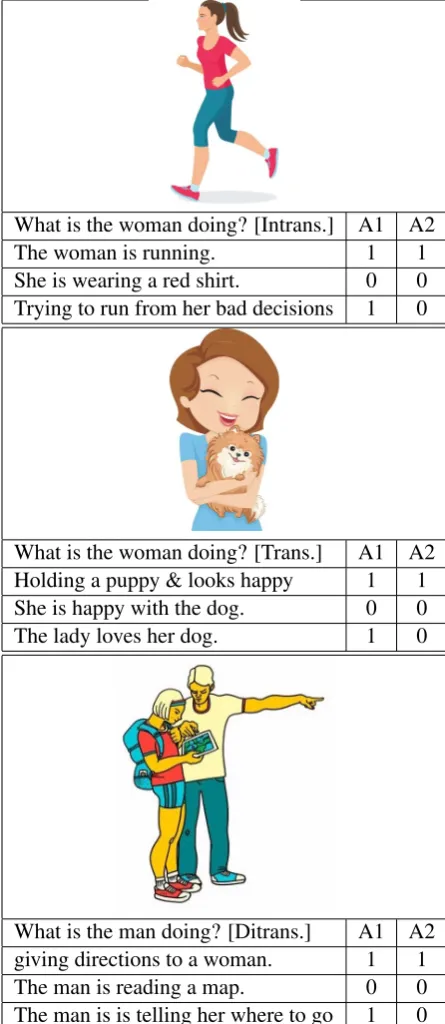
The PDT is built around 30 cartoon-like vector graphics, or items. The images were modified to remove any non-essential detail or background; some examples are in Table1. To factor out the in-fluence of previous linguistic context, images are devoid of any text or symbols, with the exceptions of two images containing numerals, two with mu-sic notes, and one with a question mark. Each im-age depicts an ongoing or imminent action,
per-formed by a person or an animal. The images are divided evenly into canonically intransitive, tran-sitive and ditrantran-sitive actions.
Two main versions of the PDT were used. In each version, the first half contains targeted
items, where questions take the form of What is
<subject>doing?, with the subject provided (e.g.,
the boy, the bird). The second half contains un-targeted items, where the question is, What is happening?. Collecting both versions allows one to examine response variation with and without a subject constraint, thereby informing approaches to task design and automatic content assessment (Foster and Tavakoli, 2009; Cho et al., 2013). Roughly equal numbers of targeted and untargeted
responseswere collected for each item.
Each half (targeted and untargeted) is intro-duced with instructions, including an example item with sample responses. The instructions ask participants to focus on the main event depicted in the image and for each response to be one com-plete sentence. The PDT was presented as an online survey, and all participants typed their re-sponses. Participants were instructed not to use any reference materials, but were permitted to use browser-based spell checking.
2.2 Data Collection
A total of approximately 16,000 responses were collected from 499 participants. Of these, 141 were NNSs, recruited from intermediate and ad-vanced writing courses for English as a Second Language students attending Indiana University. Nearly 90% of these recruits were native speakers of Mandarin Chinese, which could have important implications for conclusions drawn from the cor-pus. These participants performed the task in a computer lab with the researchers present. They were native speakers of Mandarin Chinese (125), Korean (4), Burmese (3), Hindi (2), and one na-tive speaker each of Arabic, Indonesian Bahasa, German, Gujarati, Spanish, Thai and Vietnamese. Of the 358 NS participants, 29 were person-ally known by the researchers. Responses from the remaining 329 NSs were purchased via an on-line survey platform where participants earn cred-its they can redeem for gift cards and prizes. Due to length restrictions for purchased surveys, these NSs each completed only half of the task, so their data is equivalent to 164.5 full participants.
What is the woman doing? [Intrans.] A1 A2
The woman is running. 1 1
She is wearing a red shirt. 0 0
Trying to run from her bad decisions 1 0
What is the woman doing? [Trans.] A1 A2 Holding a puppy & looks happy 1 1
She is happy with the dog. 0 0
The lady loves her dog. 1 0
What is the man doing? [Ditrans.] A1 A2
giving directions to a woman. 1 1
The man is reading a map. 0 0
The man is is telling her where to go 1 0
Table 1: Test sample items and example responses with Core Event annotations from Annotators 1 and 2.
2013), NSs were found to produce less variation than NNSs. Many NSs provided identical re-sponses or ones very similar to the most canonical way of expressing the main action. One purpose of gathering the data is to be able to assess NNS sponse content by comparing it against the NS re-sponses; thus, NSs were asked to provide two non-identical responses, in the hopes that this would result in more examples of native-like responses
for the NNS responses to compare against.
Targeted Untargeted
Set NS NNS NS NNS
Intrans 0.628 0.381 0.782 0.492
Trans 0.752 0.655 0.859 0.779
Ditrans 0.835 0.817 0.942 0.936
Table 2: NS and NNS type-to-token ratios (TTR) for complete responses (not words), for all the data.
To examine the degree of variation among the NS and NNS groups in the current study, type-to-token ratios (TTR) were calculated on the re-sponse level (ignoring case and final punctuation) for the entire set of items, shown in Table2. For each data point in the table, the corpus contains roughly 150 NS responses and 70 NNS responses. To control for this imbalance and its effect on the likelihood of seeing new responses, the TTR was calculated for each item based on a random sample of 50 responses. Specifically, we randomly sam-pled 50 responses, calculated the TTR, and aver-aged them. The scores in in Table 2 show that, in all cases, the NS set shows a greater degree of response variation, meaning that asking for two re-sponses is an effective way of collecting a broader range of NS responses.
The ratios show the direct relationship between the complexity of the event portrayed (represented here as intransitive, transitive and ditransitive) and the degree of variation elicited. In all cases, TTR increases with this complexity. Interestingly, this trend seems more pronounced in the NNS re-sponses; in the targeted NNS responses, the TTRs for intransitive and ditransitive items are 0.381 and 0.817, respectively, compared to 0.628 and 0.835 for NS responses. The ratios also show that in all cases, variation is greater for untargeted items than it is for targeted items. In other words, asking about a particular subject in the prompt question does constrain the variety of responses.
3 Annotation scheme
[image:3.595.71.294.64.577.2] [image:3.595.318.517.86.158.2]three-point scale, ranging fromaccurate and native-like (2) toaccurate but not native-like(1) tonot accu-rate(0). This proved problematic, however, as ac-curacyandnative-likenesscould not be adequately defined and applied to the data. For example, in the middle picture of Table1, it is not clear how accurate or native-likeShe is happy with the dog is. Grammatically, it is native-like, but it does not seem like an appropriate answer to the question, What is the woman doing?
To address the specifics of appropriate answers, five binary features were eventually settled on, with each feature having some relation to the orig-inal concepts of accuracy and native-likeness. A set of annotation guidelines were produced with definitions, rules and examples for each feature. For most features, the rules for targeted and un-targeted items vary slightly; the unun-targeted rules are generally less strict. The features and brief de-scriptions are listed here and discussed further in the following sections:
1. Core Event: Does the response capture the core event depicted in the image? Core events are not pre-defined but should be fairly obvious given the nature of the images. The response should link an appropriate subject to the event. In the top picture of Table1, The woman is running clearly captures the core event, whileShe is wearing a red shirtis ir-relevant to the event happening.
2. Verifiability: Does the response contain only information that is true and verifiable based on the image? Inferences should not be spec-ulations and are allowed only when neces-sary and highly probable, as when describ-ing a familial relationship between persons depicted in the image. For example, in Ta-ble1,She is wearing a red shirtconveys in-formation that is irrelevant to the core event but is nonetheless recoverable from the image (annotation=1), whileTrying to run from her bad decisionshas information that cannot be inferred from the picture.
3. Answerhood: Does the response make a clear attempt to answer the question? This generally requires a progressive verb. For tar-geted items, the subject of the question, or an appropriate pronoun, must be used as the sub-ject of the response. For example, The dog
is happyis answering a question other than What is the woman doing?(Table1).
4. Interpretability: Does the response evoke a clear mental image (even if different from the item image)? Any required verb arguments must be present and unambiguous. For ex-ample,The map is hard to readis too vague to generate a clear mental image (Table1). 5. Grammaticality: Is the response free from
errors of spelling and grammar? In our data set, this is a relatively straightforward feature to annotate (see section4).
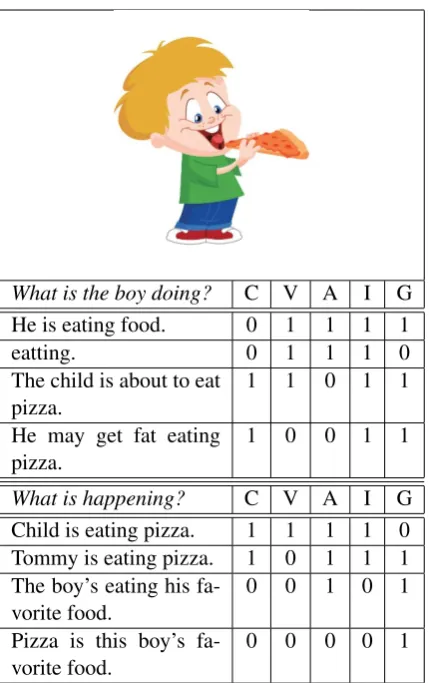
Example annotations In Table3, we see exam-ple responses with all five features annotated, il-lustrating each feature’s distinctiveness from the others. For example, forHe is eating foodone can generate a mental picture, e.g., of someone chew-ing (interpretability=1), but the pizza is important to the item image (core event=0). As another example, He may get fat eating pizza seems to be addressing a question about the con-sequences of the eating action (answerhood=0) and talks about hypotheticals not in the picture (verifiability=0). Teasing apart these an-notations is the focus of the next section.
4 Agreement
Two annotators participated in the annotation. Both are native speakers of (US) English, and each has several years of language teaching experience with both children and adult learners. Annotator 1 (A1) annotated the complete corpus. Annotator 2 (A2) annotated only the development set and the test set, data subsets described next.
Three items were used as a development set for creating and revising the annotation scheme. These items were also used as examples in the guidelines. They represent one intransitive, one transitive and one ditransitive item. Both anno-tators annotated portions of the development set multiple times throughout the process, discussing and adjudicating disagreeing annotations before moving on to the test set, which was completed without consultation between the annotators.
What is the boy doing? C V A I G
He is eating food. 0 1 1 1 1
eatting. 0 1 1 1 0
The child is about to eat
pizza. 1 1 0 1 1
He may get fat eating
pizza. 1 0 0 1 1
What is happening? C V A I G
Child is eating pizza. 1 1 1 1 0
Tommy is eating pizza. 1 0 1 1 1
The boy’s eating his
fa-vorite food. 0 0 1 0 1
Pizza is this boy’s fa-vorite food.
0 0 0 0 1
Table 3: Targeted and untargeted sample responses from the development set transitive item, shown with adjudicated annotations for the five features: core event (C), verifiability (V), answerhood (A), interpretability (I) and grammaticality (G).
4.1 Transitivity
Comparing the intransitive, transitive and ditran-sitive items reveals an association between ment and item complexity. The highest raw agree-ment and Cohen’s kappa scores are found with the intransitive item (97.8%,κ= 0.910) and the
low-est with the ditransitive (92.4%,κ= 0.764).
This is as expected, as ditransitive sentences are longer and have more verbal arguments, making for more opportunities for responses to vary (see Table 2), and thus more opportunities for anno-tators to disagree on a response. This trend also matches annotator feedback: both ranked the di-transitive item as the most difficult to annotate overall, and the intransitive as the easiest.
4.2 Targeting
Grouping the annotations into targeted and untar-geted sets, the raw agreement scores are
compara-ble (94.9%vs.95.2%). However, despite a greater degree of response variation, the untargeted group has a higher kappa score (0.872vs.0.823). When
asked to compare the annotations, A2 noted that targeted responses require more concentration and closer consultation of the guidelines. For exam-ple, answerhood does not allow for targeted responses to modify the subject provided in the question in any way, whereas in answeringWhat is happening?, the respondent is free to speak of characters in the pictures in many different ways. Both A1 and A2 thus describe the annotation of untargeted items as less restrictive.
4.3 Features
Grouped by feature, the annotations all show raw agreement scores above 91% and Cohen’s kappa scores above 0.74 (Table4). For future use of this corpus in content assessment, these kappa scores are comfortably above the 0.67 suggested as a baseline for meaningful, reliable agreement ( Lan-dis and Koch, 1977; Artstein and Poesio, 2008). We discuss each feature in turn, highlighting dif-ficulties in coming to an agreement, as such dis-agreements illustrate some sources of variability.
Core event Isolating whether the main content of the picture is being described or not, thecore eventfeature is the most relevant of the five for content assessment. All five features are skewed toward yes annotations, but with an average yes rate of 72.5%, core event is the least skewed; i.e., more responses receive anoannotation forcore eventthan for any other feature.
Core event has the second lowest inter-annotator agreement kappa score, at 0.808. This is somewhat lower than expected, as the pre-adjudication development set score was 0.889. This appears to be largely attributable to the diffi-culty of the ditransitive item, challenging for both participants and annotators (section4.1).
[image:5.595.75.290.58.400.2]Set Total A1Yes A2Yes AvgYes Chance Agree Kappa
Intransitive 2155 0.863 0.855 0.859 0.758 0.978 0.910
Transitive 2155 0.780 0.774 0.777 0.653 0.949 0.853
Ditransitive 2155 0.812 0.786 0.799 0.678 0.924 0.764
Targeted 3390 0.829 0.818 0.824 0.709 0.949 0.823
Untargeted 3075 0.806 0.790 0.798 0.678 0.952 0.872
Core Event 1293 0.733 0.717 0.725 0.601 0.923 0.808
Verifiability 1293 0.845 0.817 0.831 0.719 0.968 0.884
Answerhood 1293 0.834 0.831 0.833 0.721 0.982 0.936
Interpretability 1293 0.818 0.787 0.802 0.682 0.919 0.744
Grammaticality 1293 0.861 0.872 0.866 0.768 0.960 0.827
Table 4: Agreement scores broken down by different properties of the test set: total annotations (Total),yes anno-tations for Annotator 1 and 2 (A1Yes,A2Yes), averageyesannotations (AvgYes), total expected chance agreement foryeses andnos (Chance), actual raw agreement (Agree) and Cohen’s kappa (Kappa).
likely to accept these less specific descriptions. Similarly, but to a lesser extent, the transitive item, which shows a woman hugging a dog (Ta-ble 1), resulted in disagreements where A2 ac-cepts the word pet as the object, but A1 rejects such responses as too vague. Despite the accept-able scores forcore eventagreement, the fact that many disagreements hinge on particular word choice or annotators having minor differences in interpretation of the event suggest that greater agreement could be achieved by providing anno-tators with suggestions about the acceptable con-tent for each response. In other words: by more clearly determining the desired level of specificity of a response—for the verb or its arguments— agreement could be higher. The desired speci-ficity may vary in accordance with the intended use of the annotations; in the current annotations, the standard discussed between annotators and in the guidelines included pragmatic considerations like naturalness, native-likeness and effort.
Verifiability On the flipside of the question of whether the core semantic content is expressed is the question of whether any extraneous content is added, or any content used in a way which can-not be verified from the picture. The average yes rate for verifiability is 83.1%, making it the third most skewed feature.
The raw agreement score is 96.8%, and the kappa score is 0.884. By both measures, this is the second highest agreement score, af-ter answerhood. Of 42 disagreements for
verifiability, annotators agree that at least eight are avoidable. Of these, five involve the
in-correct use of plurals. For example, A1 acceptedA man is pointing the way for the women, when the image shows only one woman, but the guidelines reject such responses. Two other errors stem from inaccuracy, with respondents referring to a dog in the illustration as a cat. Each annotator incorrectly accepted one such response. One disagreement involved the misspelling of a crucial object: The woman is holding the pat. It is unclear whether pet or cat was intended. This should render the response unverifiable, but A1 accepted it.
The remaining disagreements are attributable to different opinions about inferences, with A2 being, in general, more strict. For the ditransi-tive item, for example, both annotators accept re-sponses that refer to the woman as ahiker, but only A1 accepts responses where the man and woman are collectively referred to as hikers. For the in-transitive item depicting a woman running, A1 ac-cepts multiple responses that refer to this asa race, as well as responses that infer the runner’s motiva-tion (fitness, leisure, etc.).
Answerhood Capturing the semantic content of the picture isn’t the only criterion for determin-ing the quality of a response; theanswerhood
ob-scene at the cost of attempting a direct answer. The majority of participants do attempt to fol-low the instructions and answer the question, how-ever, and it is unsurprising that this feature skews strongly towardyesannotations and results in the highest raw agreement (98.2%) and kappa (0.936) scores among the five features.
Of 23 disagreements, seven stem from one an-notator failing to enforce the requirement that a targeted response subject be either an appropriate pronoun or the exact subject given in the question, without adjectives, relative clauses or other modi-fiers. Given the questionWhat isthe woman do-ing?, for example, the responsesTheladyis run-ningandThe womanwho in pinkis runningwere incorrectly accepted by one annotator. While this criterion may seem strict, this subject-identity rule separates the task of identifying an attempt to an-swer the question from the task of verifying infor-mation (seeverifiabilityabove).
Another ten disagreements involve responses lacking a progressive verb, generally required as an indication that the response refers to the spe-cific action in the image and does not merely de-scribe a state or a general truth (cf., e.g., The woman is running vs. The woman runs). An-notator fatigue thus accounts for the majority of
answerhooddisagreements.
Interpretability The average yes rate for
interpretability is 0.802; only core event is less skewed: responses were thus also more likely to be unacceptable. The raw agreement score is 91.9% and kappa is 0.744, the lowest scores among the five features. This was anticipated, because interpretability is perhaps the most difficult to define, leaving room for annotators’ personal judgments. Annotators must decide whether a given response evokes a clear mental image, regardless of how well that mental image matches the PDT image. In this way, responses such asThe man is workingwhich may be completely verifiable may still fall short, in that the man could be picking fruit, building a bridge, and so forth.
The guidelines place some restrictions on what it means to be a clear mental image. To begin with, if one were to illustrate the response, the result would be a complete, representational, canonical image. It would not be necessary to guess at major elements, like subjects or objects. All necessary semantic arguments would be identifiable from the
sentence and thus not obscured or out of the frame in the mental image. Vague language should be avoided, but human gender does not need to be specified, especially when a non-gendered word likedoctororteacheris natural.
Consider a response likeA woman is receiving a package. By these criteria, the response is an-notated as 0 because the person or entity deliver-ing the package is not specified, and an illustrator would need to either guess or compose the image with the deliverer oddly out of the frame. A man is delivering a package, on the other hand, would be accepted. An illustrator could simply show a delivery person carrying a package, as an indirect object would not be necessary for the verbdeliver. Among the 105 annotator disagreements, fa-tigue accounts for roughly 30; this is difficult to determine precisely because annotators expressed difficulty in identifying a single root cause for many disagreements. Those that are clearly at-tributable to annotator error tend to involve re-sponses with some internal inconsistency, as with subject-verb disagreements, where the number of the subject is uninterpretable. Among true dis-agreements, the level of specificity is often the point of contention, as withcore event. For example, A1 accepted several transitive item re-sponses with the verblove, as inThe woman loves her dog(Table1). A2 explained that these are too vague to illustrate as an action; A1 disagreed, and this seems to indicate differing judgments regard-ing the use ofloveas a dynamic verb.
Grammaticality The grammaticality fea-ture is the most heavily skewed one, with an aver-ageyesrate of 86.6%. As the only non-semantic annotation, this is perhaps not surprising.
Grammaticality has a raw agreement score of 96.0% and a kappa of 0.827. Among 52 dis-agreements, annotators concurred in discussion that 19 involve an avoidable annotator error. These are primarily responses with typos, misspellings, subject-verb disagreement and bare nouns, all re-jected by the annotation rules. Such cases are likely attributable to annotator fatigue.
spe-cial challenges in the context of learner language (Tetreault and Chodorow,2008a,b). For example, annotators could not agree on the grammaticality of the prepositions inThe girl is asking for helpto
the manandThe girl is huggingwithher cat.
4.4 NS & NNS responses
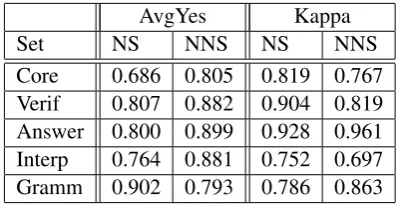
Agreement scores were also calculated separately for NS and NNS responses, as shown in Table5. Comparing the average rate of yes annotations shows that the NNSs outperform the NSs by be-tween roughly 8% and 12% on all features ex-ceptgrammaticality. It is not surprising that NSs outperform NNSs on this feature (90.2% to 79.3%), but to account for their superior perfor-mance on the other features, one must consider the fact that the NNSs were recruited from ESL courses and performed the task with peers and re-searchers present. The NNSs were more likely to make a good faith effort than the NSs, the major-ity of whom performed the task anonymously and remotely. Furthermore, with twice as many re-sponses to provide for each item for NSs, fatigue and boredom may have been a contributing factor.
AvgYes Kappa
Set NS NNS NS NNS
Core 0.686 0.805 0.819 0.767
Verif 0.807 0.882 0.904 0.819
Answer 0.800 0.899 0.928 0.961
Interp 0.764 0.881 0.752 0.697
[image:8.595.81.284.398.501.2]Gramm 0.902 0.793 0.786 0.863
Table 5: NS and NNS test set responses: averageyes annotations (AvgYes) and Cohen’s kappa (Kappa).
Raw agreement scores are high among both groups, ranging from 91% to 99.3% (not shown). Notably, for core event, verifiability
and interpretability, kappa scores are higher for NS responses than for NNS ones; i.e., annotators agree more on NS responses for these features. It may be no coincidence that these three features are the most closely tied to mean-ing, while answerhood gets at pragmatics and
grammaticalityfocuses on form correctness. The lower kappa score for NS answerhood
is also attributable to task effects, as a second re-sponse (as required of NSs) is more likely to be off topic or in bad faith. Forgrammaticality, kappas for annotator agreement are higher for NNS responses. A relatively low rate of expected
(chance) agreement contributes to this fact. Addi-tionally, annotators note that many grammar prob-lems with NNS responses are obvious (e.g., The
man who in yellowis showing the way to a girl, see Table1), but the few grammar problems in NS data are mostly typos and more easily overlooked due to fatigue (e.g.,The man is givingditections).
5 Conclusion
The SAILS corpus presented here was developed with specific research in mind, but also in the hopes that it may be used to address a broad range of questions. We have demonstrated here a set of binary features that were successfully im-plemented with reliable levels of inter-annotator agreement. These features were defined with an eye toward content analysis and ICALL, but we believe the annotations and raw responses could find uses in question answering, dialogs, prag-matic modeling, visual references and other chal-lenges in natural language processing. The feature set could also be expanded to better suit other pur-poses, and the task could easily be extended to in-clude new items. Guidelines, task materials and annotation tools are included with the corpus.1
A number of lessons have been learned in this process, and as we intend this work to be ex-tendable, a few suggestions are in order. The inclusion of any symbols or numerals should be avoided as they resulted in response complica-tions; some participants gave clever “meta” re-sponses (She’s breathing in music notes, rather than She’s singing), and others focused on the symbols rather than the abstract concepts they rep-resent (The teacher is teaching ‘2+2=4’, rather thanThe teacher is teaching math). The compar-ison of crowdsourced NS data with the data of known NS participants and the NNS student data makes it clear that motivations and task environ-ment can affect the quality of responses.
Additionally, more clearly defining acceptable
core events could lessen the ambiguity for annotators. While we intend the NS responses col-lected here to be useful for comparing with NNS responses and addressing related research ques-tions, for specific applications like language test-ing, the use of expert annotators and constructed reference materials or gold standards may be more appropriate (Somasundaran and Chodorow,
2014).
References
Luiz Amaral and Detmar Meurers. 2007. Conceptual-izing student models for ICALL. InProceedings of the 11th International Conference on User Model-ing, Corfu, Greece.
Ron Artstein and Massimo Poesio. 2008. Survey ar-ticle: Inter-coder agreement for computational lin-guistics.Computational Linguistics, 34(4).
Stacey Bailey and Detmar Meurers. 2008. Diagnosing meaning errors in short answers to reading compre-hension questions. In The 3rd Workshop on Inno-vative Use of NLP for Building Educational Appli-cations (ACL08-NLP-Education), pages 107–115, Columbus, OH.
Aoife Cahill, Binod Gyawali, and James Bruno. 2014.
Self-training for parsing learner text. InProceedings of the First Joint Workshop on Statistical Parsing of Morphologically Rich Languages and Syntactic Analysis of Non-Canonical Languages, pages 66– 73, Dublin, Ireland. Dublin City University.
Yeonsuk Cho, Frank Rijmen, and Jakub Nov´ak. 2013. Investigating the effects of prompt characteristics on the comparability of toefl ibtł integrated writing tasks.Language Testing, 30(4):513–534.
Pauline Foster and Parvaneh Tavakoli. 2009. Native speakers and task performance: Comparing effects on complexity, fluency, and lexical diversity. Lan-guage learning, 59(4):866–896.
Trude Heift and Mathias Schulze. 2007. Errors and Intelligence in Computer-Assisted Language Learn-ing: Parsers and Pedagogues. Routledge.
Levi King and Markus Dickinson. 2013. Shallow se-mantic analysis of interactive learner sentences. In Proceedings of the Eighth Workshop on Innovative Use of NLP for Building Educational Applications, pages 11–21, Atlanta, Georgia.
Levi King and Markus Dickinson. 2016. Shallow se-mantic reasoning from an incomplete gold standard for learner language. In Proceedings of the 11th Workshop on Innovative Use of NLP for Building Educational Applications, pages 112–121.
Kristopher Kyle and Scott A Crossley. 2015. Auto-matically assessing lexical sophistication: Indices, tools, findings, and application. Tesol Quarterly, 49(4):757–786.
J Richard Landis and Gary G Koch. 1977. The mea-surement of observer agreement for categorical data. biometrics, pages 159–174.
Claudia Leacock, Martin Chodorow, Michael Gamon, and Joel Tetreault. 2014. Automated Grammatical Error Detection for Language Learners, second edi-tion. Synthesis Lectures on Human Language Tech-nologies. Morgan & Claypool Publishers.
Detmar Meurers and Markus Dickinson. 2017. Ev-idence and interpretation in language learning re-search: Opportunities for collaboration with com-putational linguistics. Language Learning. Special Issue on Language learning research at the inter-section of experimental, corpus-based and compu-tational methods, 67(S1):66–95.
Detmar Meurers, Ramon Ziai, Niels Ott, and Janina Kopp. 2011. Evaluating answers to reading com-prehension questions in context: Results for german and the role of information structure. In Proceed-ings of the TextInfer 2011 Workshop on Textual En-tailment, pages 1–9. Association for Computational Linguistics.
Marwa Ragheb and Markus Dickinson. 2014. The effect of annotation scheme decisions on parsing learner data. In Proceedings of the 13th Interna-tional Workshop on Treebanks and Linguistic The-ories (TLT13), T¨ubingen, Germany.
Swapna Somasundaran and Martin Chodorow. 2014.
Automated measures of specific vocabulary knowl-edge from constructed responses (‘Use these words to write a sentence based on this picture’). In Pro-ceedings of the Ninth Workshop on Innovative Use of NLP for Building Educational Applications, pages 1–11, Baltimore, Maryland.
Swapna Somasundaran, Chong Min Lee, Martin Chodorow, and Xinhao Wang. 2015. Automated scoring of picture-based story narration. In Proceed-ings of the Tenth Workshop on Innovative Use of NLP for Building Educational Applications, pages 42–48, Denver, Colorado. Association for Compu-tational Linguistics.
Joel Tetreault and Martin Chodorow. 2008a. Na-tive judgments of non-naNa-tive usage: Experiments in preposition error detection. In Coling 2008: Pro-ceedings of the workshop on Human Judgements in Computational Linguistics, pages 24–32, Manch-ester, UK. Coling 2008 Organizing Committee.
Joel Tetreault and Martin Chodorow. 2008b. The ups and downs of preposition error detection in ESL writing. In Proceedings of COLING-08, Manch-ester.