Proceedings of the Thirteenth Workshop on Innovative Use of NLP for Building Educational Applications, pages 305–314
The Effect of Adding Authorship Knowledge in Automated Text Scoring
Meng Zhang1, Xie Chen2, Ronan Cummins3, Øistein Andersen1, and Ted Briscoe1
1,3ALTA Institute, Department of Computer Science and Technology, University of Cambridge, UK 1{mz342, oa223, ejb1}@cam.ac.uk
2Department of Engineering, University of Cambridge, UK 2[email protected]
Abstract
Some language exams have multiple writing tasks. When a learner writes multiple texts in a language exam, it is not surprising that the quality of these texts tends to be similar, and the existing automated text scoring (ATS) systems do not explicitly model this similar-ity. In this paper, we suggest that it could be useful to include the other texts written by this learner in the same exam as extra references in an ATS system. We propose various ap-proaches of fusing information from multiple tasks and pass this authorship knowledge into our ATS model on six different datasets. We show that this can positively affect the model performance in most cases.
1 Introduction
The existence of various English exam products provides a useful and fair way for language learn-ers to measure their English skills accurately. It also offers a well-accepted standard to help schools and companies to quantitatively judge whether their non-native English applicants meet the compulsory language requirements they set up. Many learners have taken different English exams to get the qualifications required by different or-ganisations. For example, more than two mil-lion International English Language Testing Sys-tem (IELTS) exam sessions have been taken in 2012-20131, and more than 30 million people have taken the Test of English as a Foreign Language (TOEFL) exam2.
English exams like IELTS and TOEFL have free-text writing tasks to evaluate a learner’s writ-ing ability. For a writwrit-ing task, each learner needs to write a text to answer the prompt in the task. Appropriately assessing the quality of free-text 1
https://www.britishcouncil.org/organisation/press/record-two-million-ielts-tests
2https://www.ets.org/toefl/ibt/about
writings requires highly proficient human exam-iners, and the lack of professional and qualified examiners makes it hard for learners to get accu-rate feedback on the quality of their writings in a timely fashion. Consequently, it is hoped that an ATS system can possibly act as a kind of examiner to mitigate this problem, which offers an assis-tance to both learners and educators. The goal of ATS is to improve consistency and reduce human resource overheads. ATS usually utilises machine learning techniques to build a model to learn the underlying relationship between texts and scores. ATS is often used as the second marker in high-stakes exams, the only marker in practice and tu-toring software products.
1.1 Multiple Writing Tasks
To evaluate a learner’s writing skill more thor-oughly, many English exams like IELTS and TOEFL ask them to answer multiple writing tasks. These tasks are drawn from different topics and genres, and each learner is required to write a text for each task. In practice, human judges score each text with anindividual score, and these scores are aggregated to obtain anoverall score, which reflects their writing skills. We also define the ATS model predicting the individual score of a text and the overall score of all the texts as the individual-levelandoverall-levelmodels, respec-tively.
When an individual-level ATS model scores texts, previous work has made an implicit as-sumption that all responses to all tasks are com-posed independently. This is not true for exams requiring responses to multiple tasks. The writ-ing skill exemplified by a learner durwrit-ing the same exam session will not normally vary greatly, so the texts written by one learner may share some com-monalities, such as preferential word usages and common mistakes, and should also approximately
equally reflect their writing skills. We suggest that when an individual-level model predicts the score of a text written by a learner, it is helpful to use their other texts as a reference and pass it as an ex-tra piece of information to the model. We refer to this information asauthorship knowledge.
We suggest that the potential benefit of pass-ing this authorship knowledge to an ATS model might come from a reduction of data sparsity and improvement in the robustness and reliability of feature extraction. Normally the text length for each task is limited, and so there may be insuffi-cient features exemplified in a single response to differentiate language proficiency levels. It can be challenging for an ATS model to learn the mapping between texts and scores accurately, and adding authorship knowledge might provide addi-tional salient features to learn the mapping.
In this paper, we test the hypothesis that au-thorship knowledge can improve individual-level model performance. We pass this authorship knowledge to an individual-level model in two in-dependent ways: feature fusion and score fusion. When the model predicts text scores, both meth-ods pass all the texts written by the same learner to the model as an extra reference. It is shown that adding this knowledge is helpful in an individual-level ATS model in most cases. To the best of our knowledge, this is the first study that studies how authorship knowledge affects ATS system perfor-mance.
2 Related Work
In most previous work, text features are defined manually and automatically extracted from each text. A machine learning model is then applied to learn the mapping from features to scores. Many different machine learning models have been used, including regression (Page, 2003; At-tali and Burstein,2006;Phandi et al.,2015), clas-sification (Larkey,1998;Rudner and Liang,2002) and ranking (Chen and He,2013;Cummins et al., 2016b). The features used in previous work range from shallow textual features to discourse struc-ture and semantic coherence (Higgins et al.,2004; Yannakoudakis and Briscoe,2012;Somasundaran et al.,2014), and from prompt independent to de-pendent features (Cummins et al., 2016a). Some recent models have dispensed with feature engi-neering and utilised word embeddings and neu-ral networks (Alikaniotis et al., 2016;Dong and
Zhang,2016;Taghipour and Ng,2016).
However, no previous work has investigated the utility of authorship knowledge in ATS. One possi-ble reason is that most datasets only have one text written by each learner. The First Certificate in English (FCE) dataset released byYannakoudakis et al.(2011), on the other hand, contains two texts per learner. We primarily focus on the FCE dataset in this paper, but also utilise other datasets to cor-roborate our results.Yannakoudakis et al. defined all the texts written by a learner as ascript. They extracted features from each text and then com-bined the features of the two texts within the same script together. A support vector machine (SVM) ranking model was trained to learn the relationship between features and overall scores.
3 Datasets
In this paper, we require a dataset that includes more than one text written by each learner, where each text is scored with an individual-level score. We finally get six datasets in total for our exper-iments. Each dataset is a set of texts collected from a real exam, and each exam is targeted at one or more Common European Framework of Refer-ence for Languages (CEFR) 3 levels in English. There are six CEFR levels in total: A1, A2, B1, B2, C1 and C2 arranged from lowest to highest.
In each dataset, each script consists of the an-swers to two tasks. The anan-swers to both tasks were scored on the same grading scale. Each script was written on the same day so we can safely assume no dramatic variation in the writing skill for each learner. The FCE dataset discussed in Section 2 was collected from the FCE exam. The other five datasets were provided by Cambridge Assessment collected from different years.
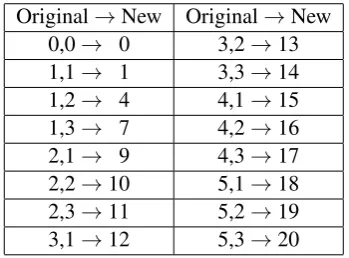
We need to choose the score for each text for an ATS model to learn. As the original score for each text in the FCE is not reported on a numer-ical scale, Cambridge Assessment helped us con-vert the grades to integers between 0 and 20. This mapping is available in Table2. All the texts from the B2-U, B2-S, C1-U and C1-S datasets are eval-uated in terms of four aspects: content, commu-nicative achievement, language quality and organ-isation. Each aspect is scored as an integer in the range 0-5. We add the scores of these four aspects of a text together to obtain a total score in the range 0-20, and we use this total score as the score for
Exam CEFR Score Range MEAN STD # prompts # scripts # train # dev # test
FCE B2 0-20 13.92 2.92 31 1212 822 293 97
B2-U B2 0-20 14.51 2.18 37 2047 1447 300 300
C1-U C1 0-20 13.20 2.69 50 2088 1488 300 300
AL-U A1-C2 0-9 5.78 0.96 58 1604 1004 300 300
B2-S B2 0-20 13.72 2.41 67 6584 5984 300 300
[image:3.595.94.269.419.548.2]C1-S C1 0-20 12.77 2.73 35 1910 1310 300 300
Table 1: The details of the six datasets. FCE is the dataset released byYannakoudakis et al.. For the other five datasets, the name of each dataset encodes its target CEFR level learners with whether it is unshuffledorshuffled. B2-U means that it aims at B2 level learners and isunshuffled. MEAN and STD describe the mean and standard deviation of the scores. All the datasets have two writing tasks, and for each writing task, each learner is required to write an answer to one prompt. # prompts describes how many prompts exist in each dataset.
this text for our study. In contrast, AL-U is marked on a scale of 0-9 at 0.5 mark intervals, where each text also receives a score for each of four aspects including task achievement, coherence, word us-age and grammar. The total score is aggregated from the scores on all four aspects by Cambridge Assessment, and it is still normalised to 0-9 at 0.5 mark intervals. In this case, we directly use the ex-isting total score as the individual score for a text in AL-U for our study.
Original→New Original→New
0,0→ 0 3,2→13
1,1→ 1 3,3→14
1,2→ 4 4,1→15
1,3→ 7 4,2→16
2,1→ 9 4,3→17
2,2→10 5,1→18
2,3→11 5,2→19
3,1→12 5,3→20
Table 2: The score mapping in the FCE dataset
We summarise the six datasets in Table1. The difference between the shuffled and unshuffled datasets in Table 1 is how texts are presented to human judges to score. For the four unshuffled datasets, each human judge marks the first and sec-ond text written by a learner in sequence, so the score of the second text might be affected by the first marked text. In comparison, the texts in B2-S and C1-S are shuffled and randomly displayed to human judges. Hence, this removes any grading bias due to knowing the authorship.
Due to transcription errors, we only kept scripts which do not contain any invalid individual score.
After we cleaned the text scores, each dataset was then split into training, development and test sets. The total number of scripts in each dataset, and the number of scripts in the training, development and test sets are summarised in Table1. The test set for FCE is the same inYannakoudakis et al.(2011).
4 Notations
Let us introduce some notations to facilitate our discussion. Each dataset consists ofM tasks for each learner to answer, and there are J learners in one dataset. We assume that each learner only takes any exam once. All the datasets we de-scribed in Section3 require learners to write two texts. Hence, M = 2 in each dataset. tm,j de-notes themthtext written by learnerlj, which an-swers the mth task taskm in a dataset. text tm,j can be represented as a sequence of words written by learner lj. The individual score for text tm,j marked by a human examiner issm,j.
T Lj = {tm,j|m = 1, ..., M} denotes the set of all the texts written bylj in a dataset. In other words,T Lj is equivalent to the script answered by learnerlj.
T Nm,j =T Lj\tm,j denotes the neighbouring text set of tm,j, which is all the texts written by learner lj except for tm,j. In this section, since each dataset only contains 2 texts per learner, the number of texts inT Nm,jis always 1, and the only text in this set is t(M+1−m),j, which denotes the neighbouring text oftm,j.
5 Assumptions
There are two assumptions behind authorship knowledge and ATS we want to validate.
The first assumption is that there is a variable skillj which can describe the writing skill of each learner lj, and skillj is approximately constant during an exam. If we believe the skill of a learner could be measured by the English exam they take, sm,j for anym will be a sample from a distribu-tion constrained by skillj during the exam. We also assume that no learner will behave totally dif-ferently on the two tasks during the same exam. In this case, these individual text scores should be close and correlate well with their skillskillj, and this correlation might be helpful in training an individual-level model.
However, the first assumption is not always cor-rect. In some circumstances, learners will perform really well on some tasks, but fail to finish other tasks to the same quality, and they can get low scores on these tasks. An obvious reason for this is that some learners may have managed their time badly and failed to finish the second task; some may also be better prepared for the topic and genre elicited by one of the prompts.
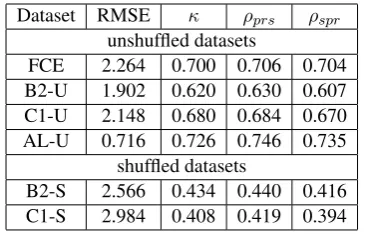
To verify and measure this assumption, we cal-culate root-mean-squared error (RMSE), quadratic weighted kappa (κ), Pearson (ρprs) and Spearman correlation (ρspr) between all the responses to the first taskT T1, and the second taskT T2 answered
by all learners. The results are given in Table3.
Dataset RMSE κ ρprs ρspr
unshuffled datasets
FCE 2.264 0.700 0.706 0.704
B2-U 1.902 0.620 0.630 0.607
C1-U 2.148 0.680 0.684 0.670
AL-U 0.716 0.726 0.746 0.735
shuffled datasets
B2-S 2.566 0.434 0.440 0.416
[image:4.595.90.273.505.622.2]C1-S 2.984 0.408 0.419 0.394
Table 3: The relation between T T1 and T T2 to
check how the scores of the first and second text written by each learner are correlated
As we can see,κ,ρprsandρsprare above 0.6 in the four unshuffled datasets, and about 0.4 in the two shuffled datasets. It is suggested by Landis and Koch(1977) that there is a substantial agree-ment between two sequences if Cohen’s Kappa is above 0.6 and a moderate agreement when
Co-hen’s Kappa is between 0.4 to 0.64. We use their interpretation to describe our results, and there is at least a moderate correlation and agreement be-tween the scores of T T1 andT T2. This verifies
our first assumption to some degree. Whether this amount of agreement can affect the performance of an ATS model is further investigated in the fol-lowing sections.
The second assumption concerns whether pass-ing authorship knowledge to an ATS model truly improves the model performance by bringing more reliable features and better understanding about each learner’s writing skill. An alternative explanation for the possible improvement, if it ex-ists, is brought by the bias during the marking pro-cedure. When comparing RMSE for the unshuf-fled and shufunshuf-fled datasets as shown in Table3, we can see that RMSE is higher for BS-2 than for B2-U, and higher for C2-S than for C2-U. This suggests that human judges might be biased when marking the second text after the first. Hence, we aim to determine whether authorship knowledge truly improves ATS performance by looking at the shuffled dataset, since any improvement on the un-shuffled dataset might be the result of grading bias.
6 Methods
To study how authorship knowledge affects ATS, we first need a baseline model.
6.1 Baseline
In the baseline model, a feature vector fm,j, ex-tracted from texttm,jwritten by learnerlj, is used to train an individual-level model to learn the rela-tionship between feature vector spaceF and text score space S. The model finally predicts the score of text tm,j as sˆm,j. The predicted score ˆ
sm,j might be invalid on the given grading scale. For example, an ATS model might predict a score of 4.3, but the grading scale requires an integer. Hence, we roundsˆm,jto the nearest valid score on the given grading scale asrsˆm,j, which is 4 in this case.
6.1.1 Features
The features for the baseline model we use are similar to those of Yannakoudakis et al. men-tioned in Section 2. More specifically, we use features including word and POS n-grams, script
4AlthoughLandis and Kochclaimed that this
length, the n-gram missing rate estimated on a background corpus, phrase structure rules, and grammatical dependency distances between any two words within the same sentence, though we only use the top parse result for grammatical rela-tion distance measures. The n-gram missing rate is estimated on UKWaC (Ferraresi et al., 2008). Besides that, we also include the number of words misspelt, the count of grammatical relation types, and the minimum, maximum and average sen-tence and word lengths. The POS tags, grammati-cal relations and phrase structure rules are derived from the RASP (robust accurate statistical pars-ing) toolkit (Briscoe et al., 2006). We remove any feature whose frequency in the training set is below 4, and keep the top 25,000 features that have the highest absolute Pearson correlation with text scores. Each feature vector is normalised to
||fm,j||= 1. 6.2 Benchmark
Yannakoudakis et al.(2011) only built an overall-level model and evaluated it in terms ofρprs and ρspr. As we use more features and also a global feature selection step, we should ensure that our model is relatively optimal and thus a challenging baseline.
We firstly concatenate all the texts in scriptT Lj together asconcatenated textctjso that
ctj :=t1,j⊕t2,j⊕...⊕tM,j
We extract the script feature vectorcfj from the concatenated textctjbased on the features defined in Section 6.1.1. We define the combined script scorecsj as the sum of the individual text scores to represent the overall score of each script:csj :=
PM m=1sm,j
The FCE dataset has another overall script scoressj for script T Lj used byYannakoudakis et al. (2011). In order to benchmark with Yan-nakoudakis et al.’s work, we train an
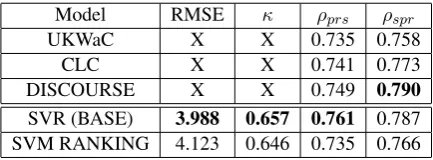
overall-Model RMSE κ ρprs ρspr
UKWaC X X 0.735 0.758
CLC X X 0.741 0.773
DISCOURSE X X 0.749 0.790
SVR (BASE) 3.988 0.657 0.761 0.787
[image:5.595.74.291.647.727.2]SVM RANKING 4.123 0.646 0.735 0.766
Table 4: The comparison of the previous work and our baseline models on the FCE test set.
level model by means of support vector regres-sion (SVR) and SVM ranking betweencfj and its script scoressjrather thancsjtogether with a lin-ear kernel. In order to get the valid predicted score on given the grading scale for SVM ranking, we train another linear regression model on the train-ing set between the ranktrain-ing scores and the actual text scores. For both SVR and SVM ranking, we then round the scores predicted from their corre-sponding regressors to the nearest valid integers on the given grading scale.
We tune the regularization hyper-parameter on the development set and report the results achiev-ing the lowest RMSE on the development set. The results are included in Table 4. The upper part of the table shows previous results. UKWaC and CLC are the results reported in Yannakoudakis et al. (2011) on SVM ranking models which use the UKWaC and the Cambridge Learner Corpus (CLC) (Nicholls,2003) as the background corpus for n-gram missing rate estimation respectively. DISCOURSE is the CLC version with extra dis-course features. In the DISCOURSE version, Yan-nakoudakis and Briscoe(2012) investigated differ-ent features to measure the coherence of a text and how these features affect the overall score of the texts in the FCE dataset. They showed that the coherence feature based on incremental semantic analysis (Baroni et al., 2007) measuring average adjacent sentence similarity can help their ATS system improve in terms of the Pearson and Spear-man correlations.
Table 4 does not include any recent neural model on the FCE dataset, because the neural model developed byFarag et al.(2017) shows that there is still a performance gap between the neural model and the models built on hand-crafted fea-tures.
Our models achieve relatively good perfor-mance, and we also found that by selecting ap-propriate features and hyper-parameters, the dif-ference between using ranking and regression to train an ATS model is relatively small. This con-trasts with Yannakoudakis et al. (2011)’s finding that ranking is much better than regression on this task. Therefore, we use SVR (BASE) in the fol-lowing experiments.
6.3 Model Fusion
them asscore fusionandfeature fusion.
For score fusion, we concatenate all the texts within the same script together as ctj written by learnerlj. We extract the script feature vectorcfj fromctj. An overall-level model is trained oncfj and its combined script score csj, which is the sum of all the individual scores of one script. This overall-level model predicts the combined script score ofctj ascsˆj, and the predicted normalised combined score csˆj
M is fused with the predicted in-dividual scoresˆm,j by linear interpolation to get the predicted fused scoref sˆ
m,j:
ˆ
f sm,j := (1−α)ˆsm,j+α ˆ csj
M
The interpolation hyper-parameterαis tuned on the development set, and f sˆ
m,j is then rounded to the nearest valid score on the given grading scale as the final predicted individual-level score fortm,j.
For feature fusion, we still extract the script feature vectorcfj fromctj. Then, we define the fused feature vector f fm,j of tm,j as the vector concatenated byfm,jandcfj together as follows:
f fm,j := (1−β)fm,j⊕βcfj
where β is the concatenation weighting hyper-parameter to be tuned on the development set. We train an individual-level model on the fused fea-ture vectorf fm,jand text scoresm,j, and the pre-dicted score ˆsm,j is rounded to the nearest valid scorersˆm,j on the given grading scale.
Another question raised by the discussion here is what to fuse. For texttm,j in score fusion, in-stead of fusing the individual scoresˆm,j with the combined script scorecsˆj, we can also fusesˆm,j with the individual predicted score sˆ(M−m+1),j from the other text within the same script, which is the neighbouring textt(M−m+1),j.
For feature fusion, when we are augmenting text feature vector fm,j tof fm,j, we can concatenate it with the feature vector f(M−m+1),j from the neighbouring textt(M−m+1),jinstead of the script feature vectorcfj derived from the concatenated text ctj. Therefore, we have two different fusion approaches, and each approach also has two dif-ferent sources to fuse.
It should be noticed that the two questions for each dataset are designed on a similar difficulty level. The fusion approach can easily be made to work even if these questions are not on the same
difficulty level. If the difficulty difference between the targeted question and the neighbouring ques-tion is too large, we can penalise the neighbouring question so that the ATS model mainly look at the targeted question. This is straightforward to do in our method by adjusting the weight of the neigh-bouring question. We will investigate questions from different difficulty levels in future work once we have a suitable dataset.
7 Results and Discussion
In this section, we evaluate the baseline model and the fusion approaches to study the influence of authorship knowledge. For each setup, we train an individual-level model for each dataset. The model for each setup is optimised on each devel-opment set in terms of RMSE. We tune the SVR regularisation and interpolation hyper-parameters on each development set. We report RMSE, κ, ρprs andρspr in Table6for each test set. The op-timal interpolation hyper-parameters for each fu-sion approach are reported asα/βin Table6.
Some readers might notice that there is a numer-ical difference between Table4and Table6for the same baseline model evaluated on the FCE test set. The reason for the difference here is that these two tables correspond to two different tasks. The task in Table4is predicting the overall-level score, and Table 6 is the individual-level score of a text. It seems that predicting the individual-level scores is a harder task as there is less text to assess (Sec-tion1.1).
For feature fusion, feature fusion with neigh-bouring text NT) and concatenated text (FF-CT) is consistently better than the baseline (BASE) on all the datasets except for the B2-U on κ, ρprs andρspr. For score fusion, score fu-sion with concatenated text (SF-CT) is better than BASE on all the six datasets except forκin AL-U. In contrast, score fusion with neighbouring text (SF-NT) is better than BASE on all the datasets re-garding RMSE except for FCE, butκis only better than BASE on C1-S. Both SF-CT and SF-NT are better than BASE in terms ofρprs andρspr. The improvement is also visible on the two shuffled datasets, and we suggest that adding authorship knowledge is not merely the result of modelling grading bias, which answers the second assump-tion in Secassump-tion5.
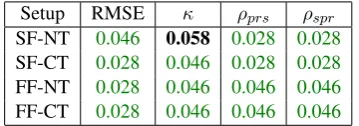
signed-rank test (Wilcoxon,1945;Demˇsar,2006) across the six datasets to see whether any setup is significantly better or worse than BASE at a global level. We use the SciPy implementation to run the test5, and thep-values of all the metrics across all the six datasets are listed in Table5. Based on the result in Table 5, there is a significant difference between all the fusion approaches (p < 0.05) and BASE on all the metrics except for SF-NT on κ across multiple datasets.
Setup RMSE κ ρprs ρspr
SF-NT 0.046 0.058 0.028 0.028
SF-CT 0.028 0.046 0.028 0.028
FF-NT 0.028 0.046 0.046 0.046
[image:7.595.93.273.210.273.2]FF-CT 0.028 0.046 0.046 0.046
Table 5: p-value for each approach estimated by the Wilcoxon signed-rank test across all the six datasets. The value bigger than 0.05 is inbold
7.1 Hyper-parameters
α, β > 0.5in each fusion approach tells the ATS model that it should favour the information from the other source over the current individual text tm,j being marked, and vice versa. We also vi-sualise the relation between β and RMSE for the feature fusion approaches in Figure1and2.
For the fusion with concatenated text ctj, α > 0.5on FCE and C1-S in SF-CT. β > 0.5for all the datasets except for B2-U in FF-CT. Further-more, if we tuneβon the test sets, we can find the optimal β for all the six datasets are bigger than 0.5. On the one hand, we are a little bit surprised that the fusion approaches with concatenated text favour ctj, and it might mean that ctj is more salient compared to the original texttm,j in ATS. On the other hand, it is still to be expected to ob-serve these results, becausectj also containstm,j, and the information fromtm,j is still dominant in the model even ifα, β >0.5.
In contrast, we expect that the model fused with neighbouring text achieves the best performance on each dataset when α orβ is smaller than 0.5, as the model should focus on the texttm,j being marked. For SF-NT in Table6, the optimalα is always smaller than 0.5. However, for FF-NT, the optimalβ = 0.5for AL-U and C1-U in Table6. Furthermore, if we choose the test sets to tuneβ instead of the development sets, we can see that
5https://www.scipy.org
β > 0.5 on the FCE, C1-U and AL-U dataset in Figure2. Based on these results, we suggest that in some cases, the features from two tasks written by the same learner could be highly similar and shared to some extent in an ATS model.
7.2 Score Difference
Although positive effects are observed in most cases, no method is significantly better than BASE on every dataset and metric we used. One reason might be that it is not ideal to aggregate the two texts written by the same learner together if the performance difference between these texts is big. For example, some learners might perform well on the first task, but fail to complete the second task. This is what we have discussed in the first assump-tion in Secassump-tion5, and this assumption might be in-valid in some cases. So, we conduct another study to see how the score difference between the two texts in each script affects the model performance. We define the script score differencesdj as the score difference between two texts t1,j and t2,j within the same scriptT Lj:sdj :=|s1,j−s2,j|.
The text score difference of texttm,j is defined as the score difference of the script to which it be-longs:sdm,j :=sdj.
The text score error errorm,j denotes the dif-ference between the predicted score and the gold score oftm,j:errorm,j :=|rsˆm,j−sm,j|.
The text score errors errorm,j produced by BASE and any fusion approach on text tm,j de-noteerrorBASEm,j anderrorFUSIONm,j , respectively.
The performance difference P Dm,j between BASE and any fusion approach for texttm,j de-notes the difference between the errors made by the two setups:
P Dm,j :=errorBASEm,j −errorFUSIONm,j (1)
P Dm,j >0means that the fusion approach is bet-ter than BASE at predicting the score oftm,j, and vice versa.
dif-Setup RMSE κ ρprs ρspr α/β RMSE κ ρprs ρspr α/β
FCE AL-U
BASE 2.569 0.511 0.662 0.652 X 0.693 0.620 0.684 0.659 X SF-NT 2.572 0.490 0.693 0.696+ 0.35 0.686 0.603 0.704 0.687+ 0.34 SF-CT 2.495 0.533 0.696 0.702+ 0.70 0.691 0.610 0.689 0.667 0.33 FF-NT 2.529 0.554+ 0.688 0.688+ 0.30 0.683 0.634 0.698 0.680 0.50 FF-CT 2.460+ 0.554+ 0.694 0.695 0.67 0.664+ 0.649+ 0.720+ 0.710+ 0.70
B2-U B2-S
BASE 1.991 0.246 0.359 0.339 X 2.085 0.386 0.476 0.442 X SF-NT 1.979 0.241 0.371 0.347 0.18 2.050+ 0.384 0.501+ 0.463 0.23 SF-CT 1.954+ 0.271+ 0.398+ 0.377+ 0.32 2.029+ 0.400 0.510+ 0.476+ 0.33 FF-NT 1.982 0.242 0.348 0.324 0.20 1.983+ 0.430+ 0.541+ 0.511+ 0.33 FF-CT 1.974 0.241 0.354 0.333 0.25 2.017+ 0.415 0.506 0.481 0.80
C1-U C1-S
[image:8.595.76.527.62.326.2]BASE 2.405 0.269 0.411 0.410 X 2.421 0.341 0.504 0.471 X SF-NT 2.387 0.260 0.438 0.433 0.37 2.413 0.343 0.511 0.480 0.02 SF-CT 2.366+ 0.288 0.453+ 0.451+ 0.37 2.346+ 0.378+ 0.567+ 0.523+ 0.78 FF-NT 2.350+ 0.304+ 0.462+ 0.455+ 0.50 2.370+ 0.389+ 0.529 0.498 0.40 FF-CT 2.378 0.296+ 0.428 0.420 0.60 2.361+ 0.381+ 0.548+ 0.513+ 0.67
Table 6: The results of different setups on the test sets. The best setup per dataset is in bold.
GREENmeans improvement andREDmeans degradation over BASE. The optimal interpolation hyper-parameters for each fusion approach are reported asα/β. + means significantly better (p <0.05) than BASE using the permutation randomisation test (Yeh, 2000) with 2,000 samples. No metric is found significantly worse than BASE.
0.00 0.50 1.00 2.300
2.350 2.400 2.450 2.500 2.550
FCE
0.00 0.50 1.00 1.920
1.930 1.940 1.950 1.960 1.970 1.980 1.990
B2-U
0.00 0.50 1.00 2.340
2.360 2.380 2.400 2.420 2.440
C1-U
dev test
0.00 0.50 1.00 0.670
0.680 0.690 0.700 0.710 0.720
AL-U
0.00 0.50 1.00 1.925
1.950 1.975 2.000 2.025 2.050 2.075
2.100 B2-S
0.00 0.50 1.00 2.275
2.300 2.325 2.350 2.375 2.400 2.425
C1-S
Figure 1: How RMSE (y-axis) changes withβ(x-axis) in FF-CT. The verticalREDandGREEN dashed-dot lines in each graph represent that the model achieves the lowest RMSE on the development and test sets at the correspondingβ.
ferenceP Dm,jand text score differencesdm,jon some datasets.
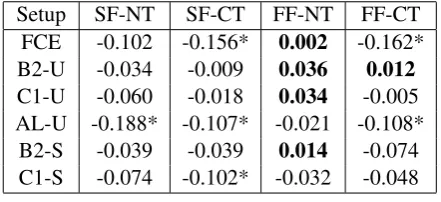
On the other hand, only thep-values for six neg-ative values in Table7are smaller than 0.05. We think the negative influence brought by the score difference is not huge, because the scores of the two texts written by the same learners are at least moderately correlated in Table3. This correlation might reduce the negative influence of score dif-ference here.
In some operational settings, it might be
[image:8.595.86.521.418.530.2]0.00 0.50 1.00 2.350
2.400 2.450 2.500 2.550 2.600 2.650
FCE
0.00 0.50 1.00 1.920
1.940 1.960 1.980 2.000 2.020
2.040 B2-U
0.00 0.50 1.00 2.340
2.360 2.380 2.400 2.420 2.440 2.460 2.480
C1-U
dev test
0.00 0.50 1.00 0.680
0.690 0.700 0.710 0.720 0.730 0.740 0.750
AL-U
0.00 0.50 1.00 1.940
1.960 1.980 2.000 2.020 2.040 2.060 2.080
B2-S
0.00 0.50 1.00 2.300
2.325 2.350 2.375 2.400 2.425 2.450
[image:9.595.82.522.63.175.2]2.475 C1-S
Figure 2: How RMSE (y-axis) changes withβ(x-axis) in FF-NT. The verticalREDandGREEN dashed-dot lines in each graph represent that the model achieves the lowest RMSE on the development and test sets at the correspondingβ.
Setup SF-NT SF-CT FF-NT FF-CT FCE -0.102 -0.156* 0.002 -0.162* B2-U -0.034 -0.009 0.036 0.012 C1-U -0.060 -0.018 0.034 -0.005 AL-U -0.188* -0.107* -0.021 -0.108*
B2-S -0.039 -0.039 0.014 -0.074 C1-S -0.074 -0.102* -0.032 -0.048
Table 7: The Pearson correlation between perfor-mance differenceP Dm,j and script score differ-ence sdm,j on the test sets. * denotes p-value <0.05, andbolddenotes a positive correlation.
8 Conclusion
In this paper, we studied how authorship knowl-edge, by means of score fusion and feature fusion, is a useful feature in ATS. We showed that in-cluding such information improves model perfor-mance at in most datasets, and that improvement is not only from modelling grading bias. One pos-sible topic for future work is to study whether the target CEFR level of each dataset affects the influ-ence of adding authorship knowledge.
9 Acknowledgement
This work is funded by the Institute for Automated Language Teaching and Assessment (ALTA). Spe-cial thanks to Christopher Bryant, Yimai Fang, Helen Yannakoudakis, Nanyang Ye and Ann Copestake, as well as the anonymous reviewers for their valuable suggestions at various stages.
References
Dimitrios Alikaniotis, Helen Yannakoudakis, and Marek Rei. 2016. Automatic text scoring using neural networks. InProceedings of the 54th
An-nual Meeting of the Association for Computational Linguistics (Volume 1: Long Papers). Association for Computational Linguistics, Berlin, Germany,
pages 715–725. http://www.aclweb.org/
anthology/P16-1068.
Yigal Attali and Jill Burstein. 2006. Automated essay scoring with e-raterR v. 2. The Journal of
Technol-ogy, Learning and Assessment4(3).
Marco Baroni, Alessandro Lenci, and Luca Onnis. 2007. Isa meets lara: An incremental word space model for cognitively plausible simulations of se-mantic learning. In Proceedings of the Workshop on Cognitive Aspects of Computational Language Acquisition. Association for Computational Linguis-tics, pages 49–56.
Ted Briscoe, John Carroll, and Rebecca Watson. 2006.
The second release of the RASP system. In
Proceedings of the COLING/ACL 2006 Interac-tive Presentation Sessions. Association for Compu-tational Linguistics, Sydney, Australia, pages 77– 80.https://doi.org/10.3115/1225403. 1225423.
Hongbo Chen and Ben He. 2013. Automated essay scoring by maximizing human-machine agreement. InProceedings of the 2013 Conference on Empirical Methods in Natural Language Processing. Associa-tion for ComputaAssocia-tional Linguistics, Seattle, Wash-ington, USA, pages 1741–1752. http://www. aclweb.org/anthology/D13-1180.
Ronan Cummins, Helen Yannakoudakis, and Ted Briscoe. 2016a. Unsupervised modeling of topical relevance in l2 learner text. In Proceedings of the 11th Workshop on Innovative Use of NLP for Build-ing Educational Applications. pages 95–104.
[image:9.595.71.292.249.350.2]Janez Demˇsar. 2006. Statistical comparisons of clas-sifiers over multiple data sets. Journal of Machine learning research7(Jan):1–30.
Fei Dong and Yue Zhang. 2016. Automatic fea-tures for essay scoring – an empirical study. In
Proceedings of the 2016 Conference on Empiri-cal Methods in Natural Language Processing. As-sociation for Computational Linguistics, Austin, Texas, pages 1072–1077. https://aclweb. org/anthology/D16-1115.
Youmna Farag, Marek Rei, and Ted Briscoe. 2017.
An error-oriented approach to word embedding pre-training. In Proceedings of the 12th Work-shop on Innovative Use of NLP for Building Educational Applications. Association for Com-putational Linguistics, Copenhagen, Denmark,
pages 149–158. http://www.aclweb.org/
anthology/W17-5016.
Adriano Ferraresi, Eros Zanchetta, Marco Baroni, and Silvia Bernardini. 2008. Introducing and evaluating ukwac, a very large web-derived corpus of english. InProceedings of the 4th Web as Corpus Workshop (WAC-4) Can we beat Google. pages 47–54.
Derrick Higgins, Jill Burstein, Daniel Marcu, and Clau-dia Gentile. 2004. Evaluating multiple aspects of coherence in student essays. InHLT-NAACL. pages 185–192.
J Richard Landis and Gary G Koch. 1977. The mea-surement of observer agreement for categorical data.
biometricspages 159–174.
Leah S Larkey. 1998. Automatic essay grading using text categorization techniques. InProceedings of the 21st annual international ACM SIGIR conference on Research and development in information retrieval. ACM, pages 90–95.
Diane Nicholls. 2003. The cambridge learner corpus: Error coding and analysis for lexicography and elt. InProceedings of the Corpus Linguistics 2003 con-ference. volume 16, pages 572–581.
Ellis Batten Page. 2003. Project essay grade: Peg.
Automated essay scoring: A cross-disciplinary per-spectivepages 43–54.
Peter Phandi, Kian Ming A. Chai, and Hwee Tou Ng. 2015. Flexible domain adaptation for automated es-say scoring using correlated linear regression. In
Proceedings of the 2015 Conference on Empirical Methods in Natural Language Processing. Associ-ation for ComputAssoci-ational Linguistics, Lisbon, Por-tugal, pages 431–439. http://aclweb.org/ anthology/D15-1049.
Lawrence M Rudner and Tahung Liang. 2002. Au-tomated essay scoring using bayes’ theorem. The Journal of Technology, Learning and Assessment
1(2).
Swapna Somasundaran, Jill Burstein, and Martin Chodorow. 2014. Lexical chaining for measur-ing discourse coherence quality in test-taker essays. In Proceedings of COLING 2014, the 25th Inter-national Conference on Computational Linguistics: Technical Papers. Dublin City University and Asso-ciation for Computational Linguistics, Dublin, Ire-land, pages 950–961. http://www.aclweb. org/anthology/C14-1090.
Kaveh Taghipour and Hwee Tou Ng. 2016. A neural approach to automated essay scoring. In
Proceedings of the 2016 Conference on Empiri-cal Methods in Natural Language Processing. As-sociation for Computational Linguistics, Austin, Texas, pages 1882–1891. https://aclweb. org/anthology/D16-1193.
Frank Wilcoxon. 1945. Individual comparisons by ranking methods.Biometrics bulletin1(6):80–83.
Helen Yannakoudakis and Ted Briscoe. 2012. Model-ing coherence in esol learner texts. InProceedings of the Seventh Workshop on Building Educational Applications Using NLP. Association for Compu-tational Linguistics, Montr´eal, Canada, pages 33– 43.http://www.aclweb.org/anthology/ W12-2004.
Helen Yannakoudakis, Ted Briscoe, and Ben Medlock. 2011. A new dataset and method for automatically grading esol texts. InProceedings of the 49th An-nual Meeting of the Association for Computational Linguistics: Human Language Technologies. As-sociation for Computational Linguistics, Portland, Oregon, USA, pages 180–189. http://www. aclweb.org/anthology/P11-1019.