Original Article
Higher positive end expiratory pressure guided by upper
inflection point of pressure volume curve ameliorating
respiratory function in acute respiratory
distress syndrome pig models
Kui Ge1*, Wenjie Li4*, Bing Xu1, Hu Peng1, Jiajun Wu2, Qixing Wang2, Hui Pan3, Yugang Zhuang3, Xiangyu Zhang2, Chengjin Gao4
1Department of Emergency, Shanghai 9th People’s Hospital, School of Medicine, Shanghai Jiaotong University,
Shanghai 200011, China; 2Intensive Care Unit, Shanghai Tenth People’s Hospital, School of Medicine, Tongji
University, Shanghai 200072, China; 3Department of Emergency, Shanghai Tenth People’s Hospital, School of
Medicine, Tongji University, Shanghai 200072, China; 4Department of Emergency, Xinhua Hospital Affiliated to
Shanghai Jiao Tong University School of Medicine, Shanghai 200092, China. *Equal contributors.
Received October 22, 2015; Accepted January 16, 2016; Epub February 15, 2016; Published February 29, 2016
Abstract: Background: No optimal positive end expiratory pressure (PEEP) threshold has been established. Methods: Twenty-two healthy pigs were induced to ARDS models and were randomly divided into four groups according to
in-flection points: PLIP + 2 (5), P(LIP + UIP)/2 (6), PEIP (6) and PUIP-5 (5). Parameters of extra-vascular lung water, gas exchange, hemodynamic parameters and respiratory mechanics were measured in the groups of different time point.Results: Values of PLIP + 2, (PLIP + PUIP)/2, PEIP and PUIP-5 were 9.1 ± 0.6 cmH2O, 15.6 ± 1.1 cmH2O, 17.8 ± 0.7 cmH2O and 19.3 ± 1.8 cmH2O respectively. Value of EVLW decrease with time significantly in group PEIP and PUIP-5. PaO2 and oxygenation index (PaO2/FiO2) increased significantly in the group of (PLIP + PUIP)/2, PEIP and PUIP-5 in 2 hours after PEEP use. The increase in SaO2 reached significance in group PEIP. The effect of different PEEP on PaCO2 was not significant. After
PEEP was given, mean arterial pressure (MAP) and cardiac output (CO) were decreased, while the central venous
pressure (CVP) was increased significantly in groups of PEIP and PUIP-5 in comparison with baseline. The change in plat airway pressure (Pplat) in group PEIP and PUIP-5, static lung compliance (Cst)in group PEIP reached significance in
2 hours after PEEP use. Conclusions: Higher PEEP could help obtain better oxygenation, improve pulmonary compli-ance and lung ventilation in ARDS pigs. PEEP guided by UIP of PV curve may be the optimal PEEP.
Keywords: PEEP, acute respiratory distress syndrome (ARDS), pressure volume (PV) curve, upper inflection point
(UIP)
Introduction
Reduction of the tidal volume, and thus of the stress applied to the lungs, can protect the lungs from over inflation and unambiguously reduce acute respiratory distress syndrome (ARDS) mortality in a large multicenter random-ized trial [1]. However, cyclic alveolar closure caused by small tidal volume (VT) may induce low efficiency of ventilation [2]. Therefore, a suitable positive end expiratory pressure (PEEP) to optimally balance recruitment and distention in each patient is necessary.
It is reported that proper PEEP can be deter-mined by identifying pressure volume (PV)
curve inflection points [3]. The lower inflection point (LIP) of the inflation limb has been shown to be the point of massive alveolar recruitment and therefore an option for setting PEEP [4]. But it is still under debate. Those much higher PEEP than LIP can still recruit lung [5] and in practice some patients need much higher PEEP to maintain saturation of oxygen [6], which manifests that PEEP deduced from LIP may be not optimal.
Methods
Animal preparation
Twenty-two healthy domestic pigs weighing 21 to 29 kg were enrolled in this study and were fed by professional staffs in the animal room. Prior to instrumentation, animals were pre-medicated with intramuscular sodium pento-barbital (30 mg) and maintained with sodium pentobarbital (2 mg·kg-1·h-1) and pancuronium bromide (0.1 mg·kg-1). Then they were placed supine on a heating pad to maintain the core temperature at 38°C [7].
Venous access was then established and secured in a jugular vein. To ensure adequate hydration, 500 mL of lactated Ringer’s solution was infused rapidly followed by an infusion rate of 5 ml·kg-1·h-1 throughout the experiment. Animals were monitored with continuous elec-trocardiography and oximetry on multichannel monitors (IntelliVue MP20, M8001A, Philips Medizin Systeme Boblingen, Germany).
All animal-related procedures were approved by the Animal Care and Use Committee of The Tenth People’s Hospital of Shanghai (permit
number: 2011-RES1). This study was also approved by the Science and Technology Commission of Shanghai Municipality (ID: SYXK 2007- 0006).
Surgical procedures and ven-tilation
[image:2.612.92.375.77.351.2]The animals were tracheoto-mized, intubated with a 7.5 mm internal diameter cuffed tracheal tube, and ventilated (Servo 900, Siemens, Berlin, Germany) in a volume-con-trolled ventilation mode with a PEEP of 5 cmH2O, an inspi-ratory/expiratory ratio of 1:2, and inspired O2 fraction (FiO2) of 0.4, a respiratory rate of 25 breaths per minute and tidal volume of 10 ml·kg-1 to main-tain arterial partial pressure of CO2 (PaCO2) between 35 to 40 mmHg before HCl administration.
Figure 1. PV scatter plot was obtained using super-syringe and PV curve
es-tablished, and inflection points were estimated by observing.
A 5 F catheter (PVPK2015L20, PULSIOCATH, Pulsion Medical Systems, Feldkirchen, Ger- many) was inserted into the right femoral artery for thermodilution measurements and pulse contour analysis and connected to the pulse index continuous cardiac output (PiCCO) plus hemodynamic monitor (PC8100, Pulsion Medical Systems). Blood samples were collect-ed, extravascular lung water (EVLW), intratho-racic blood volume (ITBV) and global end dia-stolic volume (GEDV) was measured.
ARDS model establishment and experimental design
Initial lung injury was induced by instillation of 0.3 N HCl as a bolus through a feeding tube connected to the end of the tracheal tube. HCl was administered to each side (1.5 ml·kg-1) serially with the animal placed on one lateral side followed by the other (60 seconds each side). Arterial blood gases were monitored, and stable ARDS models were established when PaO2/FiO2 < 150 mmHg, maintaining 30 min-utes [8].
ventilator and connected to a specifically designed super-syringe at the end of a 3-s expi-ration. A 3-L syringe (Model Series 5540; Hans Rudolph) was used for insufflating the lungs with pure O2 in 50-ml steps until a volume cor-responding to a plateau pressure of 35 cmH2O was reached. Intervals between two steps last-ed 3 s [9]. PV scatter plot was obtainlast-ed using super-syringe and PV curve established, and inflection points were estimated by observing.
Twenty-two pigs were randomly divided into four groups: PLIP + 2 (5), P(LIP + UIP)/2 (6), PEIP (6) and PUIP-5 (5) (UIP: upper inflection point; EIP: expira -tory inflection point), and given protective mechanical ventilation with VT of 6 ml·kg-1, pla-teau pressure ≤ 30 cmH2O, an inspiratory/ expiratory ratio of 1:2, and FiO2 of 0.4, a respi-ratory rate of 25 breaths per minute, PEEP of (LIP + 2), (LIP + UIP)/2, EIP and (UIP-5) cmH2O respectively.
Statistical analyses
All quantitative data were shown as mean ± standard deviation (SD), as the data proved to be normally distributed. Data was analyzed by one-way analysis of variance (ANOVA). All analy-ses were performed using SPSS 15.0 (SPSS, Inc., Chicago, IL, USA) and differences were considered statistically significant at a proba -bility level of less than 0.05 (P < 0.05).
Results
Mean (SD) animal weight was 22.3 (2.1) kg. Haemoglobin concentration was 103 ± 8 g/L. There were no significant differences between the mea-sured parameters at baseline before and after ARDS model establishment during the ran-domized protocol.
PV scatter plots and PV curve
[image:3.612.91.377.84.307.2]Values of (PLIP, VLIP), (PUIP, VUIP), (PEIP, VEIP) were (7.3 ± 0.7 cmH2O, 97.3 ± 18.7 ml), (24.7 ± 0.9 cmH2O, 484.3 ± 94.8 ml), (17.8 ± 0.7 cmH2O, 483.4 ± 72.9 ml) respectively. Values of (PLIP + 2), (PLIP + PUIP)/2 and (PUIP-5) were calculated, and were 9.1 ± 0.6 cmH2O, 15.6 ± 1.1 cmH2O, and 19.3.
Table 1. Effect of PEEP on EVLW in pigs with ARDS (mean ± SD)
Group Time dot n EVLW (ml·kg-1) ITBV (Pml) GEDV (Pml)
PLIP + 2 0 h 5 16.6 ± 3.2 1031.8 ± 425.1 831.9 ± 343.1
1 h 15.5 ± 4.7 1043.9 ± 365.0 841.8 ± 293.8
2 h 14.9 ± 1.4 974.1 ± 345.6 786.0 ± 286.7
(PLIP + PUIP)/2
(PLIP + PUIP)/2 0 h 6 15.8 ± 2.5 963.1 ± 254.2 798.4 ± 189.3
1 h 14.7 ± 4.5 843.3 ± 237.4 677.3 ± 171.5
2 h 12.7 ± 2.2* 803.6 ± 205.1 648.2 ± 165.1
PEIP
PEIP 0 h 6 17.3 ± 1.6 1034.8 ± 466.3 838.0 ± 380.1
1 h 15.1 ± 1.7* 911.4 ± 335.5 741.5 ± 265.1
2 h 12.9 ± 1.5*,# 969.3 ± 401.8 781.7 ± 323.7
PUIP-5
PUIP-5 0 h 5 18.4 ± 2.4 934.3 ± 346.3 827.0 ± 132.1
1 h 14.7 ± 2.5* 971.4 ± 432.4 785.5 ± 136.4
2 h 14.1 ± 2.8* 939.1 ± 301.4 731.9 ± 253.3
*P < 0.05, compared with 0 h of same group; #P < 0.05. Compared with P
LIP + 2 group
at the same time point.
± 1.8 cmH2O respectively, and were increased gradually from the first to the last (Figure 1).
Effect of different PEEP on EVLW
Value of EVLW tended to decrease along with PEEP increasing. And the decrease with time was significant in group PEIP and PUIP-5 (P < 0.05). There was no increase of EVLW in any time dot. No obvious changes of ITBV and GEDV were observed, when higher PEEP was used (P > 0.05, Table 1).
Effect of different PEEP on gas exchange
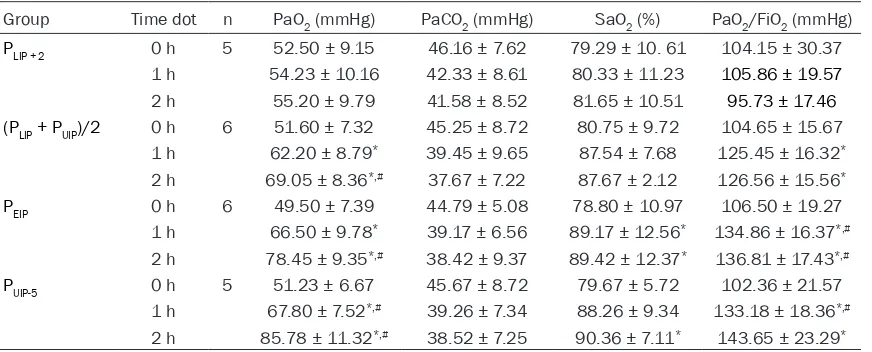
PaO2 and oxygenation index (PaO2/FiO2) increased significantly in the group of (PLIP + PUIP)/2, PEIP and PUIP-5 in 2 hours after PEEP use (P < 0.05). SaO2 had a tendency to increase, and reached significance in group PEIP, when PEEP value was increased (P < 0.05). But the effect of different PEEP on PaCO2 was not sig-nificant (P > 0.05) (Table 2).
Effect of different PEEP on hemodynamic pa-rameters
sig-nificantly in groups of PEIP and PUIP-5 in compari-son with baseline (P < 0.05). In groups of (PLIP + PUIP)/2 and PUIP-5, decreases were corrected fluids and inotropic agents (Table 3).
Effect of different PEEP on respiratory me-chanics
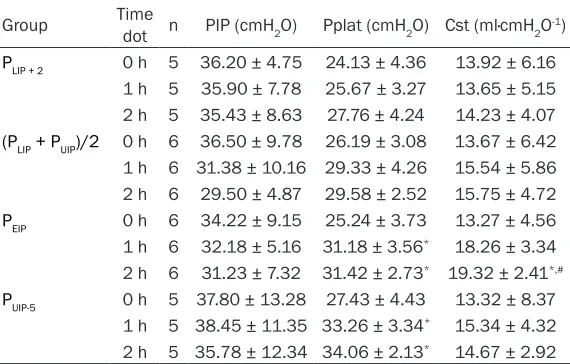
Baseline peak airway pressure (PIP), plat air-way pressure (Pplat) and static lung compli-ance (Cst) showed no significant difference (P > 0.05). After PEEP was given, PIP, Pplat and Cst tented to increase in comparison with base-line, but only the change in Pplat in group PEIP and PUIP-5, Cstin group PEIP reached significance in 2 hours after PEEP use (P < 0.05, Table 4). Discussion
In the present study, the upper inflection point of the deflation limb of the PV curve appeared to represent the point of optimal PEEP, with decreased EVLW, better condition of gas exchange, hemodynamic parameters and respi-ratory mechanics with time.
Many critically ill patients require and benefit from invasive mechanical ventilation because of acute lung injury (ALI) and ARDS, secondary injury occurring as well [10]. The secondary injury resulted from mechanical ventilation is attributable largely to two mechanical stresses: excessive lung distention at peak inspiration, and repetitive opening and closure of lung units [2]. The injury attributable to over-distention can be minimized by reducing VT and limiting plateau pressure [1]. The second source of
[image:4.612.91.527.84.260.2]inju-ry may be minimized by interventions that recruit the lungs to prevent cyclic alveolar clo-sure, such as PEEP and alternative ventilation modes such as high-frequency oscillation [11]. The optimal low tidal volume (not above 6 ml/ kg) has been achieved agreement, but the best way to set PEEP, to optimally balance recruit-ment and distention in each patient, remains elusive. In patients with ARDS, LIP has been shown to be the point of massive alveolar recruitment and therefore an option for setting PEEP. It has been suggested that setting PEEP above the LIP may be beneficial, and a random -ized trial of a modified ventilatory strategy incorporating this approach as well as permis-sive hypercapnia showed a reduced mortality rate and reduced barotrauma. However, it is sometimes difficult to measure PV curve at the bedside in ventilated patients, so the preven-tion of end expiratory collapse with PEEP can-not easily be determined. Furthermore, the LIP is affected by superimposed pressure and threshold opening pressure, and do not accu-rately indicate PEEP required to prevent end expiratory collapse [5]. Although the PV curve has been used to individualize setting proper PEEP in patients with ARDS, the physiologic interpretation of the curve remains under debate [12]. Those facts that re-inflation of col -lapsed lung units continuing on the linear por-tion of the PV curve and lung recruitment hap-pening far above the LIP remind that LIP is not the end of recruitment of lung, and accordingly, the PEEP guided by LIP has been challenged [13].
Table 2. Effect of PEEP on gas exchanges in pigs with ARDS (mean ± SD)
Group Time dot n PaO2 (mmHg) PaCO2 (mmHg) SaO2 (%) PaO2/FiO2 (mmHg)
PLIP + 2 0 h 5 52.50 ± 9.15 46.16 ± 7.62 79.29 ± 10. 61 104.15 ± 30.37
1 h 54.23 ± 10.16 42.33 ± 8.61 80.33 ± 11.23 105.86 ± 19.57
2 h 55.20 ± 9.79 41.58 ± 8.52 81.65 ± 10.51 95.73 ± 17.46
(PLIP + PUIP)/2 0 h 6 51.60 ± 7.32 45.25 ± 8.72 80.75 ± 9.72 104.65 ± 15.67
1 h 62.20 ± 8.79* 39.45 ± 9.65 87.54 ± 7.68 125.45 ± 16.32*
2 h 69.05 ± 8.36*,# 37.67 ± 7.22 87.67 ± 2.12 126.56 ± 15.56*
PEIP 0 h 6 49.50 ± 7.39 44.79 ± 5.08 78.80 ± 10.97 106.50 ± 19.27
1 h 66.50 ± 9.78* 39.17 ± 6.56 89.17 ± 12.56* 134.86 ± 16.37*,#
2 h 78.45 ± 9.35*,# 38.42 ± 9.37 89.42 ± 12.37* 136.81 ± 17.43*,#
PUIP-5 0 h 5 51.23 ± 6.67 45.67 ± 8.72 79.67 ± 5.72 102.36 ± 21.57
1 h 67.80 ± 7.52*,# 39.26 ± 7.34 88.26 ± 9.34 133.18 ± 18.36*,#
2 h 85.78 ± 11.32*,# 38.52 ± 7.25 90.36 ± 7.11* 143.65 ± 23.29*
*P < 0.05, compared with 0 h of same group; #P < 0.05. Compared with P
UIP is conventionally hypothesized to represent initial alveolar over-distension, and is utilized to set an upper limitation during mechanical ven-tilation in patients with ARDS. Nonetheless nowadays, it is becoming widely accepted that the UIP of the deflation limb of the PV curve rep -resents the point of optimal PEEP [3]. In the present study, our aim is to compare different PEEP value between the different inflection points of the PV curve in ARDS pigs, and to assess the range of PEEP, and to study the effect of different PEEP on respiratory function following its use.
In the present study, values of PEEP from PLIP + 2 to P(LIP + UIP)/2, PEIP and PUIP-5 cmH2O increased gradually. Accom- panying with PEEP increase, pressure of airway, compli-ance of lung and oxygenation index increased, but EVLW not increased. And pigs treat-ed with higher level PEEP had better respiratory functions than those lower’s, the high-er, the better. In PLIP + 2 group, oxygenation index decreased, although, has no signifi -cance, when ventilation con-tinued without recruitment. But in the other three groups, higher PEEP values can main-tain oxygenation index. It may be partially due to higher PEEP value may allow gradu-al recruitment of lung units, without the need for exces-sive increase in airway pres-sures [14].
In the study, the hemody-namic effects of increased airway pressure were man-aged with fluids and inotropic agents, when necessary, and did not limit the application of PEEP to reach the defined end point of treatment. Conclusion
[image:5.612.91.381.98.279.2]PEEP deduced from UIP of PV curve is higher than those from LIP. The upper inflection point of the deflation limb of the PV curve represents the
Table 3. Effect of PEEP on hemodynamic parameters in pigs with ARDS (mean ± SD)
Group Time dot n MAP (mmHg) CVP (mmHg) CO (L·min-1)
PLIP + 2 0 h 5 99.60 ± 9.72 5.10 ± 0.62 4.81 ± 0.43
1 h 86.50 ± 9.88 5.33 ± 0.61 4.65 ± 0.56
2 h 85.20 ± 9.72 5.58 ± 0.52 3.86 ± 0.46
(PLIP + PUIP)/2 0 h 6 92.90 ± 9.56 6.75 ± 1.72 4.65 ± 0.67
1 h 87.50 ± 7.27 7.54 ± 1.68# 3.86 ± 0.57#
2 h 83.50 ± 9.88 7.67 ± 2.12 3.85 ± 0.37*
PEIP 0 h 6 97.50 ± 7.23 5.80 ± 0.97 4.76 ± 0.47
1 h 78.40 ± 9.67* 9.17 ± 2.56*,# 4.05 ± 0.27*
2 h 86.50 ± 8.25* 9.42 ± 2.37*,# 3.89 ± 0.57*
PUIP-5 0 h 5 94.03 ± 8.42 5.67 ± 1.72 4.86 ± 0.37
1 h 77.80 ± 5.55* 13.26 ± 2.34*,# 3.18 ± 0.36*,#
2 h 81.26 ± 6.80* 14.06 ± 2.11*,# 3.65 ± 0.29*
*P < 0.05, compared with 0 h of same group; #P < 0.05. Compared with P
LIP + 2 group
at the same time point.
Table 4. Effect of PEEP on pulmonary mechanics in pigs with ARDS (mean ± SD)
Group Time dot n PIP (cmH2O) Pplat (cmH2O) Cst (ml·cmH2O-1)
PLIP + 2 0 h 5 36.20 ± 4.75 24.13 ± 4.36 13.92 ± 6.16
1 h 5 35.90 ± 7.78 25.67 ± 3.27 13.65 ± 5.15
2 h 5 35.43 ± 8.63 27.76 ± 4.24 14.23 ± 4.07
(PLIP + PUIP)/2 0 h 6 36.50 ± 9.78 26.19 ± 3.08 13.67 ± 6.42
1 h 6 31.38 ± 10.16 29.33 ± 4.26 15.54 ± 5.86
2 h 6 29.50 ± 4.87 29.58 ± 2.52 15.75 ± 4.72
PEIP 0 h 6 34.22 ± 9.15 25.24 ± 3.73 13.27 ± 4.56
1 h 6 32.18 ± 5.16 31.18 ± 3.56* 18.26 ± 3.34
2 h 6 31.23 ± 7.32 31.42 ± 2.73* 19.32 ± 2.41*,#
PUIP-5 0 h 5 37.80 ± 13.28 27.43 ± 4.43 13.32 ± 8.37
1 h 5 38.45 ± 11.35 33.26 ± 3.34* 15.34 ± 4.32
2 h 5 35.78 ± 12.34 34.06 ± 2.13* 14.67 ± 2.92
*P < 0.05, compared with 0 h of same group; #P < 0.05. Compared with P
LIP + 2 group
at the same time point.
point of optimal PEEP. Suitable higher PEEP (EIP or UIP-5, etc.) does not exacerbate respira-tory function, but will bring convenience to set PEEP at the bedside. However, we should remember that accompanying with ARDS advancing, the parameter should be reset as the lung injury evolves.
Acknowledgements
[image:5.612.92.377.352.534.2]Disclosure of conflict of interest
None.
Address correspondence to: Chengjin Gao, De-
partment of Emergency, Xinhua Hospital Affiliated
to Shanghai Jiao Tong University School of Medi- cine, No. 1665, Kongjiang Road, Shanghai, China. Tel: (0086) 15801985172; E-mail: chengjin-gao2003@126.com; Xiangyu Zhang, Intensive Care Unit, Shanghai Tenth People’s Hospital, School of Medicine, Tongji University, No. 301 of middle Yanchang Road, Shanghai 200072, China. Tel: (0086) 15801985172; E-mail: xiangyu62@126. com
References
[1] Ventilation with lower tidal volumes as com-pared with traditional tidal volumes for acute lung injury and the acute respiratory distress syndrome. The Acute Respiratory Distress Syndrome Network. N Engl J Med 2000; 342: 1301-8.
[2] Hess DR. Approaches to conventional mechan-ical ventilation of the patient with acute respi-ratory distress syndrome. Respir Care 2011; 56: 1555-72.
[3] LaFollette R, Hojnowski K, Norton J, DiRocco J, Carney D, Nieman G. Using pressure-volume curves to set proper PEEP in acute lung injury. Nurs Crit Care 2007; 12: 231-41.
[4] Schiller HJ, Steinberg J, Halter J, McCann U, DaSilva M, Gatto LA, Carney D, Nieman G.
Alveolar inflation during generation of a
quasi-static pressure/volume curve in the acutely injured lung. Crit Care Med 2003; 31: 1126-33.
[5] Hickling KG. The pressure-volume curve is
greatly modified by recruitment. A mathemati -cal model of ARDS lungs. Am J Respir Crit Care Med 1998; 158: 194-202.
[6] Medoff BD, Harris RS, Kesselman H, Venegas J, Amato MB, Hess D. Use of recruitment ma-neuvers and high-positive end-expiratory pres-sure in a patient with acute respiratory distress syndrome. Crit Care Med 2000; 28: 1210-6.
[7] Li X, Liu Y, Wang Q, Zhu Y, Lv X, Liu J. A novel and stable “two-hit” acute lung injury model induced by oleic acid in piglets. Acta Vet Scand 2009; 51: 17.
[8] Zhu YB, Ling F, Zhang YB, Liu AJ, Liu DH, Qiao CH, Wang Q, Liu YL. A novel, stable and repro-ducible acute lung injury model induced by oleic acid in immature piglet. Chin Med J (Engl) 2011; 124: 4149-54.
[9] Lu Q, Vieira SR, Richecoeur J, Puybasset L, Kalfon P, Coriat P, Rouby JJ. A simple automat-ed method for measuring pressure-volume curves during mechanical ventilation. Am J Respir Crit Care Med 1999; 159: 275-82. [10] Chang SY, Dabbagh O, Gajic O, Patrawalla A,
Elie MC, Talmor DS, Malhotra A, Adesanya A, Anderson HL 3rd, Blum JM, Park PK, Gong MN; United States Critical Illness and Injury Trials Group: Lung Injury Prevention Study Investigators (USCIITG-LIPS). Contemporary ventilator management in patients with and at risk of ALI/ARDS. Respir Care 2013; 58: 577-88.
[11] Guerin C. The preventive role of higher PEEP in treating severely hypoxemic ARDS. Minerva Anestesiol 2011; 77: 835-45.
[12] Servillo G, De Robertis E, Maggiore S, Lemaire
F, Brochard L, Tufano R. The upper inflection point of the pressure-volume curve. Influence
of methodology and of different modes of ven-tilation. Intensive Care Med 2002; 28: 842-9. [13] Wiedermann FJ, Schlimp CJ. Adherence to lung
protective ventilation strategies in acute respi-ratory distress syndrome. Eur J Anaesthesiol 2004; 21: 574-5.