1
Journal of the Statistical and Social Inquiry Society of Ireland Vol. XXX
MEASURING THE ECONOMY – PROBLEMS AND PROSPECTS WILLIAM KEATING
Central Statistics Office
(Read before the Society, 26 October 2000)
________________________________________________________ Abstract: This paper discusses the statistical measurement of economic growth and examines some issues arising in that context. It looks at the treatment of productivity and quality improvements, especially as regards non-market services. Measurement issues arising from globalisation are also identified and the impact of foreign direct investment enterprises on the main aggregates is examined. Finally, the wider question of economic well-being is discussed and examples are given of development work in this regard in other countries.
____________________________________________________________________ Keywords: Economic Growth, Measurement, Foreign Direct Investment.
JEL Classifications:O400, O470.
1. INTRODUCTION Topic of growth
In considering a topic for this presidential address, it seemed appropriate to deal with various aspects of the measurement of growth in the Irish economy. In this session, it is the Council’s aim to have a number of meetings devoted to issues surrounding the strong growth in the Irish economy in recent years. From my own perspective, I have been involved, in one way or another, in the production of some of the relevant statistical data for over twenty years. Over that period, the growth rate of the Irish economy has been the subject of considerable interest for a variety of reasons. The 1980s and 1990s saw wide variations in growth rates. Between 1980 and 1987, GDP increased by an average of about 2 percent per annum but this accelerated to an average of 6 percent in the three years from 1988 through to 1990. The early 1990s again showed relatively slow growth rates (an average of just over 2.5 percent between 1990 and 1993) but then economic growth really took off with an increase of 5.8 percent in 1994 and annual increases of more than 7 percent each year since then.
from demographic as well as economic factors, gave rise to talk of “jobless growth” and some questioning of the reliability of the growth figures.
Attention has now turned to other aspects. In recent years, of course, attention has centred on the phenomenal pace of GDP growth and on the prospects for its continuation. There has been little, if any, questioning of the validity of the measurement of this growth in the second half of the 1990s, mainly because its effects are readily seen in the surge in employment and in exchequer returns that continue to exceed expectations. There are also less welcome but equally obvious manifestations such as traffic problems and soaring house prices.
Wider concerns
The major concern now is probably that the benefits of strong growth are not being spread evenly enough through society. This has led to a focus on wider concerns such as income distribution and poverty levels. In relation to measurement, there are a number of criticisms. These include the view that the traditional GDP measure is too narrowly focussed especially from what might in general terms be called the “quality of life” perspective.
In this paper an attempt is made to show what exactly is meant in statistical terms by economic growth and then to discuss some of the major issues which are arising in connection with its measurement. The increase in GDP levels during the 1990s is examined to show the impact of structural changes, in particular. The possibilities for developing measures of economic well being and providing other supplementary indicators are then discussed. Other related issues, especially those arising from the impact of EU arrangements, are also raised.
2. THE STATISTICAL MEASUREMENT OF GROWTH Different Measures
The measurement of growth is concentrated on changes in the two main macro-economic aggregates produced traditionally, these are Gross Domestic Product (GDP) and Gross National Product (GNP). These are compiled on both a value (current prices) and volume (constant prices) basis with the latter being the basis for deriving growth rates. Broadly speaking, GDP measures total value added in the economy in a given time period through the production of goods and services and GNP measures the total income accruing to the permanent residents of the country. There are three main conceptual approaches to measuring value added:
3
•
Expenditure, for which the various elements of demand such as personal consumption and exports are combined and imports of goods and services are then deducted;•
Output, where value-added estimates for each branch of economic activity are combined.In Ireland we use two of these measures to estimate the value of GDP and GNP in current price terms. These are the Income and Expenditure measures. The production of an Output estimate is a long-term aim that is now more realistic than it was in the past due to greater sectoral coverage of the Central Statistical Office (CSO) annual business surveys. Ideally all three measures should give the same answer. Of course, they never do because they are based on different data sources, incorporate different estimation procedures and are all subject to timing differences. In some respects the title “National Accounts” is a misnomer. It gives the impression that every transaction in the economy can be measured exactly and fitted into the overall framework. This is not the situation; we rely on a wide range of sources for our estimates and these give varying levels of precision.
Because of the need to fix on a single GDP estimate, the Income measure was, until 1999, taken as this definitive measure and the Personal Consumption element of the Expenditure estimate was adjusted to ensure agreement between Income and Expenditure. In practice, this adjustment was consistently downwards as the expenditure measure always exceeded the income measure. That was not surprising, as the statistical system is more likely to capture consumption expenditure whereas the corresponding outputs and income may be more difficult to identify. In Ireland’s case, the greatest concern from the measurement perspective with regard to the expenditure estimate is the dominance of external trade. Exports and imports of goods and services taken together accounted for more than 160 percent of GDP in 1999 and so even minor inaccuracies in these flows will have a significant effect on GDP levels.
Measurement Improvements in 1990s
Throughout the 1990s, CSO had undertaken a series of developments and improvements to the current price estimates as part of the process of complying with EU requirements1 applying to all member states. These arose from the need to harmonise the measurement of GNP throughout the EU because it is used as the basis for member states’ contributions to the budget. Following the completion of these improvements, it was no longer defensible to regard one of the two measures as superior. In 1999 CSO changed to using the average of the two measures as the definitive estimate in a situation where expenditure still consistently exceeded income but generally within acceptable limits (about 1-2 per cent of GDP).
work on the measurement of the financial services sector and of the International Financial Services Centre (IFSC) in particular. These took on board the results of an extensive development programme for Balance of Payments (BOP) statistics, first results of which were also issued earlier this year. This programme included extensive surveys of entities operating at the IFSC. Estimates had, of course, always been made to incorporate the financial sector in the accounts and the new data had a relatively modest effect on GDP and GNP levels, generally increasing them by less than one per cent.
The situation with regard to the gap between the income and expenditure measures has improved. It was quite small in 1999 and its direction was reversed for 1998. However, this did not arise from the work on the financial sector. In fact, the increases on the expenditure side from this exercise exceeded those on the income side and this generally tended to widen the gap. Too much should not be made of the improvement with regard to the gap at this stage because it has occurred for the years still subject to most revision as additional data comes on stream.
Output Based Measurement of Growth
The growth rate, as it is usually understood, is the change in value added at constant prices, that is with changes due to price effects removed. To estimate this aggregate, two approaches are also used by CSO. In this case the measures used are Output and Expenditure based. The Output estimate is measured by starting with the detailed sectoral components of value added in a base year. The base year is changed at intervals, five yearly at present. However, the international consensus is moving towards chain-linked indices; these involve changing base years annually. The best method of taking these base year value added estimates forward to later years is to use the double deflation method2, that is to value the inputs and outputs of each sector separately at the prices of the base year. The difference between these two values provides an estimate of value added at constant prices for the sector in question. In practice, this method is used only to a limited extent in most countries mainly because the required data are not available, especially in the short-term. In Ireland, it is used annually for measuring change in Agriculture and Rents but not for any other sector.
In practice, the value added estimates for the different sectors are taken forward in a variety of ways. The principal methods used are:
• Deflated turnover/output • Outputs in physical values
• Inputs (usually labour inputs)
5
double deflation in providing estimates of change in value added at constant prices. However, the validity of these methods does rely on the assumption that the ratio of inputs to outputs in a given sector remains constant and that the trends in output and input prices for that sector are similar over the time period in question. To the extent that these conditions are not met, the result is not as good as would be obtained using the double deflation methodology.
Productivity and Quality Improvements
In most cases these two assumptions are in fact reasonable, especially for short time periods. The major exception is probably the Information Technology (IT) sector and this, of course, is of particular importance to Ireland. The method used to-date in Ireland for the relevant manufacturing sectors has been to use deflated values of production. Deflation has involved using price trends which reflected, in particular, the effect of the US$ exchange rate on IR£ valuations of output. The main problem is that these price trends have not fully reflected the enormous growth in the power of computers that has arisen in tandem with falling prices.
This increased quality should, in theory, be regarded as increased volume of production. A number of countries are now using hedonic price indices that take into account the various quality improvements. As a result they have rapidly falling price indices. If these were used simply to deflate turnover, a much-increased volume of output would result. This is a situation where the double deflation approach would seem to be appropriate, as the improvements in quality will, in many cases, be an integral part of the inputs. There will then be substantial increases shown in both the volume of outputs and volume of inputs; the value added at constant prices will be the difference between these two levels.
The CSO is participating in international discussions on this issue. It is clear that collection of the data required to compile hedonic indices would be a major task. It may well be that there will be a unified EU approach to compiling the relevant indices or that, in common with the current practice of a number of other countries, we will use the US indices, adjusted for exchange rate movements. These should be suitable for use in the Irish situation given the predominance of US enterprises in the IT sector here.
inflation. This is not an issue I propose to pursue in this paper but suffice to say price statisticians have put forward robust defences of their methodologies.
Use of Inputs
The sectors where the greatest changes in constant price methodology must be introduced in the short-term are those where value added is extrapolated using inputs. The principal examples would be in the non-market services area in fields such as education and health. Currently an index of employment is widely used as a proxy for output for these sectors. This is a convention arising mainly from the fact that by definition there are no prices available. Unless an explicit adjustment is made for productivity in such instances, as some countries already do, then there will be no allowance for volume increases arising from inputs other than labour. Increases in quality should be included as increases in volume. Legislation at EU level aimed at ensuring harmonised measurement of growth in the context of the Stability and Growth Pact will make it mandatory to use output indicators in the case of these sectors. This follows on from the recommendation in SNA93 that “In principle, volume indices may always be compiled directly by calculating a weighted average of the quantity relatives for the various goods and services produced as outputs using the value of these goods and services as weights”.
Improved Approach
What types of approaches are now being envisaged? Essentially, an output indicator that will either incorporate quality change or be adjusted for quality change will be used. For example, in the education sector, the direct output indicator might be numbers of pupils while the quality change might be based on examination results. However, changes in results due to factors other than the quality of educational services provided should not be counted as an output of the education sector. In the Health sector, output data for different types of treatments would appear to be the best primary data; again the question of quality would be very difficult to incorporate.
An example of work in this area is the development of output measures for the health services by the Australian Bureau of Statistics (ABS). The proposed index is compiled as follows:
•
Estimating output volumes for public acute hospitals and private hospitals by applying cost weights to case mix data;•
Using cost-weighted patient days for psychiatric hospitals and nursing homes;•
Estimating output volume for medical services based on number of attendancesweighted by average fees.
•
Continuing to deflate input costs for the remainder of the health services.7
measures capture quality change insofar as a change in the mix of cases represents quality change; however, the ABS say that it could be failing to detect some quality change within Diagnosis-Related Groups.
Clearly, there will be many problems in arriving at workable solutions in the Irish context but the current reliance on measurement of inputs is not sustainable. The CSO has begun the process of investigating with the relevant government departments and agencies the availability of data that has the potential to be a source for direct measurement of outputs.
Expenditure Based Measurement of Growth
GDP and GNP at constant prices are also measured using the expenditure approach. On this side, the base year value of each of the components of demand is taken forward using either deflated values or quantity indicators. As in the case of the output measure, the former would be preferred as a means of better capturing quality change. The caveats that apply on the output side also exist here. However, double deflation is applied at a macro level in that imports are deducted in arriving at the aggregates. In the case of IT, therefore, any use of hedonic indices for exports of computers would have to be accompanied by the use of corresponding indices for imports of computers and computer parts.
For the estimates at constant prices, as in the case of those at current prices, the average of the two growth measures is taken as the definitive measure. This has been a long-standing practice. Unfortunately, an unresolved problem that has existed for many years is that the expenditure measure, with occasional exceptions, has risen faster than the output measure. Over the period 1990 to 1999, the expenditure measure has risen by about 0.5 per cent per annum faster on average. The most likely, but not the only, explanation for the divergence is a lack of full coherence between the deflators used for industrial output on the one hand and exports and imports, which are unit value indices, on the other. This is a problem that must now be addressed.
3. THE COMPONENTS OF GROWTH Output and Employment in 1990s
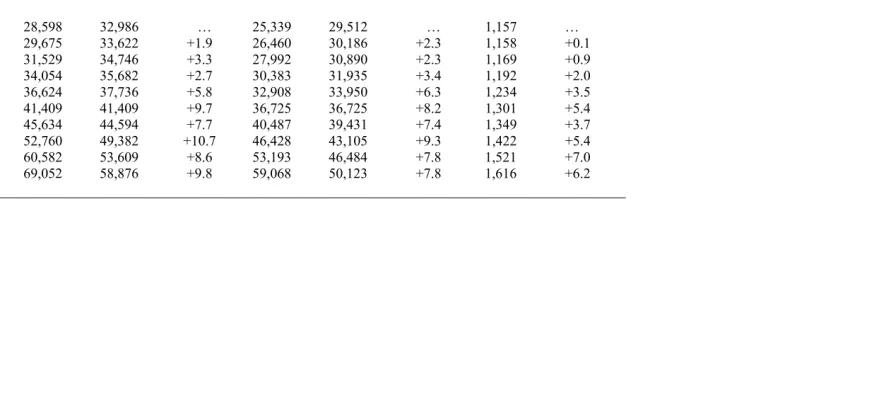
The story of growth in Ireland during the 1990s has been well documented at this stage. In order to put the next part of this paper in context, I summarise the main elements in Table 1 below.
The employment figures used in this table are on an ILO basis and have been annualised. This involves a degree of interpolation for the earlier years before the introduction of the Quarterly National Household Survey (QNHS). We can see from this that, over the period 1990 to 1999, GDP at constant prices grew by a total of 78.5 per cent or 6.6 per cent per annum on average. In the same period, total employment grew by 39.7 per cent. In very broad terms, therefore, it can be said that increasing productivity was responsible for growth of some 28 per cent. Strong productivity growth is especially obvious from 1995 through to 1997 but slackened in the last two years.
Impact of Structural Change
However, it is not always recognised that this productivity increase includes the effect of structural changes in the economy. Structural changes arising from the increasing importance of certain sectors and corresponding relative declines in others have an important impact on the growth rate. This has always been the case. For many years, this effect was illustrated by the declining influence of the agricultural sector, a development that of itself resulted in an increase in the level of output per person employed because of the replacement of jobs giving low value added with higher output jobs. It is a factor that can still be overlooked when the growth rate and changes in employment levels are used to derive changes in productivity.
The method employed here to show the effect of structural changes essentially consists of estimating what output levels would have been in 1999 if the numbers employed in each sector were as in 1990 and output per capita in each sector was as in 1999. This change reflects changes in the structure, as measured by employment numbers, only. I have used this methodology to look at the effect of changes in the structure of the overall economy using the five main sectors identified in the national accounts. This shows that, over the period 1990 to 1999, there was at this level a small structural effect of +0.3 percent per annum.
Table 1: Output and Employment, 1990 – 1999
GDP GNP Total at Work
Year Current
Prices Constant1995 prices
% Change (Constant
prices)
Current
prices Constant1995 prices
% Change (Constant prices)
Number % Change
£mill. £mill. £mill. £mill. 000s
1990 28,598 32,986 … 25,339 29,512 … 1,157 …
1991 29,675 33,622 +1.9 26,460 30,186 +2.3 1,158 +0.1
1992 31,529 34,746 +3.3 27,992 30,890 +2.3 1,169 +0.9
1993 34,054 35,682 +2.7 30,383 31,935 +3.4 1,192 +2.0
1994 36,624 37,736 +5.8 32,908 33,950 +6.3 1,234 +3.5
1995 41,409 41,409 +9.7 36,725 36,725 +8.2 1,301 +5.4
1996 45,634 44,594 +7.7 40,487 39,431 +7.4 1,349 +3.7
1997 52,760 49,382 +10.7 46,428 43,105 +9.3 1,422 +5.4
1998 60,582 53,609 +8.6 53,193 46,484 +7.8 1,521 +7.0
Taken in conjunction, therefore, the effect in the 1990s is a combination of
• 0.3 percent per annum due to structural change at a broad sectoral level; together with
• 0.9 percent per annum in industry (excl. construction) which would have an effect of adding about 0.3 percent to overall productivity
giving an overall effect of 0.6 percent per annum.
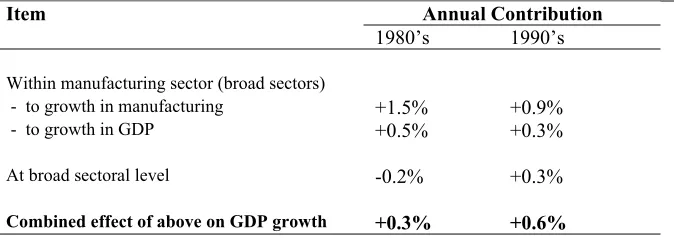
A National Economic and Social Council (NESC) report in 1992 investigated this effect for the manufacturing sector (NESC, 1992) following a basic methodology used by Tom Keane and myself in a 1989 paper on Irish industry (Keating and Keane, 1989). This report found that structural change within industry accounted for annual increases in productivity levels in industry of about 1.5 percent between 1980 and 1989, contributing about 0.5 percent to economy wide productivity. However, changes within the economy as a whole at a broad level actually reduced average output by about 0.2 percent per annum due to the relative decline in the contribution of industry. There was therefore an overall effect of +0.3 percent in the 1980s.
[image:10.595.130.467.427.546.2]Table 2 provides a summary of these effects.
Table 2: Structural Change Within the Irish Economy, 1980 – 1999 Annual Contribution Item
1980’s 1990’s
Within manufacturing sector (broad sectors)
- to growth in manufacturing +1.5% +0.9%
- to growth in GDP +0.5% +0.3%
At broad sectoral level -0.2% +0.3%
Combined effect of above on GDP growth +0.3% +0.6%
When a greater level of dis-aggregation (some 110 sectors) is used in industry in the 1990s, a figure of about 1.5 percent is obtained and then the combined effect in the 1990s is some +0.8 percent per annum. This is not insignificant in the context of the overall productivity change of under 3 percent per annum and given that it excludes any intra-sectoral effects for sectors other than industry.
11
session of this Society that “since we know little about the causes of productivity increase, the indicated importance of this element may be taken to be some sort of measure of our ignorance about the causes of economic growth.” or, in other words, it is the amount of growth which we have been unable to attribute to specific factors.
4. GLOBALISATION Problem for Statisticians
There can be little doubt but that the biggest structural change in the Irish economy in recent years has arisen from globalisation. In the broadest sense, the term has tended to be used as a description of the way in which multi-national enterprises (MNCs) are organised. In particular, it encompasses the view that national boundaries are of little relevance to such enterprises. For those engaged in compiling national statistics, this leads to obvious problems. As a very open economy with a high level of foreign direct investment (FDI), Ireland has been particularly affected in this regard with some criticism of the perceived failure to isolate the impact of the MNCs within the statistical aggregates.
In fact, Ireland has been well to the forefront in producing data that helps with the analysis of globalisation effects. External trade statistics have been a long-standing feature of the Irish statistical system. Since the 1980s there has been considerable detail produced in relation to foreign owned industrial enterprises from the Census of Industrial Production (CIP) and, of course, the Industrial Development Authority (IDA) has its own database. The Balance of Payments system has undergone major development in recent years culminating in the publication earlier this year of a considerable amount of additional information on trade, income and investment flows. Within the national accounts, the sectors dominated by MNCs have been separately distinguished for some time and a special unit has been established to ensure the consistency of statistical returns received from all of the major enterprises.
The latter task is not a trivial one. Its importance can be gauged from a few simple examples. In 1999, the ten foreign direct investment enterprises with the greatest value of exports accounted for exports to a total value of £20.6 billion or just over one-third of the total exports of goods and services. These ten enterprises also accounted for imports of goods and services valued at £13.6 billion or 27 per cent of the total.
Impact of Foreign Direct Investment
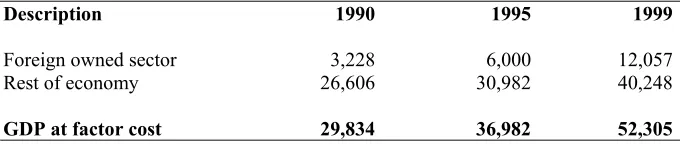
impact now of a crisis hitting our MNCs? The scale of the potential problem can be illustrated by a short examination of their influence on the national accounts. As a proxy for the MNCs, three sectors dominated by foreign owned enterprises have been identified in the accounts for some time. These are Chemicals; Computers and instrument engineering; and Electrical engineering (NACE70 classes 25&26, 33&37 and 34). Their combined effect on the growth rate is shown in Table 3.
Table 3: GDP at constant (1995) factor cost in £ million
Description 1990 1995 1999
Foreign owned sector 3,228 6,000 12,057
Rest of economy 26,606 30,982 40,248
GDP at factor cost 29,834 36,982 52,305
While GDP at constant factor cost rose by 75 per cent between 1990 and 1999, the three sectors dominated by MNCs increased in aggregate by a factor of 3.74 and contributed some 30 points of this 75 per cent. Over the same period, GNP, which excludes all profits after tax of foreign direct investment enterprises, grew by 70 per cent. Of course, apart from the MNCs contribution, this growth in GNP was also influenced by other factors such as Irish enterprises operating abroad and reduced interest payments by government .
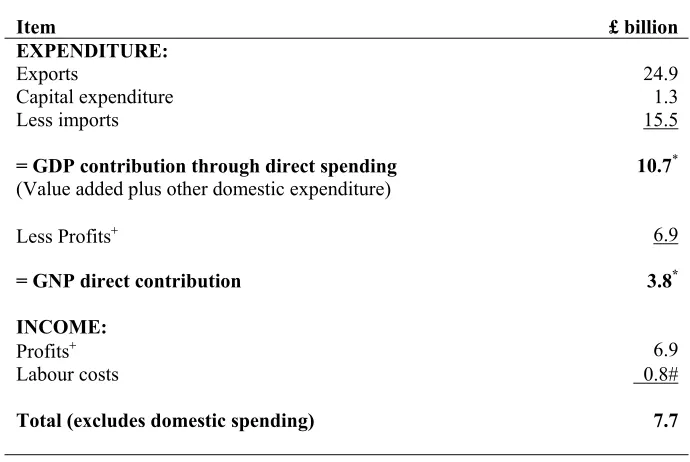
While it is not feasible to distinguish the transactions of all MNCs within the accounts, the bigger enterprises are all dealt with separately by the CSO’s consistency examination. This facilitates a more detailed analysis of the contribution of the Top 34 of these enterprises (all those with exports exceeding £200 million). This is summarised in Table 4.
13
Table 4: Contribution of Major Enterprises in the Irish Economy in 1998
Item £ billion
EXPENDITURE:
Exports 24.9
Capital expenditure 1.3
Less imports 15.5
= GDP contribution through direct spending
(Value added plus other domestic expenditure) 10.7 *
Less Profits+ 6.9
= GNP direct contribution 3.8*
INCOME:
Profits+ 6.9
Labour costs 0.8#
Total (excludes domestic spending) 7.7
∗ The GDP and GNP contributions are overstated to the extent that downstream suppliers import goods and services.
+ Profits are quoted net of tax and depreciation.
# Employment of 28,100
The difference between the expenditure side estimated contribution to GDP (£10.7bn.) and the income side total (£7.7bn.) is comprised of domestic expenditure, corporation taxes, etc. paid and depreciation.
Causes of Inconsistency
From the above, the importance of getting consistent returns for the major enterprises is clear. I will now give some examples of practices affecting this consistency. Within the National Accounting system it is necessary, for example, to ensure that the value attributed to exports is the same as that shown in an enterprises turnover and, therefore, reflected in its profits. This may appear obvious but it is by no means a trivial problem. Among the situations that can arise are:
1. Rebates
2. Triangular Trade
A company may sell goods to a distributor in Country A that then sells on to a customer in Country B; the goods may be shipped directly to B at their final price, some of which is to accrue to the enterprise in Country A. Again, we must be in a position to make the necessary adjustment to ensure the revenue finally accruing to the Irish enterprise is correctly recorded.
3. Consignment Goods
Goods are exported for storage abroad to be finished and sold as required. In practice, these goods are recorded in merchandise trade as exports when they cross the border. If they do not change ownership, they should be netted off BOP exports. This could only be established by comparison with turnover so the CSO replaces the export figures with turnover on a monthly basis to ensure consistency.
4. Commissionaire Trading
Under this arrangement, enterprises do not sell to distribution affiliates abroad for onward selling but sell directly to the final customer who has been identified by the local distribution company; the latter receive a standard commission fee. The change to this type of arrangement from selling to affiliates can result in overnight increases in turnover and exports that are then balanced by service imports (commission fees) so that the value added recorded for the enterprise remains the same. For CSO in this case, the important thing is to make sure we capture the new service payments in our systems.
These are just some examples of the problems now arising in measuring a complex, fast changing, open economy. It is no longer just a question of ensuring good coverage of our business register allied to good response from enterprises enabling us to aggregate outputs such as tonnes of steel and of butter and so on.
One problem in this regard is that, when making adjustments in these cases, they cannot always be made at the time of publication of the external trade results. The changes are often made retrospectively on the basis of comparisons with other data sources and subsequent discussions with the relevant enterprises. In other cases, the trade aggregates can change overnight for accounting reasons. While instances such as these make the external trade data a poorer predictor of the final national accounts aggregates, this is unavoidable. However, the improved timeliness of the BOP (generally published some three months after the end of the relevant quarter) helps to mitigate the effects of this situation.
E-Commerce
15
transactions along with those conducted by traditional means. The principal difficulty is likely to be ensuring that CSO’s business registers, which determine the population of enterprises to whom statistical inquiries are sent, pick up new entities specialising in e-commerce on a comprehensive and timely basis.
A secondary, but also important issue, is the need to start compiling statistics on the influence of e-commerce. A start has been made in this area by the inclusion of questions in household surveys and also in some recent business surveys on use of the Internet. These are the easier questions for respondents; difficulties will arise when we begin to ask enterprises to quantify the scale of their e-commerce transactions. This will be necessary to allow us to answer the questions already being asked such as “what is the share of GDP accounted for by e-commerce?”
5. INFLUENCE OF EU EU Harmonisation
The compilation of the Irish national accounts has been strongly influenced for many years by EU legislation. As in the case of most statistical areas, there has been consistent movement towards the harmonisation of methodologies used in member states for compilation of national accounts. Pressure on this front has been accentuated by the increasing use of various national accounting aggregates for EU administrative purposes. The original driving force came from the use of GNP as a basis for calculating member states’ contributions to the EU. This was followed by the use of Government debt and deficit figures for the so-called Maastricht criteria, initially for the decisions on accession to Economic and Monetary Union (EMU) and now for performance under the Stability and Growth Pact. The GDP per capita levels are also used to decide on the status of regions in respect of structural funds. Level of GNP
The emphasis on the level of GNP has been of considerable benefit to Ireland in developing the national accounts system. Quite clearly it meant that the EU Commission and member states had an interest in seeing that each country’s compilation system was accurate and, in particular, resulted in comprehensive coverage of the economy. In the first place this necessitated a detailed examination of sources and methods and then, where these were found to be lacking, to the introduction of better bases for estimation. This has led, over the last decade, to considerable increases in the level of GDP and GNP estimates in Ireland and a number of other EU member states.
Income side of the account, this still was consistently lower than the Expenditure measure. As a result, it was decided to take the average of the two measures as the definitive measure of GDP.
Prior to the requirement that the measure of GNP at current prices be comprehensive and comparable with other countries, the emphasis had been on ensuring that year on year changes were accurate with the absolute level being a secondary issue. Changes at constant prices will now have to come back to the top of the agenda. Pressure at EU level is developing to ensure harmonisation and best practice in this regard since a fall in GDP is now a critical factor with regard to the level of government deficit that is permissible under the Stability and Growth Pact.
Government Deficit
The definition of government deficit is an area where the influence of EU legislation has been of a different nature. The size of this deficit was one of the so-called Maastricht criteria used in determining eligibility for membership of EMU. This then led to a number of controversies centring on this definition. Problems arose from the fact that the relevant legislation specified that the definition should be in accordance with the European System of Accounts (ESA79). However, this system was written as a statistical guide and not as a legal document. Not all of the problematic cases could be clearly judged on this basis. It was necessary for Eurostat to make judgements on specific cases with advice from national statisticians. After some initial teething problems, this system worked well. The basis of each decision by Eurostat was clearly described and, as a result, there was eventually no questioning of the use of the statistical measures for eligibility for EMU. Out of this exercise statistics gained in that their importance for a major policy issue was illustrated.
One downside was that policy-makers examined the fine print of statistical definitions as part of their assessment of the structuring of particular schemes. This was understandable and was in a sense akin to enterprises structuring a financial transaction to best fit with the relevant accountancy standards. However, it was not a role for which the statistical standards were designed and, to that extent, their use in such a sensitive policy area was a matter of some concern. The lesson has been learned. For the Stability and Growth Pact, the EU policy makers have been alerted to potential difficulties such as the effect of routine revisions on the growth rate. Another negative aspect that is now clear is that the strict accounting rules must be applied. Previously, national accountants regarded the international standards as frameworks within which they could apply their own judgements on particular national issues. Nowadays, there is no room for flexibility.
Structural Funds
17
Parities (PPPs), being less than 75 per cent of the EU average. The use of GDP in this way highlights again the necessity for consistency and comparability between countries in measuring GDP. The PPPs are a means of making price and volume comparisons between countries. There has been considerable criticism at world level of the quality of PPPs so this is an area where considerable work has to be done to improve these important statistics.
Stability and Growth Pact
Under the Stability and Growth Pact, members of the Euro area are not allowed run a Government deficit of more than 3 percent unless they are in a severe recession (defined as an annual fall in output of 2 percent or more). This has provided the impetus for the work on harmonisation of constant price output estimates mentioned earlier. The problems in using the penalty mechanisms under the Pact would clearly be of major proportions if serious issue could be taken with the underlying statistics.
6. ECONOMIC WELL-BEING Measurement Issues
Because of their influence, CSO has recommended the use of GNP as a measure of domestic economic wellbeing because it excludes all profits of foreign direct investment enterprises. The concept of resident controlled production has been mooted as a better measure of national welfare. It has been suggested that this could be compared with GDP as a measure of globalisation in the economy. This is reasonable but, as a measure of the economy in its own right, I would argue that it is a step too far because it removes from the national measure items which have a real impact such as the wages and salaries of foreign owned enterprises. In any event, discussion of the best measure of economic well being goes well beyond the impact of the MNCs
On a wider front, national accountants have always warned against using either GDP or GNP as measures of welfare. Traditionally their argument would have been based on the fact that these are aggregate measures of production and, for example, take no account of disposable income or of the distribution of income except insofar as these affected the aggregates indirectly. The SNA93 states specifically that “…..movements of GDP on their own cannot be expected to be good indicators of changes in total welfare unless all the other factors influencing welfare remain constant, which history shows is never the case”.
Development of Indexes
Attempts to deal with this issue have led to various initiatives to develop a framework for sustainable development. Various studies have been carried out aimed at drawing up Indexes of sustainable development or of economic well being. Examples include the original work on this theme for the United States (Daly and Cobb, 1989) and estimates for the U.K. (Jackson et al., 1997) and for Australia (Hamilton, 1997). The essence of their approaches could probably be summarised as methods for adjusting GDP to overcome its perceived shortcomings, especially as a measure of welfare. More precisely, Hamilton calls his index a “Genuine Progress Indicator” and then goes on to define progress as genuine only if it can be sustained without damaging social peace and cohesion and without harming the natural environment.
These indexes generally tend to start with the national accounts aggregate “final consumption expenditure of households”. This is, in one sense, a measure of the goods and services that people are willing to pay for and presumably, therefore, derive welfare from. This would then be supplemented by, for example,
- adding items such as unpaid household production, services from roads, public expenditure on health and education, etc, and
- deducting some measure of income inequality, costs of commuting and unemployment, depletion of non-renewable resources and costs of climate change, etc
Because the traditional measurements depend on actual exchanges of money, unpaid household production is likely to be the single biggest additional item in any such exercise. In their UK work, Jackson et al. estimated the sources of household labour to have a value equivalent to over one-third of consumer expenditure.
In a recent paper, Osberg and Sharpe (2000) argue for four components of economic well-being including:
1. Effective per capita consumption flows, which includes consumption of marketed goods and services, effective per capita flows of un-marketed goods and services and changes in leisure;
2. Net societal accumulation of stocks of productive resources, including net accumulation of tangible capital and housing stocks, net accumulation of human capital and R&D investment, environmental costs, and net change in foreign indebtedness;
19
4. Economic security from unemployment, ill health, single parent poverty and poverty in old age.
The average consumption flows component encompasses unpaid household production, the underground economy and takes account of the value of increased longevity. The authors agree that there is an argument that certain expenditures (e.g., commuting costs) should be subtracted from market consumption but have not actually made this adjustment in the paper. These had not shown any trend over time in Canada, however in the Irish situation we can be reasonably certain that a quite definite trend would emerge.
To compile their overall index of economic well-being from the four components identified above, the authors use a “standard” weighting for discussion purposes of 0.4 for consumption flows, 0.1 for wealth stocks and 0.25 for the two other dimensions. They do state that “with a single index number it may be difficult to disentangle the relative importance of value judgements and technical measurement choices in the construction of the index”.
Conceptual Problems
There are, however, a number of problems with the whole concept of developing an index of this nature apart altogether from the measurement problems. In particular, one must question the validity of attributing prices and values to items that are currently not priced. Examples include the costs of environmental damage. If these costs had to be paid, then presumably the behaviour of enterprises and households would change. As Keuning (2000), a leading national accountant from the Netherlands CBS, says, “Adjusting GDP by monetising an unsustainable use of the environment cannot be done by means of simple accounting deduction, but requires an explicit and quite complex model…….this is because assigning hypothetical prices to pollution requires the incorporation of all kinds of very sizeable second-order effects, which substantially mitigate the original downward adjustment of GDP.”
The National Accounting Matrix Including Environmental Accounts (NAMEA) approach originates from work by Keuning, in collaboration with De Boo, Bosch and Gorter. In Ireland a first attempt has been made at compiling a set of environmental accounts. These were compiled by Sue Scott of the Economic and Social Research Institute and published by CSO (1999). They concentrated on the contribution of industrial sectors to four environmental themes4. This is just one example of how aggregate indicators could be developed.
Unpaid Household Work
One of the first components of the indexes of economic well being developed in various countries is unpaid household work. This is currently outside the production boundary as defined in the SNA. Paragraph 1.20 of the SNA93 manual states: “The System includes within the production boundary all production actually destined for the market, whether for sale or barter. It also includes all goods or services provided free to individual households or collectively to the community by government units or NPISHs.”
The SNA93 manual (para. 6.21) goes on to summarise the reasons why household production is omitted from the core accounts. Three reasons are given which can be summarised as:
- it is a self-contained activity with limited repercussions on the rest of the economy;
21
7. CONCLUSION
The measurement of growth in the economy continues to pose major challenges for statisticians. Within the current frameworks, these include the improvement of volume indicators for non-market services, in particular, and capturing correctly the effects of globalisation. This must be done while complying strictly with the definitions agreed for EU administrative purposes. I hope I have also shown that it is often necessary to probe beneath the headline aggregates for a proper understanding of developments in the economy. On a wider front, more emphasis must be placed on indicators of sustainable development to help supplement the traditional measures.
To end on a positive note, it is worthy of note that, in reviewing its achievements at the end of the 20th century, the U.S. Department of Commerce (2000) named the development of the national accounts as “its achievement of the century”. The task for CSO in Ireland is to develop our accounts to meet the highest international standards. The staff of the CSO have shown, through the developments of recent years, that they are capable of rising to this challenge. My thanks are due to all those who have contributed to the improvements in macro economic statistics.
Endnotes
1. GNP Directive 89/130 is the basis for member states’ budget contributions. 2. Dr. R.C. Geary, former President of SSISI, was one of the pioneers of this
approach.
3. 1991 and 1998 were the earliest and latest years for which Census of Industrial Production data on a NACE Rev 1 basis were available.
References
Abramovitz, M. 1956. “Resource and Output Trends in the United States since 1870”, American Economic Review, Papers and Proceedings, May 1956, pp 5-23. Australian Bureau of Statistics, 2000. “Non-market output – recent work by the Australian Bureau of Statistics”, Paper for OECD meeting of national accounts experts, Paris, September 2000.
Central Statistics Office, 1999. Pilot Environmental Accounts (compiled by Sue Scott, ESRI), Stationery Office, Dublin, May.
Central Statistics Office, 1999. Report on Pilot Time Use Survey, Stationery Office, Dublin, June.
Central Statistics Office, 2000. “Balance of Payments”, Statistical Bulletin, June 2000, Stationery Office, Dublin.
Central Statistics Office, 2000. National Income and Expenditure, 1999, Pn 8928, Stationery Office, Dublin, August.
Daly, H. and J. Cobb, 1989. For the Common Good – redirecting the economy towards community, the environment and sustainable development, Beacon Press, Boston.
Eurostat, IMF, OECD, UN and World Bank, 1993. System of National Accounts, 1993.
Hamilton, C. (with contributions from H. Saddler), 1997. The Genuine Progress Indicator. A new index of changes in well-being in Australia, Australia Institute, Discussion Paper no. 14.
Jackson, T., N. Marks, J. Ralls, and S. Stymne, 1997. Sustainable economic welfare in the UK 1950 – 1996, New Economics Foundation, London.
Keating, W. and T. Keane, 1989. “Irish industrial structures 1979 to 1985 (a longitudinal analysis)”, Journal of the Statistical and Social Inquiry Society of Ireland, Vol. XXVI, Part 1.
23
Osberg, L and A. Sharpe, 2000. “Estimates of an Index of Economic Well-being for OECD Countries”, Paper for 26th General Conference of the International
DISCUSSION
Professor Frank Convery: The title of my response is “utility is a metaphysical concept of impregnable circularity”, a familiar observation made by Joan Robinson, who put her finger on the futility of attempting to measure utility, a theme to which I will return. On behalf of all of you, I would like to thank Mr. Keating for a splendidly practical review of the state of the art in Ireland in regard to the measurement of Gross Domestic Product and Gross National Product. It is a great privilege to get a view from the boiler room as to how the machinery of economic performance measurement works, and to have its evolution and operation presented with such clarity. A few reflections
1. Forbearance
I admire his forbearance about the critics of the integrity and value of the national accounting framework in the early 1990s. He refers to this furore as ‘some questioning of the reliability of the growth figures’ – a degree of understatement not characteristic of the sound-bite tenor of our times.
2. Range Intolerance
His paper highlights our need to have a single number that expresses economic performance. Instead of presenting the estimates of GDP and GNP derived on the basis of income and expenditure as reflecting the range within which our activity falls, we apparently demand, and the CSO provides, a single number, until recently by recognising the ‘primacy’ of the income estimate, and now since 1999 by averaging the two estimates
3. The Positive Role of the EU
It can be plausibly be argued that in many of those areas where we have been left to our own devices by the EU – the allocation of taxi plates, and the allocation of planning permissions come to mind – we have made a mess of things, whereas where the EU has imposed performance standards, we have responded well. We are told by Mr. Keating that ‘the CSO had undertaken a series of developments and improvements to the current price estimates as part of the process of complying with EU requirements applying to all Member States’ and this in turn has led to the Expenditure estimate of GDP being given ‘parity of esteem’ with Income. And this EU wide influence continues with the (very welcome) evolution towards Output based accounts. This EU impetus is driven by the need to have plausible and credible indicators for deciding, inter alia, on structural fund allocations, and progress towards or away from the Maastricht criteria.
4. The Unique Features of a small open economy
25
and leadership in how to handle a range of issues including multinational enterprises (MNCs), and sectors such as IT, financial services and eCommerce.
5. Interesting By-products
This paper is full of serendipitous observations. One example: ‘In 1999, the ten foreign direct investment enterprises with the greatest value of exports accounted for exports to a total value of £20.6 billion, or just over one third of total exports of goods and services……and for imports of goods and services valued at £13.6 billion, or 27 per cent of the total.’ You don’t need to be paranoid to imagine that ten chief executives of MNCs and their boards have a lot of influence on our well-being.
6. Interesting Asymmetries – Flows vs. Stocks
There seems to be a preponderance of attention devoted to annual flows – GDP and GNP – and very little to changes in capital stock. Net National Product (NNP), which equals gross national produce minus depreciation of built capital is computed, but rarely adverted to. Why? For a company, the balance sheet is as important as the annual profit statement. For a family, the asset situation is as important as the annual income. But, while national accounting does provide some consideration of changes in national capital stocks, there are rarely analysed or adverted to. This asymmetry in our attention is of considerable significance in regard to environmental performance.
Lintott (1996) argues that, rather than being an objective reflection of economic performance, national accounting conventions reflect the mores and interests of society. He cites the case whereby public expenditure was included in National accounts against the advice of Simon Kuznets, who argued that only market mediated transactions should be included. The Kuznets view was over-ridden, not because he was (necessarily) wrong, but because the US and the UK who where leading in the development of such accounts were embarked on Keynesian demand policies, and government activities were included because these were the components that could be controlled. There may be some similar explanation for the ignoring of stock changes. [Interestingly, I’ve heard a new (stock-related) version of the Irish poor mouth being put about Brussels these days, to the effect that, while we may be doing better than the UK and others in terms of income per capita, we are still incomparably poorer - and therefore still in need of continuing subsidy - when it comes to our relative per capita stock of assets. Old habits die hard…]
7. Politics Matters
explicit prohibition on environmental accounting work.’ Political pressure in Europe tends to be more subtle, but no less real.
8. Is GNP and GDP a Measure of Well-being?
William Keating notes that national accountants warn against using GDP as a measure of well-being, on the basis that movements of GDP on their own cannot be expected to be good indicators of changes in total welfare unless all the other factors influencing welfare remain constant, which history shows is never the case. The late Senator for New York, Robert Kennedy, put the case against GNP less technocratically: “Gross National Product does not allow for the health of our children, the quality of their education or the joy of their play. It does not include the beauty of our poetry or the strength of our marriages, the intelligence of our public debate or the integrity of our public officials. It measures neither our wit nor our courage, neither our wisdom nor our learning, neither our compassion nor our devotion to our country. It measures everything, in short, except that which makes our life worthwhile.”
One can critique the Senator’s observations: for example, good health and good education today will increase GNP tomorrow, so that in time the national income calculus does capture these effects. But we also recognise that those aspects of our lives that are un-monetised are not ‘picked up’ as value in national accounts. This does not matter, if they are neutral or complementary goods and services. Thus, if growing GDP also increases – or at least does not weaken – the strength of marriages, the beauty of our poetry, the play of our children, the integrity of our officials, our wisdom, learning, compassion etc. – then increasing GNP may increase wellbeing commensurately. But what if they are trade-offs, what if we can only have one at the expense of the other?
Faced with such choices, Samuel Johnson is emphatic that we should sacrifice the income: “The commodiousness of money is indeed great, but there are many advantages which money cannot buy, and which therefore no wise man will by love of money be tempted to forego” (A Journey to the Western Islands of Scotland, p. 86)
27
and this analytical effort is reflective of what has been happening across a wide range of countries.
9. The Future
A panel set up by the National Academy of Sciences in the US, chaired by William Nordhaus, and reported in Darmstadter (2000) provides the most recent comprehensive assessment of the state of the art, and future directions. In descending order of difficulty as regards estimation is the valuation of changes in non-renewable assets, renewables, and environmental quality.
Even in regard to sub soil (non-renewables) the panel notes an estimate range between 0.4 and 1.4 per cent of GDP in 1987 developed by the Bureau of Economic Analysis (before they were precluded by statute from engaging in such work). The range reflected in the estimates of the change in environmental quality would be wider still. Moreover, as Darmstadter notes, “There is bound to be an irreducible set of negative environmental social and impacts that, while clearly adverse to social welfare, is not amenable to the dollar metric used to measure economic activity.”
Nordhaus concludes as follows: “After a thorough review, the committee urged the adoption of an ambitious programme for developing a comprehensive set of near-market and non-near-market accounts. In addition to developing environmental and natural resource accounts, significant extensions would include the value of home production and unpaid work, research and development capital, non-market time of the population, and informal and home education. In a wealthy country like the United States, providing information on the structure and interactions of the economy and the environment is an essential function of government. It deserves a serious research effort by the federal government and private research organisations.”
our shoulder - and that other measures of well-being are valid and should be a part of our public discourse. At the same time, we should recognise that the current estimates, incomplete as they are, do measure some aspects of life that many find of value. To me one of the unspoken such affirmations is the enthusiasm of thousands to live amongst us, and of ourselves to stay. To quote Samuel Johnson once more (speaking of the Scottish Highlands in the 18th century): “That state from which all escape as soon as they can, and to which none return after they have left it, must be less happy.” (quoted in Boswell's Tour of the Hebrides).
Table 1: Estimated emissions of SO2, NOX, NH3 and Total Acid Rain
Precursors by sector in Ireland, 1994 (Tonnes)
Sector SO2 NOX NH3 Acid rain
precursors1 Agriculture, Forestry and Fishing 1,517 4,638 123,147 236,556 Fuel, Power, Water (FPW) 96,075 45,493 0 127,724
Industry (excl. FPW) 39,632 10,125 0 46,676
Of which:
Chemical production (18,829) (3,183) (0) (21,044)
Agriculture & Industrial machinery (372) (126) (0) (460) Food, beverage, tobacco (9,904) (2,765) (0) (11,828) Transport (incl. own acc.) 8,421 49,458 288 43,371 Services (excl. transport) 13,260 2,624 0 15,086
RESIDENTIAL 17,680 5,033 0 21,181
TOTAL 176,585 117,371 123,435 490,594
1Weighted measure in terms of tonnes of SO
2 equivalent. The weights used to convert NOX
and NH3 to SO2 equivalents are 0.6957 and 1.8824 respectively. Source: Scott (1999), p. 33
29
On my own behalf, and that of the audience, I wish to express our thanks again to William Keating for an interesting view as to where we’ve been in national income accounting, and where we are likely to be going.
References
Coleman, S., 1999. Environmental Protection Expenditure: an application of SERIEE in Australia. Working Paper 18, Joint Work Session UNECE/EUROSTAT on Methodological Issues of Environmental Statistics, Ma’ale, Hachamisha, Israel, 11-14, October
Darmstadter, Joel, 2000. ‘Greening the GDP – is it desirable? Is it feasible?’ Resources, Spring, Resources for the Future, Washington DC.
De Haan, M., S. J. Keuning, and P. Bosch, 1993. Integrating Indicators in an National Accounting Matrix Including Environmental Accounts (NAMEA), Vooburg, Central Bureau of Statistics.
Hecht, Joy E., 1999. ‘Environmental Accounting – where we are now, where we are heading, Resources, Spring, Resources for the Future, Washington DC.
Lintott, J. 1996. ‘Environmental Accounting: Useful to Whom and for What?’ Ecological Economics, 16: pp. 179-190.
National Academy of Sciences, 1999. Nature’s Numbers: Expanding the National Economic Accounts to include the Environment, Washington DC. (Chair: William Nordhaus).
Scott, Sue, 1999. Pilot Environmental Accounts, Dublin, Central Statistics Office. Statistics Canada, 1997. Concepts, Sources, and Methods of the Canadian System Environmental and Resource Accounts, Ottawa, Canada
United Nations, 1993. Handbook of National Accounting: Integrated Environmental and Economic Accounting, New York, United Nations.
Dr. Dan McLaughlin: I would like to thank William Keating for his interesting and informative paper on ‘measuring’ the Irish economy. As an economist working in the financial markets, I would like to take the opportunity to comment on his paper from that vantage point.
Keating notes in his introduction the phenomenal pace of GDP growth in the past five years and states that few have questioned the validity of the CSO data on the national accounts, which is in contrast to the latter part of the 1980’s and early 1990’s. The scepticism on the validity of the growth numbers at that time was partly due to the dire employment performance of the 1980’s (employment in April 1990 was 1.16m, identical to the figure a decade earlier), but also to a belief that the GDP figures were overstated due to the influence of the foreign multinationals (MNC’s). GNP, which measures the income of residents, amounted to 96 percent of GDP, the output of the economy, in 1980, but this had fallen to 89 percent by 1985, although stabilising at this level through to 1990. Clearly the MNC’s had a huge influence on the economy, and there was a widely held view that the GDP numbers overstated the value added of these companies.
In that sense a big step forward, in my view at least, was the changes introduced to the Balance of Payments data in 1996, which effectively shifted some of the multinational flows from a factor outflow component (and hence not captured in GDP) to a service import (and hence captured in the GDP data). For example, royalties were now treated as a service import, and all profits payable to foreign owners were now attributed, as opposed to that measured on a remittance basis. These changes had the effect of reducing GDP relative to GNP and probably reduced the volatility of the GNP growth numbers by eliminating the ‘lumpy’ nature of profit remittances. Thus GDP is now a much better measure of value-added in the economy, even though MNC’s account for some 23 percent of GDP at factor cost, as outlined by Keating. This is important as the Irish tax base and employment is a function of GDP and not GNP, and GDP is the accepted international standard for comparing income per head. The BoP data has been improved further in the past year with the breakdown of flows between the IFSC and the rest of the economy so providing much more detailed information on capital flows.
31
All that has changed with the onset of the single currency. Now there is no interest in the monetary data, at least for bond-holders, but the strength of the economy has kindled interest among equity investors in domestic economic trends, particularly as foreign ownership of the Irish stock-market has risen sharply in recent years. Consequently analysts are now looking closely at the various monthly releases on the macro-economic indicators. Furthermore, growth in Ireland is now effectively supply constrained, and in that sense the markets interest has shifted to data sets which provide information on the economy’s supply potential including labour supply, labour force participation and migration.
It is also true that there have been substantial improvements in the timeliness and quality of the data releases. For example, quarterly GDP is now produced and the quarterly BoP data is now released some three months after the quarter. The fact that the releases are scheduled for 11.00 is to be welcomed, particularly for those of us who remember when the data was released at 5.30pm and then only in preliminary form, with the details the following day!
There are gaps in the CSO’s coverage. The most glaring is the area of personal incomes, particularly earnings growth. There is no aggregate series on pay per head for the economy at large, and few if any timely releases on a sectoral basis. Ireland’s membership of the EMU means that competitiveness within the Eurozone will be determined by unit labour costs relative to Ireland’s peer group, but we have little or no idea how pay trends have developed this year, even to the first quarter -I’m sure that is an area where the CSO will address in the near future.
Another problem, I feel, is one noted by Keating – the difficulty in disaggregating a value rise in GDP into its volume and price components. All statisticians face this problem but the openness of the Irish economy highlights the sensitivity of real GDP measures in Ireland to the assumptions made about the price deflator for external trade flows. For example, according to the external trade accounts, the price deflator of merchandise exports rose by only 0.3 percent in 1999 and on a national accounts basis, the export of goods and services rose by 15 percent in value terms. Yet the national accounts NIE 1999 put the price deflator of total exports at 2.3 percent, so giving a real or volume rise of 12.4 percent. Had the deflator been the same as that of total merchandise exports (0.3 percent), the volume rise would have been much higher at 14.7 percent, which would have raised the 1999 GDP growth figure to 12 percent, instead of the 9.8 percent actually reported.
Dr. Eunice McCarthy: I welcome the inclusion of Unpaid Household Work in the indexes of Economic Well Being. Over the past three decades, the meaning and significance of unpaid household work, has been a major concern for women’s groups including the National Women’s Council. The conclusion of the Pilot Time Use Survey (1997) that a Time Use Survey of unpaid work was feasible and that it would cost a mere £1million is welcome. In my view this would constitute a relatively cheap price to pay to collect data on hidden unpaid household work, which has been undervalued, and so central to the well-being of our society.
Professor Patrick Honohan: I welcome the way in which the President has highlighted and explored some of the most complex and challenging issues involved in understanding the Irish National Accounts. In particular, his insistence that one should look not just at one entry, but at others which may be linked in hidden ways to see what is really going on. For example, growth in aggregate productivity that can (as he has documented) be due almost as much to sectoral shifts as to firm-level improvements. The degree to which the surge in exports from MNCs is offset by corresponding surges in imports and profit outflows is another example which underlines the continued need to avoid use of GDP in many contexts for Ireland. Yet another example comes from the systematic terms of trade losses coming from the short product cycles in pharmaceuticals and computer-related products. This is not unrelated to the issue of hedonic indices mentioned in the paper, but what I have in mind here is a distinct point. Since Ireland is a major net exporters of such products, real output growth tends to be greater than the growth in purchasing power, because of the fall in price - and the faster the growth generated by these sectors, the larger the offsetting terms of trade effect will tend to be.