Multi-breed herd approach to detect breed differences
in composition and fatty acid profile of cow milk
Carmen L. Manuelian
1*, Mauro Penasa
1, Giulio Visentin
1,2, Anna Benedet
1,
Martino Cassandro
1, Massimo De Marchi
11Department of Agronomy, Food, Natural Resources, Animals and Environment,
University of Padova, Legnaro, Italy
2Associazione Nazionale Allevatori Frisona Italiana, Cremona, Italy
*Corresponding author: [email protected]
Citation:Manuelian C.L., Penasa M., Visentin G., Benedet A., Cassandro M., De Marchi M. (2019): Multi-breed herd approach to detect breed differences in composition and fatty acid profile of cow milk. Czech J. Anim. Sci., 64: 11–16.
Abstract:The objective of the present study was to estimate the effect of breed on milk fatty acid (FA) composition of dairy (Brown Swiss, Holstein-Friesian, and Jersey) and dual-purpose cows (Simmental and Alpine Grey) in multi-breed herds. Infor-mation on individual milk samples was collected during routine cow milk testing between 2011 and 2014, and consisted of 285 606 observations from 17 445 cows in 617 herds. Fixed effects included in the mixed model were breed, parity, stage of lactation and the interaction between parity and stage of lactation, and random effects were cow, herd-test-date and residual. Contrast estimates for the studied traits were used to compare specific sets of breeds. Holstein-Friesian produced more milk than the other cattle breeds, with the greatest trans FA and C18:1 and the lowest C18:0 content. Comparison between the specialised dairy vs the dual-purpose breeds highlighted significant differences for all traits except for polyunsaturated FA and
trans FA content. Specialised dairy breeds had greater milk saturated FA, short-chain FA, medium-chain FA, C14:0 and C16:0 content, and dual-purpose breeds produced milk with greater content of monounsaturated FA, long-chain FA, C18:0 and C18:1. Results demonstrated that, although specialised dairy produced more milk than dual-purpose breeds, milk FA profile of the latter was more favourable from a human nutrition point of view.
Keywords: dairy specialised breed; dual-purpose breed; mid-infrared spectroscopy; phenotyping
Milk chemical composition and fatty acid (FA) profile are key points for the dairy industry that seeks for a more efficient processing of milk to offer products following new consumers’ trends. Although diet is the major source of variation influencing milk FA profile, there are other im-portant factors affecting milk FA composition such as breed, individual animal, stage of lactation and parity (Ferlay et al. 2011; Niero et al. 2016; Gottardo et al. 2017). The effect of breed on milk composition, FA profile and coagulation properties has highlighted some inconsistent results (Kelsey et al. 2003; Ferlay et al. 2011; Penasa et al. 2014; Gottardo et al. 2017; Stocco et al. 2017), which partially arise from some limitation of the studies.
MATERIAL AND METHODS
Multi-breed herds and data editing. Informa-tion on individual milk samples from multi-breed herds collected during routine cow milk testing in January 2011–December 2014 was obtained from the South Tyrolean Dairy Association (Bolzano, Italy) and the Breeders Association of Bolzano province (Bolzano, Italy). The Bolzano province is located in a mountainous area of the Italian Alps (North Italy) and it is characterised by small herds (on average, 15 cows/herd) with feeding mainly based on forage or hay and concentrates. Cows are usually moved to highland pastures during summer season (Visentin et al. 2018). Cows were from three specialised dairy (BS, Brown Swiss; HF, Holstein-Friesian; and JE, Jersey) and two dual-purpose cattle breeds (SI, Simmental; and AG, Alpine Grey). Each cow was checked every 4 weeks for milk production and composition. Milk fat, protein, casein, lactose and FA were analysed with MilkoScan FT6000 (FOSS, Denmark) using MIRS prediction models developed and commercialised by FOSS. The FA considered were those included in the FOSS Application Note 64. Briefly, FA content was expressed as relative amount (g/100 g total FA) and determined as 8 groups, namely saturated FA (SFA), unsaturated FA (UFA), monounsatu-rated FA (MUFA), polyunsatumonounsatu-rated FA (PUFA), trans FA, short-chain FA (SCFA), medium-chain FA (MCFA) and long-chain FA (LCFA), and 4 individual FA, namely C14:0, C16:0, C18:0 and C18:1 (Hein et al. 2016; Gottardo et al. 2017). Goodness-of-fit statistics of MIRS prediction models for individual FA and groups of FA can be retrieved from Gottardo et al. (2017) who reported that the coefficient of determination in external validation for FA groups ranged from 0.72 to 0.98, and for individual FA from 0.55 to 0.81. Somatic cell count (SCC) was assessed by Cell Fossomatic 250 (FOSS) and logarithmic transformation was adopted to convert SCC to SCS using the equation SCS = 3 + log2(SCC/100) where SCC is somatic cell count in cells/µl (Wiggans and Shook 1987).
The original dataset (n = 1 491 347) was edited to retain herds with 2 or 3 breeds, and cows between 6 and 450 days in milk (DIM) and from parity 1 to 9. Cows whose age at calving deviated more than 3 standard deviations from the respective parity mean were discarded from the dataset, as well as cows with less than 5 observations within lactation,
herds with less than 3 cows per breed and breed combinations spread in less than 5 herds. Also, inconsistent records for the studied traits were treated as missing values. Contemporary groups were defined as cows tested in the same herd and date (herd-test-date, HTD), and HTD with less than 5 animals were removed from the database. After editing, the dataset consisted of 285 606 observations from 17 445 cows and 617 multi-breed herds. The frequency for each 617 multi-breed was: BS, 434 herds and 6733 cows; HF, 420 herds and 5675 cows; JE, 42 herds and 217 cows; SI, 306 herds and 3732 cows; and AG, 94 herds and 1088 cows. Twelve breed combinations were available in the dataset: BS + HF (219 herds), BS + SI (120 herds), HF + SI (100 herds), BS + HF + SI (42 herds), SI + AG (37 herds), HF + AG (27 herds), BS + JE (22 herds), BS + AG (18 herds), HF + JE (12 herds), BS + HF + JE (8 herds), HF + SI + AG (7 herds), and BS + HF + AG (5 herds).
Statistical analysis. Milk yield, composition, SCS and FA traits were analysed through a linear mixed model in ASReml (Gilmour et al. 2015) including the fixed effects of breed (BS, HF, JE, SI, AG), parity (6 classes, with the last including parities 6 to 9), stage of lactation (14 classes, the first being a class from 6 to 30 DIM, followed by 12 classes of 30 DIM each, and the last being a class from 391 to 450 DIM), and the interaction between parity and stage of lactation. Random effects were cow, HTD and residual. Contrast estimates between Least Squares Means for milk yield, SCS, composition and FA traits were used to compare specific sets of breeds. Significance was set at P < 0.05 unless otherwise stated.
RESULTS AND DISCUSSION
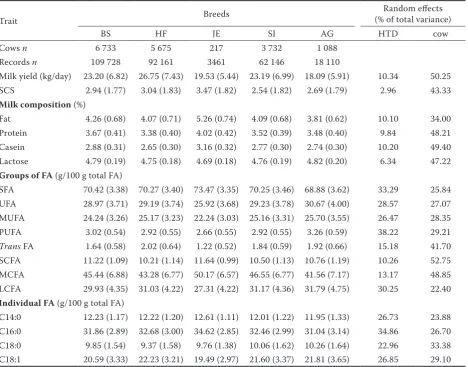
Table 1. Within-breed mean (standard deviation in parentheses) of milk yield, somatic cell score (SCS), composition, and fatty acid traits, and proportion of phenotypic variance explained by herd-test-date (HTD) and cow effects
Trait Breeds
Random effects (% of total variance)
BS HF JE SI AG HTD cow
Cows n 6 733 5 675 217 3 732 1 088 Records n 109 728 92 161 3461 62 146 18 110
Milk yield (kg/day) 23.20 (6.82) 26.75 (7.43) 19.53 (5.44) 23.19 (6.99) 18.09 (5.91) 10.34 50.25 SCS 2.94 (1.77) 3.04 (1.83) 3.47 (1.82) 2.54 (1.82) 2.69 (1.79) 2.96 43.33
Milk composition (%)
Fat 4.26 (0.68) 4.07 (0.71) 5.26 (0.74) 4.09 (0.68) 3.81 (0.62) 10.10 34.00 Protein 3.67 (0.41) 3.38 (0.40) 4.02 (0.42) 3.52 (0.39) 3.48 (0.40) 9.84 48.21 Casein 2.88 (0.31) 2.65 (0.30) 3.16 (0.32) 2.77 (0.30) 2.74 (0.30) 10.20 49.40 Lactose 4.79 (0.19) 4.75 (0.18) 4.69 (0.18) 4.76 (0.19) 4.82 (0.20) 6.34 47.22
Groups of FA (g/100 g total FA)
SFA 70.42 (3.38) 70.27 (3.40) 73.47 (3.35) 70.25 (3.46) 68.88 (3.62) 33.29 25.84 UFA 28.97 (3.71) 29.19 (3.74) 25.92 (3.68) 29.23 (3.78) 30.67 (4.00) 28.57 27.07 MUFA 24.24 (3.26) 25.17 (3.23) 22.24 (3.03) 25.16 (3.31) 25.70 (3.55) 26.47 28.35 PUFA 3.02 (0.54) 2.92 (0.55) 2.66 (0.55) 2.92 (0.55) 3.26 (0.59) 38.22 29.21 Trans FA 1.64 (0.58) 2.02 (0.64) 1.22 (0.52) 1.84 (0.59) 1.92 (0.66) 15.18 41.70 SCFA 11.22 (1.09) 10.21 (1.14) 11.64 (0.99) 10.50 (1.13) 10.76 (1.19) 10.26 52.75 MCFA 45.44 (6.88) 43.28 (6.77) 50.17 (6.57) 46.55 (6.77) 41.56 (7.17) 13.17 48.85 LCFA 29.93 (4.35) 31.03 (4.22) 27.31 (4.22) 31.17 (4.36) 31.79 (4.75) 30.25 22.40
Individual FA (g/100 g total FA)
C14:0 12.23 (1.17) 12.22 (1.20) 12.61 (1.11) 12.01 (1.22) 11.95 (1.33) 26.73 23.88 C16:0 31.86 (2.89) 32.68 (3.00) 34.62 (2.85) 32.46 (2.99) 31.04 (3.14) 34.86 26.70 C18:0 9.85 (1.54) 9.37 (1.58) 9.76 (1.38) 10.06 (1.62) 10.26 (1.64) 22.96 33.38 C18:1 20.59 (3.33) 22.23 (3.21) 19.49 (2.97) 21.60 (3.37) 21.81 (3.65) 26.85 29.10
FA = fatty acid, SFA = saturated fatty acids, UFA = unsaturated fatty acids, MUFA = monounsaturated fatty acids, PUFA = polyunsaturated fatty acids, SCFA = short-chain fatty acids, MCFA = medium-chain fatty acids, LCFA = long-chain fatty acids, BS = Brown Swiss, HF = Holstein-Friesian, JE = Jersey, SI = Simmental, AG = Alpine Grey
MCFA, C14:0 and C16:0 content, and lower lactose, UFA, MUFA, PUFA, trans FA, LCFA and C18:1 content compared to the other breeds (Table 1). For traditional traits, the lowest coefficient of vari-ation was observed for lactose percentage (4% for all breeds), and the greatest for SCS which ranged from 52% for JE to 72% for SI. For FA groups, the lowest variability was observed for SFA (5% for all breeds), and the greatest for trans FA which ranged from 32% for SI and HF to 43% for JE (Table 1).
All fixed effects considered in the statistical analysis were significant in explaining the varia-tion of milk yield, composivaria-tion, SCS and FA profile (P < 0.001; Table 1). The proportion of total vari-ance explained by HTD (between 3% and 10%) was lower than for cow effect (between 34% and 50%)
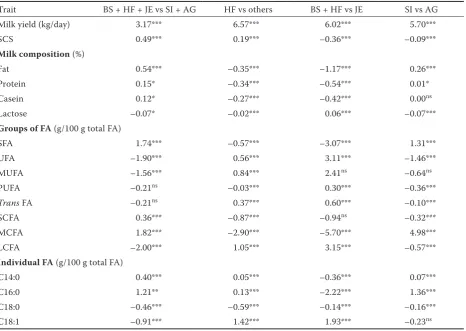
Table 2. Contrast estimates between Least Squares Means of milk yield, somatic cell score (SCS), composition and fatty acid traits for different sets of breeds
Trait BS + HF + JE vs SI + AG HF vs others BS + HF vs JE SI vs AG Milk yield (kg/day) 3.17*** 6.57*** 6.02*** 5.70***
SCS 0.49*** 0.19*** –0.36*** –0.09***
Milk composition (%)
Fat 0.54*** –0.35*** –1.17*** 0.26***
Protein 0.15* –0.34*** –0.54*** 0.01*
Casein 0.12* –0.27*** –0.42*** 0.00ns
Lactose –0.07* –0.02*** 0.06*** –0.07***
Groups of FA (g/100 g total FA)
SFA 1.74*** –0.57*** –3.07*** 1.31***
UFA –1.90*** 0.56*** 3.11*** –1.46***
MUFA –1.56*** 0.84*** 2.41ns –0.64ns
PUFA –0.21ns –0.03*** 0.30*** –0.36***
Trans FA –0.21ns 0.37*** 0.60*** –0.10***
SCFA 0.36*** –0.87*** –0.94ns –0.32***
MCFA 1.82*** –2.90*** –5.70*** 4.98***
LCFA –2.00*** 1.05*** 3.15*** –0.57***
Individual FA (g/100 g total FA)
C14:0 0.40*** 0.05*** –0.36*** 0.07***
C16:0 1.21** 0.13*** –2.22*** 1.36***
C18:0 –0.46*** –0.59*** –0.14*** –0.16*** C18:1 –0.91*** 1.42*** 1.93*** –0.23ns
BS = Brown Swiss, HF = Holstein-Friesian, JE = Jersey, SI = Simmental, AG = Alpine Grey,FA = fatty acid, SFA = saturated fatty acids, UFA = unsaturated fatty acids, MUFA = monounsaturated fatty acids, PUFA = polyunsaturated fatty acids, SCFA = short-chain fatty acids, MCFA = medium-chain fatty acids, LCFA = long-chain fatty acids, ns = not significant, ***P < 0.001, **P < 0.01, *P < 0.05
than multiparous cows, and greater UFA, trans FA and LCFA at the beginning of lactation.
Breed effect. Contrast estimates for the studied traits are reported in Table 2. Comparison between the specialised dairy (BS, HF and JE) and dual-purpose breeds (SI and AG) showed significant differences for all traits, except for PUFA and trans FA content. Specialised dairy cows produced more milk and with greater fat, protein, casein, SCS, SFA, SCFA, MCFA, C14:0 and C16:0, and lower lactose, UFA, MUFA, LCFA, C18:0 and C18:1 contents than milk from dual-purpose cows (P < 0.05). Contrary to our results, Stocco et al. (2017) did not detect differences between dairy and dual-purpose cat-tle breeds for milk yield and SCS, which could be explained by the inclusion of Rendena breed along with SI and AG in dual-purpose breeds group, the considerable lower number of cows and herds,
and lower MCFA content in HF than in other breeds agreed with the greater delta-9 desaturase activity reported for HF compared to BS and JE (Arnould and Soyeurt 2009), which is the enzyme responsible to convert MCFA into MUFA. Within specialised dairy breeds, BS + HF differed from JE breed for all traits (P < 0.001), except for MUFA and SCFA. In particular, JE cows produced less milk with greater SCS and fat, protein, casein, SFA, MCFA, C14:0, C16:0 and C18:0 than other breeds, which agreed with Palmquist et al. (1993), Arnould and Soyeurt (2009) and Ferlay et al. (2011). Hein et al. (2018) have also reported greater SFA, SCFA, MCFA, C16:0, C14:0 and lower C18:0 in Danish Jersey than in Danish Holstein. On the other hand, Stocco et al. (2017) did not detect differences for SCS between BS + HF and JE. Regarding dual-purpose breeds, SI differed from AG for all traits (P < 0.05), except for casein, MUFA and C18:1, being SI the one that produced more milk with greater fat, protein, SFA, MCFA, C14:0 and C16:0. However, Gottardo et al. (2017) have reported the same milk production and SCS in SI and AG, probably due to the greater number of records included in our study.
CONCLUSION
Parity, stage of lactation and breed were important sources of variation for milk traits, including FA composition. Our results demonstrated that although dairy breeds yielded more milk than dual-purpose breeds, milk from the latter exhibited better FA profile for human health. This study also supported the utility of technologies such as MIRS to collect phenotypic information at population level. Further research is needed to deepen the effects of farm characteristics, especially feeding, on the variation of milk FA traits to identify strategies for addressing FA content towards a more desirable profile.
Acknowledgement. The authors gratefully thank the South Tyrolean Dairy Association (Bolzano, Italy) and the Breeders Association of Bolzano province (Bolzano, Italy) for providing the data.
REFERENCES
Arnould V.M.-R., Soyeurt H. (2009): Genetic variability of milk fatty acids. Journal of Applied Genetics, 50, 29–39.
Bauman D.E., Griinari J.M. (2001): Regulation and nutri-tional manipulation of milk fat: Low-fat milk syndrome. Livestock Production Science, 70, 15–29.
Bilal G., Cue R.I., Mustafa A.F., Hayes J.F. (2014): Effects of parity, age at calving and stage of lactation on fatty acid composition of milk in Canadian Holsteins. Canadian Journal of Animal Science, 94, 401–410.
De Marchi M., Toffanin V., Cassandro M., Penasa M. (2014): Invited review: Mid-infrared spectroscopy as phenotyping tool for milk traits. Journal of Dairy Science, 97, 1171–1186. Ferlay A., Glasser F., Martin B., Andueza D., Chilliard Y.
(2011): Effects of feeding factors and breed on cow milk fatty acid composition: Recent data. Bulletin of the Uni-versity of Agricultural Sciences and Veterinary Medicine Cluj-Napoca, Veterinary Medicine, 68, 137–145. Fleming A., Schenkel F.S., Malchiodi F., Ali R.A., Mallard B.,
Sargolzaei M., Jamrozik J., Johnston J., Miglior F. (2018): Genetic correlations of mid-infrared-predicted milk fatty acid groups with milk production traits. Journal of Dairy Science, 101, 4295–4306.
Gilmour A.R., Gogel B.J., Cullis B.R., Welham S.J., Thomp-son R. (2015): ASReml User Guide. VSN International Ltd, Hemel Hempstead, UK.
Gottardo P., Penasa M., Righi F., Lopez-Villalobos N., Cas-sandro M., De Marchi M. (2017): Fatty acid composition of milk from Holstein-Friesian, Brown Swiss, Simmental and Alpine Grey cows predicted by mid-infrared spec-troscopy. Italian Journal of Animal Science, 16, 380–389. Gross J., van Dorland H.A., Bruckmaier R.M., Schwarz F.J. (2011): Milk fatty acid profile related to energy balance in dairy cows. Journal of Dairy Research, 78, 479–488. Hein L., Buitenhuis A.J., Gregersen S.B., Larsen L.B.,
Demi-rovic D., Warnecke S., Nielsen N.H., Munk A., Sorensen L.P., Pedersen J., Kargo M. (2016): Detailed milk fatty acid profiling of the Danish dairy cattle population. 40th ICAR Meeting, Puerto Varas, Chile. Available at: https:// www.icar.org/Documents/Puerto%20Varas%202016%20 Abstracts/files/TS/TS%203/RDY/ICAR%202016%20pa-per_FINAL%20Niels%20nielsen.pdf (accessed May 1, 2018).
Hein L., Sorensen L.P., Kargo M., Buitenhuis A.J. (2018): Genetic analysis of predicted fatty acid profiles of milk from Danish Holstein and Danish Jersey cattle popula-tions. Journal of Dairy Science, 101, 2148–2157. Kelsey J.A., Corl B.A., Collier R.J., Bauman D.E. (2003):
The effect of breed, parity, and stage of lactation on con-jugated linoleic acid (CLA) in milk fat from dairy cows. Journal of Dairy Science, 86, 2588–2597.
and fatty acid composition of Burlina cattle breed. Italian Journal of Animal Science, 15, 576–583.
Palmquist D.L., Denise Beaulieu A., Barbano D.M. (1993): Feed and animal factors influencing milk fat composition. Journal of Dairy Science, 76, 1753–1771.
Penasa M., Tiezzi F., Sturaro A., Cassandro M., De Marchi M. (2014): A comparison of the predicted coagulation characteristics and composition of milk from multi-breed herds of Holstein-Friesian, Brown Swiss and Simmental cows. International Dairy Journal, 35, 6–10.
Stocco G., Cipolat-Gotet C., Bobbo T., Cecchinato A., Bit-tante G. (2017): Breed of cow and herd productivity affect milk composition and modeling of coagulation, curd firm-ing, and syneresis. Journal of Dairy Science, 100, 129–145.
Stoop W.M., van Arendonk J.A.M., Heck J.M.L., van Valen-berg H.J.F., Bovenhuis H. (2008): Genetic parameters for major milk fatty acids and milk production traits of Dutch Holstein-Friesians. Journal of Dairy Science, 91, 385–394. Stoop W.M., Bovenhuis H., Heck J.M.L., van Arendonk
J.A.M. (2009): Effect of lactation stage and energy status on milk fat composition of Holstein-Friesian cows. Jour-nal of Dairy Science, 92, 1469–1478.
Visentin G., Penasa M., Niero G., Cassandro M., De Marchi M. (2018): Phenotypic characterisation of major mineral composition predicted by mid-infrared spectroscopy in cow milk. Italian Journal of Animal Science, 17, 549–556. Wiggans G.R., Shook G.E. (1987): A lactation measure of so-matic cell count. Journal of Dairy Science, 70, 2666–2672.