Supported by the Ministry of Agriculture of the Czech Republic (Project No. QJ1510192).
Performance and Changes in Body Composition of Broiler
Chickens Depending on Feeding Regime and Sex
Eva Tůmová, Darina Chodová*
Department of Animal Husbandry, Faculty of Agrobiology, Food and Natural Resources, Czech University of Life Sciences Prague, Prague, Czech Republic
*Corresponding author: [email protected]
ABSTRACT
Tůmová E., Chodová D. (2018): Performance and changes in body composition of broiler chickens depending on feeding regime and sex.Czech J. Anim. Sci., 63, 518–525.
The differences in the performance, carcass parts, and internal organs of broiler chicken females and males fed ad libitum or restricted by 80 and 65% ad libitum were evaluated. Ross 308 males and females (2430 chickens) were fed ad libitum (ADL) or were restricted in days 8–14 of age by 80% ADL (R1) and 65% ADL (R2), respectively. Feed restriction depressed the live weight (P ≤ 0.001) in both sexes. Both sexes compensated for growth, and at the end of the fattening at 35 days, the restricted males (–3% R1 and –6% R2) and females (–3% R1 and –4% R2) were not significantly lighter than the ADL chickens. Feed intake was lower (P ≤ 0.001) in females than in males, and feed restriction and sex did not affect the feed conversion ratio. The growth of internal organs as early-developing tissues (heart, gizzard, liver) was less affected than the growth of late-developing tissues (breast, thigh, abdominal fat). Restricted males and females had more abdominal fat than the ad libitum chickens (P ≤ 0.05). Differences in allometric growth between males and females were in the liver, breast, and thigh. At the end of the experiment, restricted males had a higher weight of breast and thigh, whereas in females, the weights of both parts were similar to those of the ADL group. During the restriction period, the growth of internal organs is given priority compared to muscles, which was confirmed by allometric growth. Males showed a higher compensatory growth, including the growth of breasts and thighs.
Keywords: chicken; feed restriction; live weight; organ development; carcass composition
Over recent decades, feed restriction programmes have been applied in broiler chickens to reduce metabolic disorders and leg problems. Early feed restriction was first described by Plavnik and Hurwitz (1985). In this type of restriction, the diet of chickens is commonly restricted for the first two weeks of age, and then the depressed growth caused by limited feed intake is usually followed by compensatory growth in the realimentation period (Zubair and Leeson 1996; Govaerts et al. 2000, Tumova et al. 2002; Butzen et al. 2013; van der Klein et al. 2017). The occurrence of
stated that internal organs recovered more quickly than other parts. The growth of broiler chickens is affected by sex, which was found to be a factor that also influences body weight recovery after feed restriction (Tumova et al. 2002; Butzen et al. 2013). In addition, van der Klein et al. (2017) observed that allometric growth curves for all body parts differed between males and females. The literature shows limited data on the effect of feed restriction on body parts development of chicken males and females. Therefore, the aim of this study was to evaluate differences in carcass parts and internal organ development in broiler chicken females and males fed ad libitum or re-stricted (80 and 65% ad libitum).
MATERIAL AND METHODS
In the experiment, 2430 one-day-old Ross 308 chickens were wing banded and assigned to 18 floor pens (135 chickens per pen, 16 birds per m2, males
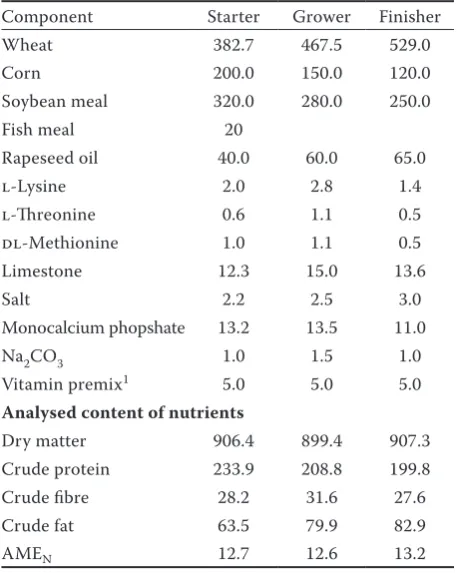
and females were housed separately). Chickens were split into six groups, with 3 replicates per group. Ad libitum group (ADL) was fed ad libitum dur-ing the whole experiment, group R1 was restricted in days 8–14 of age and fed 80% ad libitum, and group R2 was restricted at the same age and fed 65% ad libitum. The same experimental design was applied in males and females. The amount of feed for restricted groups was calculated daily based on the feed intake of ad libitum groups. Birds in restricted groups before and after feed restriction were fed ad libitum. During the entire experiment, chickens were watered ad libitum. Chickens were fattened until 35 days of age and received a com-mercial type of feed mixture. The starter diet was fed until 14 days of age, the grower diet was fed in days 15–28, and the finisher diet was fed until 35 days of age. The composition of feed mixtures is given in Table 1. In feed mixtures, dry matter, crude protein, crude fat, and crude fibre were determined by the methods of AOAC International (1995, 2005) and were described in detail by Skrivanova et al. (2017). The environmental conditions were maintained in accordance with the chickens’ requirements. The lighting regime consisted of 23 h light in days 1–14 and 19 h light in days 15–35 of age. The ex-periment was approved by the Ethics Committee of the Central Commission for Animal Welfare at the Ministry of Agriculture of the Czech Republic.
[image:2.595.304.533.365.652.2]The chickens were individually weighed from the first day of age in a week interval; feed consumption was recorded weekly for each pen. Records were used for the calculation of daily feed intake (FI) and the feed conversion ratio (FCR). Mortality was evaluated in a group over the entire experiment. At the ages of 14, 21, 28, and 35 days, 12 birds from each group (4 birds per pen) were randomly selected for carcass analysis. Birds were slaugh-tered in the experimental slaughterhouse of the International Poultry Testing Station Ustrasice by electrical stunning and bleeding from the jugular vein. Chickens were slaughtered at similar weights at the given age to detect the differences between feeding regimes and the sexes. Immediately after slaughtering, chickens were eviscerated, and their internal organs (gizzard, heart, and liver) were
Table 1. Composition and analysed nutrient content in the experimental feed mixtures (g/kg)
Component Starter Grower Finisher
Wheat 382.7 467.5 529.0
Corn 200.0 150.0 120.0
Soybean meal 320.0 280.0 250.0
Fish meal 20
Rapeseed oil 40.0 60.0 65.0
l-Lysine 2.0 2.8 1.4
l-Threonine 0.6 1.1 0.5
dl-Methionine 1.0 1.1 0.5
Limestone 12.3 15.0 13.6
Salt 2.2 2.5 3.0
Monocalcium phopshate 13.2 13.5 11.0
Na2CO3 1.0 1.5 1.0
Vitamin premix1 5.0 5.0 5.0
Analysed content of nutrients
Dry matter 906.4 899.4 907.3
Crude protein 233.9 208.8 199.8
Crude fibre 28.2 31.6 27.6
Crude fat 63.5 79.9 82.9
AMEN 12.7 12.6 13.2
AMEN = apparent metabolizable energy (MJ)
1vitamin-mineral premix provided per kg of diet: retinyl
weighed. After evisceration, carcasses were chilled overnight at 4°C, and then carcass weight, breast weight, thigh weight, and abdominal fat weight were measured. The weights of organs, carcass, and carcass cuts were used for the calculation of growth. The allometric growth was calculated using the formula of Huxley and Teissier (1936):
y = b × xk
where:
y = weight of the organ or carcass part
b = constant (origin index)
x = live weight
k = allometric growth constant
Individual data of body weight and feed con-sumption were processed by two-way analysis of variance, with sex and group as the main factors, using the ANOVA procedure of the SAS 9.4 for Windows, 2013. The carcass composition and the allometric growth of organs were evaluated by three-way analysis on the interaction of sex, group, and age. The statistically significant differences (P < 0.05) are indicated by different superscripts.
RESULTS AND DISCUSSION
The results of growth (Figure 1) show significant differences between males and females during the entire experiment. Feed restriction depressed live weight (P ≤ 0.001) in both sexes, with a higher
re-duction in males. At the end of feed restriction at 14 days of age, the live weight of restricted males in group R1 fed 80% ad libitum reached 73% of the live weight of the ADL males and 69% of the live weight of the group R2 males fed 65% ad libi-tum. A similar trend was found in females whose live weight in R1 reached 81% of that in the ADL group, and in R2 reached 78% of that in the ADL group. Restricted chickens had a significantly lower live weight until the end of the fattening period at 35 days than the ADL ones. Restricted males showed a lower final live weight of approximately –3% in R1 and –6% in R2, whereas in females, lower final live weights were approximately –3% in R1 and –4% in R2. These results are in accord with the findings of Lippens et al. (2000). In con-trast, Zhan et al. (2007) and Butzen et al. (2013) observed that restricted chickens recovered their live weight. Data of the present study show that in males the feed restriction caused a higher depres-sion of growth; however, in the realimentation period, restricted males of both groups managed to overcome the growth depression better than the restricted females, which corresponds with the previous studies (Plavnik and Hurwitz 1991; Tumova et al. 2002; van der Klein et al. 2017).
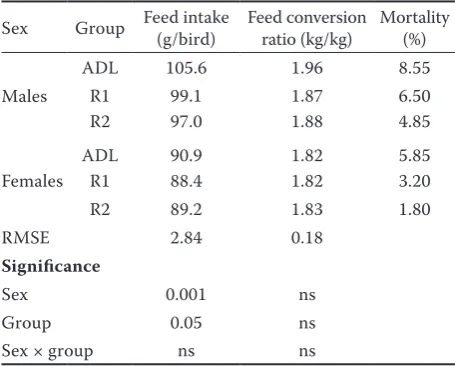
[image:3.595.304.532.534.717.2]The effect of feed restriction on feed consump-tion and mortality is presented in Table 2. As expected, FI was lower (P ≤ 0.001) in females than in males. Restricted chickens consumed less feed
Figure 1. Live weight of broiler chickens in relation to feeding regime and sex
Table 2. Feed consumption and mortality during the entire experiment (1–35 days of age)
Sex Group Feed intake (g/bird) Feed conversion ratio (kg/kg) Mortality (%)
Males
ADL 105.6 1.96 8.55
R1 99.1 1.87 6.50
R2 97.0 1.88 4.85
Females
ADL 90.9 1.82 5.85
R1 88.4 1.82 3.20
R2 89.2 1.83 1.80
RMSE 2.84 0.18
Significance
Sex 0.001 ns
Group 0.05 ns
Sex × group ns ns
RMSE = root mean square error, ADL = ad libitum feeding, R1 = feeding 80% ad libitum in days 8–14 of age, R2 = feed-ing 65% adlibitum in days 8–14 of age, ns = not significant
1000 1500 2000 2500
ve w
ei
gh
t (
g)
Male ADL Male R1 Male R2 Female ADL Female R1 Female R2
0 500
1 7 14 21 28 35
Li
v
Age (days)
Age (days)
Live
weig
ht
[image:3.595.63.290.536.720.2]than the ADL chickens (P ≤ 0.05), without the effect of intensity of feed restriction. Lower FI of restricted chickens is assumed to be related to lower maintenance requirements during feed restriction and may support compensatory growth in the realimentation period. Lower FI can result in better FCR. However, in the present study, FCR was not affected by the group or sex of chickens and is in agreement with Tumova et al. (2002), Butzen et al. (2013), and van der Klein (2017). Mortality was lower in the female restricted chickens and decreased with the intensity of restriction. In the present study, lower mortality of restricted chickens was related to a lower incidence of the “sudden death syndrome”, which is also described by Lippens et al. (2000).
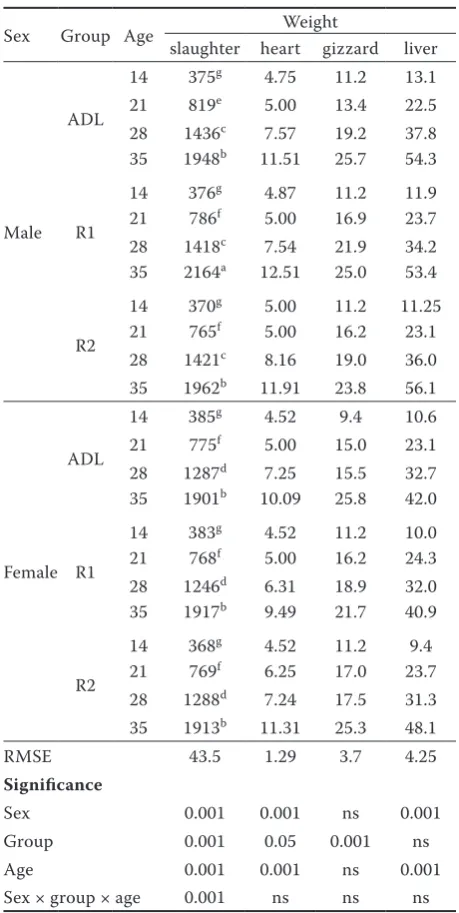
The weight of internal organs (Table 3) was not affected by the interaction of sex, group, and age. The heart weight was significantly higher in males, and in both sexes, it increased with age (P ≤ 0.001). Regarding the feeding regime, a significant effect was observed at the end of feed restriction (at 14 days of age), the heart weight was higher in restricted males, but there was no effect on the heart weight of females. A higher intensity of feed restriction in males increased the heart weight as compared to ADL chickens (+2.5 and +5% in the R1 and R2 groups, respectively). A higher heart weight at the end of feed restriction was considered to be explained by the results of a study in sheep con-ducted by Santos et al. (2018), in which the greater weight of the heart in restricted lambs could have been caused by an impairment of mitochondrial metabolism caused by the lack of nutrients during early life. Similarly, different effects of feed restric-tion and its intensity in males and females on heart weight occurred at the end of the fattening period. In restricted males, the heart weight was higher (+8 and +3%), but in R1 group females, with a lower intensity of feed restriction, the measurement was lower by –6%, while in R2 group females, the meas-urement was higher by +12%. Mohammadalipour et al. (2017) suggested that the higher heart mass of restricted chickens increased oxygen supply for a higher metabolic rate, which was assumed to be the case of males. In Table 3, gizzard weight was lower (P ≤ 0.001) in restricted chickens, which is in accord with Wang et al. (2017), who observed a lower gizzard proportion in protein-restricted ducks. The lower gizzard weight of restricted chickens might decrease the FI of these groups; therefore, it
[image:4.595.303.533.221.678.2]could be assumed that the compensatory growth of restricted chickens was supported by the improved digestibility of nutrients. Liver weight was higher in males (P ≤ 0.001) and increased with advanc-ing age (P ≤ 0.001). However, the feeding regime did not affect liver weight and corresponds with Susbilla et al. (1994) and Mohammadalipour et al.
Table 3. Slaughter weight and weight of internal organs (g)
Sex Group Age slaughter heart gizzardWeight liver
Male ADL
14 375g 4.75 11.2 13.1
21 819e 5.00 13.4 22.5
28 1436c 7.57 19.2 37.8
35 1948b 11.51 25.7 54.3
R1
14 376g 4.87 11.2 11.9
21 786f 5.00 16.9 23.7
28 1418c 7.54 21.9 34.2
35 2164a 12.51 25.0 53.4
R2
14 370g 5.00 11.2 11.25
21 765f 5.00 16.2 23.1
28 1421c 8.16 19.0 36.0
35 1962b 11.91 23.8 56.1
Female ADL
14 385g 4.52 9.4 10.6
21 775f 5.00 15.0 23.1
28 1287d 7.25 15.5 32.7
35 1901b 10.09 25.8 42.0
R1
14 383g 4.52 11.2 10.0
21 768f 5.00 16.2 24.3
28 1246d 6.31 18.9 32.0
35 1917b 9.49 21.7 40.9
R2
14 368g 4.52 11.2 9.4
21 769f 6.25 17.0 23.7
28 1288d 7.24 17.5 31.3
35 1913b 11.31 25.3 48.1
RMSE 43.5 1.29 3.7 4.25
Significance
Sex 0.001 0.001 ns 0.001
Group 0.001 0.05 0.001 ns
Age 0.001 0.001 ns 0.001
Sex × group × age 0.001 ns ns ns
RMSE = root mean square error, ADL = ad libitum feeding, R1 = feeding 80% ad libitum in days 8–14 of age, R2 = feeding 65% adlibitum in days 8–14 of age
a–gstatistically significant differences (P ≤ 0.05) within
(2017). Govaerts et al. (2000) observed a signifi-cant interaction between feeding regime and age, which resulted in a higher liver proportion after feed restriction compared to chickens fed ad libi-tum; however, differences were not detected in the realimentation period. The discrepancy between studies may be due to differences in the intensity of feed restriction and corresponds with the finding of Govaerts et al. (2000), which is that less severe restriction and maintenance do not have to be sustained by liver breakdown.
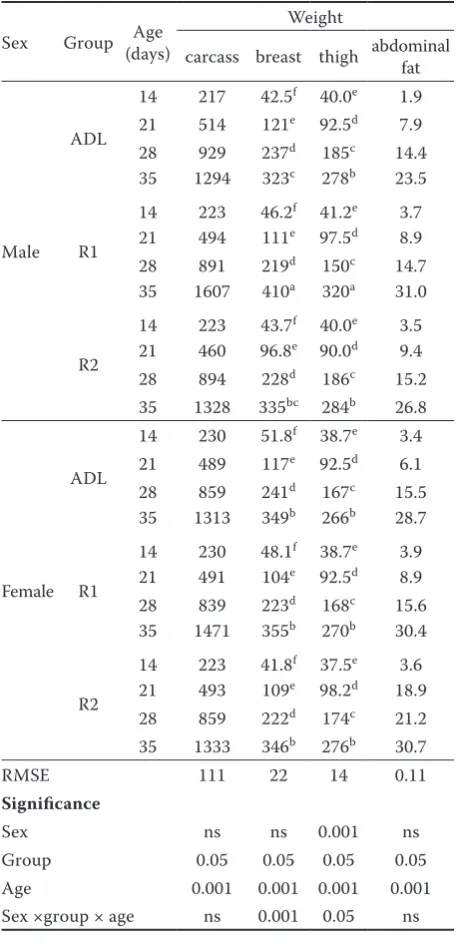
Feed restriction also modifies the body composition (Table 4). Breast weight was affected by the feeding regime (P ≤ 0.05), age (P ≤ 0.001), and the interaction of sex, group, and age (P ≤ 0.001). The interaction shows that, after feed restriction, breast weight was higher in restricted males (+9% in R1 and +3% in R2) but lower in females (–7% in R1 and –19% in R2). At the end of the experiment, breast weight in restricted males was higher (+27% for R1 and +4% for R2), whereas in restricted females, breast weight was higher in R1 (+2%) but negligibly lower in R2 (–1%). Significant differences between the groups were observed only at the end of the experiment. These results indicate that less intensive restriction had a positive effect on breast growth, and at 35 days of age, males and females in R1 had significantly higher breast weight than ADL chickens. Govaerts et al. (2000), Lippens et al. (2000), and Butzen et al. (2013) did not find significant differences in the proportional breast weight based on the feeding regime. Differences between the present study and the literature can be related to different methods of feed restriction. The significant effects of sex, group, age and their interaction were observed in thigh weight. Although there were no significant differences between groups at 14, 21, and 28 days of age, at 35 days the significantly highest thigh weight was in R1 males, whereas in other groups thigh weight did not differ. Similarly, Lippens et al. (2000) observed a higher proportion of thighs in chickens fed 80% ad libitum.
The weight of abdominal fat was not affected by the sex of chickens, which is in contrast with the findings of Lippens et al. (2000) and van der Klein et al. (2017). de Souza Khatlab et al. (2018) revealed that a higher fat content in females is related to a higher expression of the fatty acid synthase gene. As expected, abdominal fat weight significantly increased with advancing age. Restricted males and females had a higher (P ≤ 0.05) abdominal fat weight
[image:5.595.304.533.210.683.2]than ADL chickens, which is similar to the findings of Lippens et al. (2000). The effect of feed restriction on abdominal fat content is not clear, which was also proven in the literature, where we can find that the measurement of abdominal fat weight was not affected by the feeding regime (Susbilla et al. 1994;
Table 4. Weight and carcass components (g)
Sex Group Age (days)
Weight
carcass breast thigh abdominal fat
Male ADL
14 217 42.5f 40.0e 1.9
21 514 121e 92.5d 7.9
28 929 237d 185c 14.4
35 1294 323c 278b 23.5
R1
14 223 46.2f 41.2e 3.7
21 494 111e 97.5d 8.9
28 891 219d 150c 14.7
35 1607 410a 320a 31.0
R2
14 223 43.7f 40.0e 3.5
21 460 96.8e 90.0d 9.4
28 894 228d 186c 15.2
35 1328 335bc 284b 26.8
Female ADL
14 230 51.8f 38.7e 3.4
21 489 117e 92.5d 6.1
28 859 241d 167c 15.5
35 1313 349b 266b 28.7
R1
14 230 48.1f 38.7e 3.9
21 491 104e 92.5d 8.9
28 839 223d 168c 15.6
35 1471 355b 270b 30.4
R2
14 223 41.8f 37.5e 3.6
21 493 109e 98.2d 18.9
28 859 222d 174c 21.2
35 1333 346b 276b 30.7
RMSE 111 22 14 0.11
Significance
Sex ns ns 0.001 ns
Group 0.05 0.05 0.05 0.05
Age 0.001 0.001 0.001 0.001
Sex ×group × age ns 0.001 0.05 ns RMSE = root mean square error, ADL = ad libitum feeding, R1 = feeding 80% ad libitum in days 8–14 of age, R2 = feeding 65% adlibitum in days 8–14 of age
a–fstatistically significant differences (P ≤ 0.05) within
Lippens et al. 2009) or was lower (Wijtten et al. 2010; van der Klein et al. 2017). The discrepancies among studies may be associated with restriction type and intensity, and more research is needed.
The allometric growth coefficient of internal or-gans and carcass parts is given in Table 5. Internal organs are assumed to be early maturing, which confirm lower coefficients of growth allometry than in heart, gizzard, and liver; this is in line with the results of Govaerts et al. (2000) and van der Klein et al. (2017). The heart allometric growth of restricted males and females was negligibly higher in the first week of the realimentation period compared to the ADL chickens. However, in the second week of realimentation it was lower (P ≤ 0.05) than in the ADL chickens. Slow allometry growth of the heart continued in the last week of the experiment and the differences between restricted and ad libitum groups were not significant. A similar trend in heart growth was observed by van der Klein et al. (2017).
Development of the gizzard was positively affected by feed restriction, and coefficients of allometry were lower in restricted groups and significantly lower in the last week of the fattening period. Liver allometric growth indicates that in the first week after feed restriction, coefficients of allometry were lower in females (P ≤ 0.001) than in males and in restricted groups (P ≤ 0.001) than in ADL chickens. At 35 days of age, higher coefficients were observed in males (P ≤ 0.001) and ADL chickens (P ≤ 0.05). van der Klein et al. (2017) observed similar trends in the allometric growth of the liver. The liver plays an important role in lipogenesis, and a larger liver weight may indicate higher hepatic activity, which may lead to a higher fat deposition; therefore, the higher abdominal fat weight of restricted chickens in the present study could be a result of this me-tabolism level.
[image:6.595.62.535.389.718.2]Coefficients of allometry of the breast, thigh, and abdominal fat were higher than 1 and pointed
Table 5. Coefficients of growth allometry
Measurement Age (days) Male Female RMSE Significance
ADL R1 R2 ADL R1 R2 sex group sex × group
Carcass
21 1.11a 1.08b 1.04c 1.09ab 1.08b 1.07b 0.06 ns ns 0.05
28 1.05 1.00 1.07 1.11 1.07 1.07 0.08 ns ns ns
35 1.09 1.34 1.22 1.08 1.31 1.11 0.09 ns 0.05 ns
Heart
21 0.26 0.30 0.37 0.31 0.32 0.55 0.02 ns ns ns
28 0.93 0.65 0.65 0.83 0.43 0.70 0.03 ns 0.05 ns
35 1.41 1.21 1.18 1.11 0.99 1.14 0.03 ns ns ns
Gizzard
21 0.50 0.64 0.65 0.78 0.62 0.74 0.03 ns ns ns
28 0.78 0.55 0.52 0.70 0.40 0.68 0.03 ns ns ns
35 0.95 0.52 0.88 1.32 0.50 1.04 0.03 ns 0.05 ns
Liver
21 0.68 0.96 1.16 1.11 1.27 1.28 0.04 0.001 0.001 ns
28 0.94 0.62 0.72 0.70 0.55 0.54 0.03 ns ns ns
35 1.37 1.02 1.36 0.65 0.59 1.11 0.04 0.001 0.05 ns
Breast
21 1.35 1.18 1.09 1.16 1.11 1.27 0.02 ns ns ns
28 1.21 1.17 1.39 1.42 1.52 1.42 0.02 0.001 ns ns
35 1.02 1.52 1.17 0.95 1.11 1.09 0.04 ns ns ns
Thigh
21 1.14 1.17 1.13 1.24 1.25 1.28 0.02 0.05 ns ns
28 1.13 1.13 1.17 1.17 1.17 1.15 0.02 ns ns ns
35 1.31 1.26 1.31 1.18 1.17 1.60 0.03 ns ns ns
Abdominal fat
21 1.92 1.61 1.31 1.26 1.40 1.16 0.01 ns ns ns
28 1.61 1.57 1.14 1.21 1.52 1.14 0.01 ns ns ns
35 1.21 1.97 1.64 1.97 1.60 1.21 0.01 ns ns ns
RMSE = root mean square error, ADL = ad libitum feeding, R1 = feeding 80% ad libitum in days 8–14 of age, R2 = feeding 65% adlibitum in days 8–14 of age
to their late maturing. Breast growth was lower in females and significantly lower in the second week after restriction. On the other hand, the feeding regime did not affect breast allometric growth. Similarly, Govaerts et al. (2000) stated that dif-ferences in the growth of the breasts of ADL and restricted chickens disappeared at slaughter age. However, van der Klein et al. (2017) observed that the allometric growth curve of the breast muscle was shifted further upward in females than in males. The thigh allometry coefficient was significantly higher only in females in the first week after restric-tion. In the rest of the experiment, neither sex nor the feeding regime affected the parameter which corresponds with Govaerts et al. (2000) and van der Klein et al. (2017). No significant effect of sex or feeding regime was observed in the allometric coefficient of abdominal fat, which corroborates with Govaerts et al. (2000); however, van der Klein et al. (2017) observed that the allometric growth curve was significantly different between males and females, and markedly lower in restricted groups. Higher allometry coefficients of the abdominal fat compared to the breast or thigh coefficients indicate that the abdominal fat is a very late ma-turing tissue. Numerically lower coefficients of the abdominal fat allometry of restricted groups indicate higher lipogenesis related to higher fat deposition in these groups in the present study.
To sum up, the results indicate that feed restric-tion at 80 and 65% ad libitum impaired growth and feed intake; however, it reduced the mortality of the chickens. During the restriction period, growth of internal organs is given priority com-pared to muscle growth, which was confirmed by the allometric growth. Males showed a higher compensatory growth, including the growth of breasts and thighs. On the other hand, restricted chickens showed a higher content of abdominal fat, which was assumed to be a result of higher lipogenesis in the liver. The results of the present study confirmed some of the data found in the literature, but some processes are still unclear, and more research is needed.
REFERENCES
AOAC International (1995): Official Methods of Analysis. 16th Ed. Association of Official Analytical Chemists,
Arlington, USA.
AOAC International (2005): Official Methods of Analysis. 18th Ed. Association of Official Analytical Chemists,
Gaithersburg, USA.
Butzen F.M., Ribeiro A.M.L., Vieira M.M., Kessler A.M., Dadalt J.C., Della M.P. (2013): Early feed restriction in broilers. I – Performance, body fraction weights, and meat quality. The Journal of Applied Poultry Research, 22, 251–259.
de Souza Khatlab A., Del Vesco A.P., Gasparino E., de Oli-veira Neto A.R. (2018): Gender and age effects on the expression of genes related to lipid metabolism in broiler liver. Czech Journal of Animal Science, 63, 103–109. Fontana E.A., Weaver Jr. W.D., Denbow D.M., Watkins B.A.
(1993): Early feed restriction of broilers: effects on ab-dominal fat pad, liver and gizzard weights, fat deposition, and carcass composition. Poultry Science, 72, 243–250. Govaerts T., Room G., Lippens M., De Groote G., Decuy-pere E. (2000): Early and temporary quantitative food restriction of broiler chickens. 2. Effects on allometric growth and growth hormone secretion. British Poultry Science, 41, 355–362.
Huxley J.S., Teissier G. (1936): Terminology of relative growth. Nature, 137, 780–781.
Lippens M., Room G., De Groote G., Decuypere E. (2000): Early and temporary quantitative food restriction of broiler chickens. 1. Effects on performance characteris-tics, mortality and meat quality. British Poultry Science, 41, 343–354.
Lippens M., Delezie E., Maertens L., Huyghebaert G. (2009): Influence of feed texture and early quantitative feed restriction on performance, growth development and carcass composition of two broiler strains. Archiv fur Geflugelkunde, 73, 1–12.
Mohammadalipour R., Rahmani H.R., Jahanian R., Riasi A., Mohammadalipour M., Nili N. (2017): Effect of early feed restriction on physiological responses, performance and ascites incidence in broiler chickens raised in normal or cold environment. Animal, 11, 219–226.
Plavnik I., Hurwitz S. (1985): The performance of broiler chicks during and following a severe feed restriction at an early age. Poultry Science, 64, 348–355.
Plavnik I., Hurwitz S. (1991): Response of broiler chickens and turkey poults to food restriction of varied severity during early life. British Poultry Science, 32, 343–352. Saleh E.A., Watkins S.E., Waldroup A.L., Waldroup P.W.
(2005): Effects of early quantitative feed restriction on live performance and carcass composition of male broilers grown for further processing. Journal of Applied Poultry Research, 14, 87–93.
liver proteome of fattening lambs are modified by feed restriction during the suckling period. Animal, 12, 1–9. Skrivanova V., Tumova E., Englmaierova M., Chodova D.,
Skrivan M. (2017): Do rearing system and free-range stocking density affect meat quality of chicken fed feed mixture with rapeseed oil? Czech Journal of Animal Sci-ence, 62, 141–149.
Susbilla J.P., Frankel T.L., Parkinson G., Gow C.B. (1994): Weight of internal organs and carcass yield of early food restricted broilers. British Poultry Science, 35, 677–685. Tumova E., Skrivan M., Skrivanova V., Kacerovska L. (2002): Effect of early feed restriction on growth in broiler chick-ens, turkeys and rabbits. Czech Journal of Animal Science, 10, 418–428.
van der Klein S.A., Silva F.A., Kwakkel R.P., Zuidhof M.J. (2017): The effect of quantitative feed restriction on al-lometric growth in broilers. Poultry Science, 96, 118–126. Wang S.P., Wang W.J., Yang D.S., Yhao X.L., Luo D.M., Guo Y.B. (2017): Growth, carcass, and physiological traits of
growing male China micro-duck fed various levels of dietary crude fibre. Czech Journal of Animal Science, 62, 347–356.
Wijtten P.J.A., Hangoor E., Sparla J.K.W.M., Verstegen M.W.A. (2010): Dietary amino acid levels and feed re-striction affect small intestinal development, mortality, and weight gain of male broilers. Poultry Science, 89, 1424–1439.
Zhan X.A., Wang M., Ren H., Yhao R.Q., Li J.X., Tan Z.L. (2007): Effect of early feed restriction on metabolic pro-gramming and compensatory growth in broiler chickens. Poultry Science, 86, 654–660.
Zubair A.K., Leeson S. (1996): Compensatory growth in the broiler chickens: A review. World’s Poultry Science Journal, 52, 189–201.