Abstract—Multiple jet impingement is a technology widely implemented in the reflow soldering process. Forced convection through jet impingement allows high average heat transfer coefficients and increases the uniformity of the heat transfer over the target surface. These characteristics are required to enhance the process and to avoid local hot (or cold) spots. To reduce products defects, all the variables identified in reflow soldering need to be controlled. Generating such data from experimentation is quite demanding in terms of planning, facilities and cost of experimentation. In that sense, to improve the industrial process and to reduce time and costs, the introduction of the computational simulation plays an important role. Considering the relevance of this area for the industry, this paper presents the numerical modeling of multiple jets impinging on a target surface using the SST k-ω model, considered by recent authors as the most appropriate turbulence model for jet impingement simulation. Through the CFD study, it is possible to analyze the flow behavior of the jets but also the variation of the surface temperature with time. Results revealed an accurate simulation of the jets flow field from the nozzle plate to the target surface. The jet-to-jet and jet-to-plate interactions were clearly identified, proving that the variables identified in a multiple jet system need to be cautiously analyzed since they interfere with the performance of the heat transfer over the target surface.
Index Terms— Jet impingement, reflow soldering, heat transfer, numerical simulation.
I. INTRODUCTION
ne of the methodologies used to produce Printed Circuit Boards (PCB) is called Surface Mount Technology (SMT).
Manuscript received March 6, 2018; revised March 27, 2018.
F. V. Barbosa, MEtRICs I&D Centre, Department of Mechanical Engineering, University of Minho, Guimarães, Portugal (e-mail: [email protected]).
J. P. V. Silva, MEtRICs I&D Centre, Department of Mechanical Engineering, University of Minho, Guimarães, Portugal (e-mail: [email protected]).
S. F. C. F. Teixeira, ALGORITMI I&D Centre, Department of Production and Systems, University of Minho, Guimarães, Portugal (e-mail: [email protected]).
D. F. Soares, MEtRICs I&D Centre, School of Engineering, University of Minho, Guimarães, Portugal (e-mail: [email protected]).
D. N. F. S. Santos, Bosch Car Multimédia (CM/MFT3), Braga, Portugal (e-mail: [email protected]).
I. A. C. C. F. Delgado, Bosch Car Multimédia (CM/MFT3), Braga, Portugal (e-mail: [email protected]).
J. C. F. Teixeira, MEtRICs I&D Centre, Department of Mechanical Engineering, University of Minho, Guimarães, Portugal (e-mail: [email protected]).
[image:1.595.304.547.428.513.2]This process consists in the deposition of the solder paste onto the pads of the PCB, known as a stencil printing process, followed by the components placement on the pasted pads. To attach the electronic components to the PCB, the reflow soldering is the technology usually applied [1]. This process heats the entire assembly to a temperature beyond the melting point of the solder paste which wets the contact surfaces and forms the joint [2]. Reflow soldering is commonly achieved using an oven which contains a number of independently controllable heating zones, as it can be observed in Fig. 1. These heating zones typically deliver heat to the assembly through the convective process [1] which is ensured by the multiple air jet impingement technology. The heating performance of convective reflow ovens mainly depends on the heat transfer coefficient which is influenced by several variables [2]. In that sense, to understand all these parameters and to ensure a good performance of the reflow process, a detailed analysis of the multiple jet impingement process is mandatory.
Fig. 1. Typical heating system in the reflow oven.
Multiple air jet impingement consists in directing jets flows through several nozzles with a specific shape and configuration over a target surface [3], as it can be observed in Fig. 2. However, due to several interactions that occur during the impingement, the study of the flow field is complex. The individual jets of a multi-jet configuration are affected by three types of interactions: jet interaction between adjacent jets prior the surface impingement [4]; the jet-to-jet interaction among the adjacent jets after the surface impingement; and the crossflow interaction, i.e. reverse air flow interacts with the path of impinging jets when flowing toward the exhaust [5]. Geers et al. (2004) observed through Particle Image Velocimetry (PIV) technique that the jet-to-jet interaction is mainly caused by upwash flows (upward movement of the air outside the vortex) which result from the collision of wall jets, leading to an increase of the axial velocity gradient in the jets shear layers [6]. Regarding the effect of the interaction due to collision of surface flows, secondary stagnation zones are generated. These stagnation zones are characterized by boundary layer separation and vortices. This phenomenon was also observed experimentally by [7], who mentioned
Multiple Jet Impingement in Reflow Soldering
– a Numerical Approach
Flávia V. Barbosa, João P. V. Silva, Senhorinha F. C. F. Teixeira, Delfim F. Soares, Duarte N. F. S.
Santos, Isabel A. C. C. F. Delgado, José Carlos. F. Teixeira
that after the jet impingement, the adjacent jets interact to each other generating vortex rings around them. While in the central jet the vortex ring is closed, in the jets located around the central jet, the vortex flows toward the sidewalls. The heat transfer performance that can be obtained from multiple jet impingement is influenced by several variables [8] such as: jets configuration (inline or staggered), nozzle shape (circular, triangular, etc.), jet spacing (S), jet-to-plate spacing (H) and Reynolds number which depends on the jet temperature, jet diameter, D, and jet velocity Ujet. In
[image:2.595.59.280.201.347.2]that sense, the study of the influence of these variables in the heat transfer efficiency is fundamental.
Fig. 2. Multiple jet impingement configuration.
Even if the reflow soldering process is a technology applied worldwide, the homogeneity and the efficiency of the heat transfer have a strong influence on the temperature profile of reflow ovens [2]. To reduce products defects, all the parameters of the reflow soldering need to be controlled. However, generating such data from experimentation is quite demanding in terms of planning, facilities and cost of experimentation. To improve the process and to reduce time and costs, the introduction of the computational simulation is an added value for the industry. In that sense, a Computational Fluid Dynamic (CFD) software can become quite useful in obtaining a first estimation of the flow structure [9]. To develop the numerical simulation of the process, several studies such as [10], [11] and [2] used the CFD software ANSYS FLUENT, specially designed to predict the fluid behavior. This is an important tool to solve engineering problems, allowing the prevention of problems in the initial phase of the project, well before the manufacturing of the PCB.
Considering these advantages, the numerical simulation has been a tool widely implemented in jet impingement studies. The fast advancement of computational resources and numerical algorithms have led to an improvement of the accuracy of the models used to study impinging flows and heat transfer. Most of industrial applications that use jet impingement are governed by turbulent flows which is the case of the reflow soldering process. Nevertheless, these flows represent a great challenge to predict the behavior of jets with accuracy. In this way, several turbulent models have been developed to obtain the most accurate results at a short time. According to several authors, it appears that the Shear Stress Transport (SST) k-ω turbulence model was revealed both accurate and computing time saving in engineering applications. Comparing with others, this model seems to be the most appropriate for simulation of jet
impingement. Zu et al. (2009), who compared different turbulence models with experimental data, mentioned that the SST k-ω model presents a better compromise between computational costs and accuracy [12]. Later, Ortega & Ortiz (2014) verified a good agreement between numerical and experimental data using this turbulence model, being registered a maximum deviation of 8% [13]. In addition, [14] confirmed the good accuracy of the SST k-ω model especially in the stagnation zones of the jets. A recent study performed by [15] revealed that the heat transfer characteristics are better predicted by SST k-ω model, mainly due to its ability to predict with accuracy regions with high pressure gradients. Considering the advantages of the SST k-ω model for the numerical modelling of jet impingement systems, it was applied in this study.
II. NUMERICAL MODELLING A. Physical Domain and Boundary Conditions
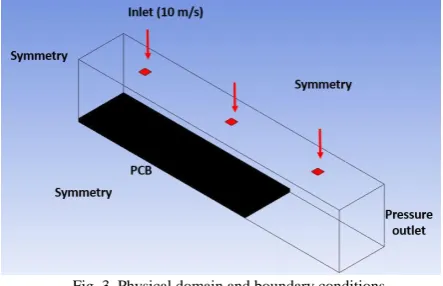
The computational model used in the numerical simulations was inspired in the reflow soldering technology applied in industrial processes. In that sense, the geometric specifications identified in the industrial oven were implemented in the numerical model, specifically the jet-to-jet distance, the target surface dimensions and the nozzle-to-plate distance. The reflow soldering process consists of an array of more than two hundred jets, however, this study will focus in three jets aligned in order to simplify the computational model but ensuring the analysis of the interference between jets. The air flows through circular nozzles with a diameter of 4.2 mm, impinging vertically a flat plate positioned at the center of the heating chamber. After the impingement, the flow escapes in a side wall parallel to the jet axis. The jet temperature is kept at 255ºC and the air velocity was considered 10 m/s. Regarding the target plate, the material considered was cooper with an initial temperature of 20ºC. Fig.3 presents the boundary conditions, a pressure outlet was considered at the outlet and symmetry conditions were applied in three faces of the domain. This allows the reduction of the overall size of the computational model ensuring that the influence of the remaining jets is considered in the numerical simulation.
Fig. 3. Physical domain and boundary conditions.
B. Mesh
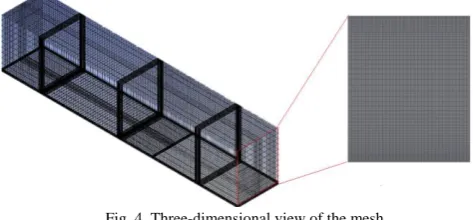
[image:2.595.316.538.572.715.2]the quality of the results, the mesh was refined in the near wall region, near nozzle region and jet shear layer, as it can be observed at the bottom and top of the highlighted part of the mesh presented in Fig. 4. In order to obtain a reasonable mesh without excessively increase the overall mesh size and to reach a higher accuracy level, several hypotheses were considered. Skewness, aspect ratio and element quality factors were used as criteria for element’s evaluation and all presented values between the recommendation range. The final mesh has approximately 289,695 elements.
Fig. 4. Three-dimensional view of the mesh.
[image:3.595.48.290.352.450.2]In order to analyze the influence of the nozzle shape geometry, two computational models were generated, one with circular nozzles and another with square nozzles as it can be observed in Fig. 5 (a) and (b) respectively.
Fig. 5. Grid mesh of the jets (a) circular (b) square.
C. Mathematical Model
To obtain the evolution of the jets from the nozzle plate to the target surface, the governing Reynolds-averaged Navier-Stokes equations are applied in the numerical calculations performed by the CFD software. The equations of continuity (1), momentum (2) and energy (3) are the following:
0
i
i
U x
(1)
' '
j i j
i i j
i j i j j
U P U U
U u u
x x x x x
(2)
'
' Pr
i i
i i i
T T
U u T
x x x
(3)
Where P, T and Ui are the time averaged pressure,
temperature and velocity of the fluid, respectively, while u’i
and T’ are the fluctuation components of velocity and temperature [14].
As mentioned before, the SST k-ω model was selected for the numerical simulation of the multiple jet impingement. This model, developed by Menter (1994) [16], applies the k-ω model in the near wall region and switches to the k-ε model in the far field, combining the advantages of both
models. k-ω model performs much better than k-ε model for boundary layer flows, however, it is excessively sensitive to the freestream value of ω which is not the case of the k-ε model. To describe the flow near a wall, the SST k-ω model uses a low-Reynolds number approach allowing the consideration of the details in the viscous sublayer [17]. The equations of the turbulence kinetic energy, k, and the specific dissipation rate, ω, are presented in (4) and (5) respectively:
( ) ( i) k k k k
i j j
k
k ku G Y S
t x x x
(4)
( ) ( i)
i j j
k
u G Y D S
t x x x
(5)
Where Г represents the effective diffusivity, G the generation and Y the dissipation of the corresponding variables; Dω is the cross-diffusion term while Sk and Sωare
the user-defined source terms [14]. D. Discretization and Algorithm
The numerical simulations were performed using the commercial flow solver ANSYS FLUENT 18.2.0. SIMPLE algorithm is applied to solve the pressure-velocity coupling. In terms of spatial discretization of momentum, a second-order upwind was imposed while for the dissipation rate and turbulent kinetic energy, a first order upwind was applied. The computational models were solved using a transient formulation based on a first-order implicit method and the convergence criterion of 1E-3 for continuity, momentum and turbulence equations and 1E-6 for energy equation.
III. RESULTS AND DISCUSSION
The numerical results present the jet flow behavior during the impingement over a target surface and the variation of the surface temperature for both circular and square jets models. In addition, an analysis of the jets interference in the nozzle array was performed. Considering the relevance of thermal cycles in reflow soldering, a typical thermal profile applied in industrial processes was modelled numerically using an User Defined Function (UDF).
A. Jet Flow Development with Time
To analyze the influence of the nozzle shape in the variation of the jet flow behavior, the two numerical models presented above were analyzed. Regarding the jet flow development with time, the simulations of both cases were compared at a specific time of 60 s, being the results presented in Fig.6. Through the analysis of the velocity vectors, it seems that the jet’s behavior from the nozzle plate to the target surface is similar in both cases, representing a typical jet impingement behavior. As soon as the jets leave the nozzles, the fluid is dragged radially towards the jets from the surrounding, inducing vortices around jets. These results are in accordance with experimental data obtained through PIV visualization by [18], [19] and [7].
Comparing the flow field in both cases, it appears that the first jet impinges a higher area of the flat plate interacting with the central jet flow. This interaction is more (a)
pronounced in the circular nozzle case. As it can be observed in Fig. 6 (a), the vortex generated in the left side of the central jet has such proportions that it interferes with the jet flow before the impingement on the target surface. However, the jet located just before the outlet presents a flow behavior slightly different. This is due to the crossflow effect, i.e. the reverse air flow interacts with the path of impinging jets when flowing toward the outlet. This leads to a deviation of the jet flow from the jet axis in direction to the outlet. The flow behavior of this last jet inhibits the formation of the vortex in the right side of the central jet. This is not observed in the first jet since it is not affected by a crossflow. These results are in accordance with [15]. Even if the crossflow does not interfere with the first jet since it is located just before the symmetry boundary condition, it will be influenced by other jets. This situation will be analyzed later through the study of a complete line of the nozzle array for the square configuration since this model presents a steadier flow behavior.
Fig. 6. Jet flow at 60 s (a) circular nozzle (b) square nozzle.
B. Variation of the Target Surface Temperature with Time
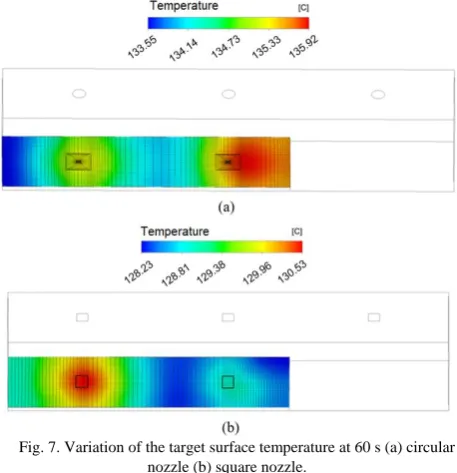
Regarding the temperature of the target surface presented in Fig. 7, it is verified that at the same instant of time (60 s), the temperature is higher in the circular nozzle case. In reference to the variation of the temperature over the surface, a different behavior between the two cases is observed. While in the square jets case the maximum temperature is registered near the jet axis, in the circular jets this temperature is recorded further away from the jet axis. These results are in accordance with the velocity profile presented previously. The vortices generated by the circular jets present higher dimensions than the ones induced by rectangular jets, moving the hot region away from the jet axis. It is also observed in both cases that the lower temperature of the target surface is registered in the wall jet collision zone. This phenomenon can generate problems related to the thermal uniformity of the target surface in the reflow soldering process. In that sense, it is important to analyze which are the geometrical variables that most influence this flow behavior in order to minimize its harmful effect, reducing the damage that can be induced over the target surface. These observations demonstrate that the jet-to-jet and jet-crossflow interactions lead to differences in the temperature distribution over the target surface. This analysis is in accordance with Wen et al. (2016), who
[image:4.595.53.286.293.450.2]mentioned that the nozzle geometry determines the momentum’s of the jets and the nozzle arrangement increase the complexity of the entire spatial flow field [14]. Draskler et al. (2017) also observed through numerical simulation the irregular and unsteady jets flow behavior which lead to heterogenous and rapid changes of the heat transfer near the impingement plate [20].
Fig. 7. Variation of the target surface temperature at 60 s (a) circular nozzle (b) square nozzle.
Extending the time of the numerical simulation, it appears that both cases reach 250°C at approximately 6 min, as it can be observed in Fig.8. The higher divergence occurs at a temperature range between 125ºC and 225ºC. This difference can be related to the mesh configuration but also due to the inlet geometry which is different in both cases.
0 50 100 150 200 250 300
0 200 400 600 800 1000
Te
m
pe
ra
tu
re
(⁰
C
)
Time (s)
square jet circular jet
Fig. 8. Variation of the target surface temperature with time.
C. Array of Jets
[image:4.595.311.542.460.620.2]the increase of the crossflow interaction. This outcome was also described by Wen et al. (2016), who also demonstrated that this effect can be increased depending on the nozzle geometry [14]. Furthermore, as expected the higher velocities are recorded at the exit of the nozzle, decreasing with the increase of the distance from the jet axis. This velocity profile was also observed by [21].
Fig. 9. Velocity profile of a line of a multiple jet array.
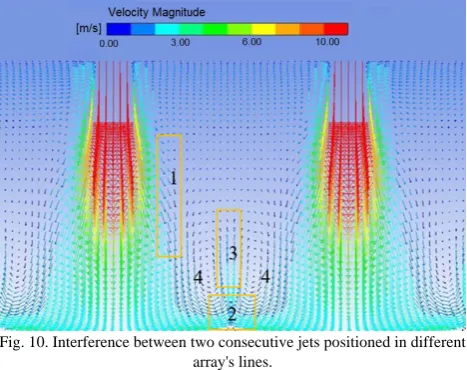
[image:5.595.52.286.336.521.2]To analyze the interference between jets of different and consecutive lines, Fig. 10 was generated, showing the interaction between the two jets but also the vorticity induced by the impingement over the target surface. The velocity profile resulting from the numerical simulation is in accordance with the experimental measurements performed by Caliskan et al. (2014) [19]. It is observed the flow separation (1), the wall jet collision (2) and the upwash flow. Vortices are also observed even they have small proportions (4).
Fig. 10. Interference between two consecutive jets positioned in different array's lines.
[image:5.595.318.538.422.572.2]The effect of the velocity profile on the overall temperature of the multiple jet impingement system is observed in Fig. 11. As expected, the higher temperature is recorded along the jets axes and in the jets impingement regions. It is also observed that the interaction between jets lead to an increase of the surrounding temperature. Regarding the jets that do not collide with the target surface, the surrounding air reached higher temperatures since they do not transfer heat directly to the surface.
Fig. 11. Overall temperature of the multiple jet impingement system at 60 s of simulation.
Focusing the attention in the temperature of jets located in the same line (Fig.12), it is observed that the vortices generated by the two central jets limit the increase of the local temperature compared with the adjacent jets. An air entrance is also observed at both outlet due to the boundary condition imposed on the physical domain.
Considering that the initial temperature of the impinging surface is 20ºC, the results show that after 1 min the surface temperature already starts to increase. Moreover, the surrounding air temperature increases almost 200ºC showing the effectiveness of the multiple jet impingement in the heat transfer.
Fig. 12. Variation of temperature of jets located in the same line 60 s.
Regarding the variation of jets temperature due to the interference between two jets located at two consecutive lines, the result obtained at 60 s is presented in Fig. 13. The temperature lines show an increase of temperature due to the interaction between jets, being more pronounced near the target surface. The fountain flow is clearly observed exactly in the middle of the jets interaction leading to a decrease of the heat transferred from the hot air to the target surface, identified in Fig. 13 as blue zones in the target surface. Special attention should be paid in these zones since they can induce cold spots that can affect the thermal uniformity of the surface which passes through this process.
Fig. 13. Variation of temperature of jets located in different lines at 60 s
D. Influence of the Thermal Cycle in the Target Surface Temperature
[image:5.595.49.288.640.761.2]followed by a cooling zone ensured by forced convection and finally a cooling at room temperature. In the impingement surface the increase and decrease of temperature in the heating and cooling zones respectively is smoother due to the thermal inertia of the surface.
0 50 100 150 200 250 300
0 200 400 600 800
T
e
m
p
e
ra
tu
re
(
C)
Time (s)
Circular jet_air temperature Circulat jet_surface temperature Square jet_air temperature Square_surface temperature
Fig. 14. Typical reflow soldering thermal cycle modelling.
IV. CONCLUSION
A numerical simulation of a multiple jet impingement system was presented in this paper. Due to the advantages presented by several authors, the SST k-ω turbulence model was applied in all the numerical models. In order to analyze the influence of the jet geometry in the flow behavior and studied, one with circular jets and another with square jets. Through the analysis of both numerical models, slightly differences are observed between them. In terms of flow behavior, the square jets model performs better since the higher temperatures are registered in the jet axis while in the circular jets more intense vortices are generated, inducing higher temperatures away from the jet axis. An User Defined Function was performed in order to obtain a thermal cycle usually applied in industrial reflow soldering processes. The result shows that the profile obtained is in accordance with typical profiles implemented in PCB manufacturing. In conclusion, this paper demonstrates the potential of the SST k-ω model for the numerical simulation of multiple jet impingement and the added value of the implementation of this tool in industries that use reflow soldering in their processes. However, to ensure accurate and reliable results it is important to perform a mesh study of both circular and square jets cases and to compare the numerical results obtained with experimental data.
ACKNOWLEDGMENT
This research is sponsored by the Portugal Incentive System for Research and Technological Development. Project in co-promotion nº 002814/2015 (IFACTORY 2015-2018). This work has also been supported by COMPETE and Portuguese Foundation for Science and Technology (FCT) within: the Strategic Project
UID/CEC/00319/2013; Strategic Project
UID/SEM/04077/2013; and the Strategic Project UID/EEA/04436/2013. Flavia Barbosa is supported by FCT under grant PD/BD/128216/2016, the MIT Portugal Program and the Scientific Centre MEtRICs.
REFERENCES
[1] D. C. Whalley, “A simplified model of the reflow soldering process,” J. Mater. Process. Technol., vol. 150, pp. 134–144, 2004.
[2] I. Balázs and G. Harsányi, “Heating characteristics of convection reflow ovens,” Appl. Therm. Eng., vol. 29, no. 11–12, pp. 2166– 2171, 2009.
[3] M. Angioletti, R. M. Di Tommaso, E. Nino, and G. Ruocco, “Simultaneous visualization of flow field and evaluation of local heat transfer by transitional impinging jets,” Int. J. Heat Mass
Transf., vol. 46, pp. 1703–1713, 2003.
[4] S. Yong, J. Z. Zhang, and G. N. Xie, “Convective heat transfer for multiple rows of impinging air jets with small jet-to-jet spacing in a semi-confined channel,” Int. J. Heat Mass Transf., vol. 86, pp. 832–842, 2015.
[5] C.-S. Lau, M. Z. Abdullah, and F. C. Ani, “Computational fluid dynamic and thermal analysis for BGA assembly during forced convection reflow soldering process,” Solder. Surf. Mt. Technol., vol. 24, no. 2, pp. 77–91, 2012.
[6] L. F. G. Geers, M. J. Tummers, and K. Hanjalić, “Experimental investigation of impinging jet arrays,” Exp. Fluids, vol. 36, no. 6, pp. 946–958, 2004.
[7] Y. Ichikawa, Y. Kameya, and S. Honami, “Three-dimensional flow characterization of a square array of multiple circular impinging jets using stereoscopic PIV and heat transfer relation,”
J. Vis., vol. 19, no. 1, pp. 89–101, 2016.
[8] V. Katti and S. V. Prabhu, “Influence of spanwise pitch on local heat transfer distribution for in-line arrays of circular jets with spent air flow in two opposite directions,” Exp. Therm. Fluid Sci., vol. 33, no. 1, pp. 84–95, 2008.
[9] H. Chattopadhyay, G. Biswas, and N. K. Mitra, “Heat Transfer From a Moving Surface Due to Impinging Slot,” ASME, Heat
Transf. Div., vol. 124, pp. 433–440, 2002.
[10] M. A. R. Sharif and A. Banerjee, “Numerical analysis of heat transfer due to confined slot-jet impingement on a moving plate,” vol. 29, pp. 532–540, 2009.
[11] X. Li, J. L. Gaddis, and T. Wang, “Multiple flow patterns and heat transfer in confined jet impingement,” Int. J. Heat Fluid Flow, vol. 26, no. 5, pp. 746–754, 2005.
[12] Y. Q. Zu, Y. Y. Yan, and J. D. Maltson, “CFD Prediction for Multi-Jet Impingement Heat Transfer,” Vol. 3 Heat Transf. Parts A B, pp. 483–490, 2009.
[13] J. Ortega-Casanova and F. J. Granados-Ortiz, “Numerical simulation of the heat transfer from a heated plate with surface variations to an impinging jet,” Int. J. Heat Mass Transf., vol. 76, pp. 128–143, 2014.
[14] Z. Wen, Y. He, X. Cao, and C. Yan, “Numerical study of impinging jets heat transfer with different nozzle geometries and arrangements for a ground fast cooling simulation device,” Int. J.
Heat Mass Transf., vol. 95, pp. 321–335, 2016.
[15] P. S. Penumadu and A. G. Rao, “Numerical investigations of heat transfer and pressure drop characteristics in multiple jet impingement system,” Appl. Therm. Eng., vol. 110, pp. 1511– 1524, 2017.
[16] F. R. Menter, “Two-equation eddy-viscosity turbulence models for engineering applications,” AIAA J., vol. 32, no. 8, pp. 1598– 1605, 1994.
[17] S. Spring, Y. Xing, and B. Weigand, “An Experimental and Numerical Study of Heat Transfer From Arrays of Impinging Jets With Surface Ribs,” J. Heat Transfer, vol. 134, no. 8, p. 82201, 2012.
[18] L. F. G. Geers, M. J. Tummers, and K. Hanjalić, “Particle imaging velocimetry-based identification of coherent structures in normally impinging multiple jets,” Phys. Fluids, vol. 17, no. 5, pp. 1–13, 2005.
[19] S. Caliskan, S. Baskaya, and T. Calisir, “Experimental and numerical investigation of geometry effects on multiple impinging air jets,” Int. J. Heat Mass Transf., vol. 75, pp. 685– 703, 2014.
[20] M. Draksler, B. Končar, L. Cizelj, and B. Ničeno, “Large Eddy Simulation of multiple impinging jets in hexagonal configuration – Flow dynamics and heat transfer characteristics,” Int. J. Heat
Mass Transf., vol. 109, pp. 16–27, 2017.
![Fig. 1. Typical heating system in the reflow oven. flows through several nozzles with a specific shape and configuration over a target surface [3], as it can be observed in Fig](https://thumb-us.123doks.com/thumbv2/123dok_us/404426.537968/1.595.304.547.428.513/typical-heating-reflow-nozzles-specific-configuration-surface-observed.webp)