Abstract— Automatic detection of abnormal electrocardiogram (ECG) waves is a key issue in the field of medical engineering. Many sever heart diseases show periodic abnormal waves in ECG. This provide informative suggestions for identifying the staging or abnormal site of heart disease. However, so far, few studies have tackled automatic detection of periodic abnormal ECG wave. In this paper, we propose a new method for detecting periodic abnormal waves in ECG. This method is based on the deep neural network model that learns wave’s shape and their temporal relevance by combing AutoEncoder and Long Short-Term Memory (LSTM). In the experiments, using ECG data of a myocardial infarction patient, it is shown that our method can identify adequately interval of abnormal wave, which the existing method was not able to detect.
Index Terms—deep learning, electrocardiogram, abnormal wave detection, myocardial Infarction
I. INTRODUCTION
UTOMATIC diagnosis of heart disease using Electrocardiogram (ECG) is a key issue in the field of medical engineering. Recently, deep learning has been employed as a powerful approach to find abnormality in ECG data [1-10]. Some research groups attempted to detect arrhythmia in ECG data using deep learning models [1, 2, 5]. In these studies, normal ECG data is used as training data, and hence irregular ECG data can be judged by the model as being abnormal.
As described above, the existing studies have focused on detecting irregularity of ECG data in arrhythmia. On the other hand, at present, there exist few studies targeting periodic abnormal waves. Periodic abnormal wave is typically observed in severe heart diseases. For example, in myocardial infarction (MI), abnormal wave within the basic wave (see Section II) is periodically observed in ECG data, and the characteristics of the wave changes depending on where infraction occurs or the period after onset of MI. We think that automatic detection of periodic abnormal waves will become a promising technique for early detection of
Manuscript received January 15, 2018.
K. Sugimoto is with the the Division of Information and Electronic Engineering, Muroran Institute of Technology, 27-1, Mizumoto-cho, Muroran, Hokkaido 050-8585, Japan (e-mail: [email protected]).
S. Lee is with the College of Information and Systems, Muroran Institute of Technology, 27-1, Mizumoto-cho, Muroran, Hokkaido 050-8585, Japan (e-mail: [email protected]).
Y. Okada is with the College of Information and Systems, Muroran Institute of Technology, 27-1, Mizumoto-cho, Muroran, Hokkaido 050-8585, Japan (corresponding author to provide phone: +81-143-5408; e-mail: [email protected])
severe heart disease. However, since the existing methods use the irregularity of the occurrence of the basic wave as a clue, there is a possibility that periodic abnormal ECG data is incorrectly judged as normal one.
In this paper, we propose a new method that can detect periodic abnormal wave in ECG data. This method learns the characteristics of the subsequences within the basic wave by combining two neural network models, AutoEncoder and Long Short-Term Memory (LSTM). Namely, AutoEncoder learns the shape of subsequences, and LSTM learns temporal relevance between them. In the experiments, the ECG data of a myocardial infarction patient is used to evaluate the detection accuracy of abnormal waves.
The remainder of this paper is organized as follows. Section II explains ECG data. Section III provides a brief description about AutoEncoder and LSTM. Section IV describes the proposed method. Section V explains the experimental methods for evaluating detection accuracy of abnormal waves in ECG data, and Section VI presents the experimental results and discusses some observations. Section VII provides an overall summary.
II. ELECTROCARDIOGRAM
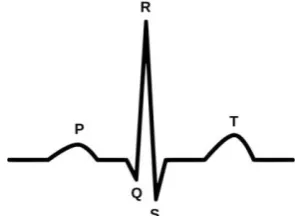
Electrocardiogram (ECG) is a graphic recording of the heart’s electrical activity. Figure 1 illustrates a basic wave appearing repeatedly in ECG data. A basic wave is composed of five waves, P, Q, R, S, and T. The 12-lead ECG, which measures 12-different sites (leads) of the body, has been widely used to diagnose cardiac abnormality or disease. The twelve sequences obtained by one measurement are called I, II III, aVR, aVL, aVF, V1, V2, V3, V4, V5, and V6, respectively. Among them, in particular, the lead II is most commonly used to evaluate behavior of the five waves because it shows clear signal compared to other waves.
Deep Learning-based Detection of Periodic
Abnormal Waves in ECG Data
Kaiji Sugimoto, Saerom Lee, and Yoshifumi Okada
[image:1.595.355.503.185.293.2]A
III. AUTOENCODER AND LSTM
AutoEncoder is one of the unsupervised deep learning models and typically is used to reconstruct original input [11]. This model can represent high-dimensional input data as low-dimensional features by feature extraction step in the hidden layer.
LSTM is a variant of recurrent neural network (RNN) that was designed to model temporal dependency in time-series data [12, 13]. In typical RNN, the temporal dependency is learned by considering output data from the hidden layer of the time immediately before into input data of the current time. RNN has been well suited to learn short-term dependency in time series data. However, it was difficult to learn long-term dependency because the computational complexity increases explosively. In contrast, LSTM allows learning long-term dependency as well as short-term dependency by introducing three gates (input gate, output gate and forget gate) in order to select or regulate information [13].
IV. METHOD
The method is composed of the three steps, 1) training data preparation, 2) model learning, and 3) abnormal wave detection.
A. Training data preparation
Figure 2 illustrates how to create the training data. Training data is created using ECG dataset of healthy subjects. Hereafter, this ECG data is referred as healthy data. First, detrending process and smoothing process are performed to remove trend and noise of the healthy data. Next, basic waves are extracted from the healthy data. Each basic wave includes 650 data points that cut out from 250 points and 399 points before and after the R wave. Subsequently, the amplitude values of each basic wave are normalized by Z-score. After that, for each basic wave, subsequences are generated by shifting the window with the width W by S points from the start point. Each subsequence is represented by a W-dimensional vector concerning the closed interval of [(i-1)*S, (i-1)*S+W] (i=1, 2,…, (650-W)/S+1). In this vector, each dimension shows a time point in a closed interval, and each element corresponds to normalized amplitude in a time point. The W-dimensional vectors are used as the training data of the model.
B. Model learning
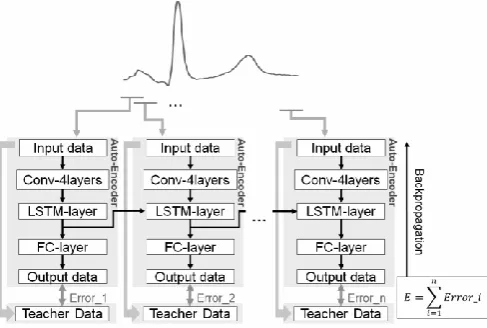
Our aim is to divide an ECG data into subsequences and simultaneously learn the shapes and those temporal changes. This is realized by the introducing LSTM into AutoEncoder. Namely, AutoEncoder (the convolution layer) extracts the shape feature of the subsequences, and LSTM learns the temporal relevance between continuous subsequences. This model is composed of the feedforward process and the backpropagation process as described below.
[image:2.595.55.554.70.190.2]Figure 3 illustrates the schematic diagram of the model learning. Input to the model is a W-dimensional vector, i.e., a subsequence cut out from a basic wave. The feedforward process is executed in the following procedure. First, the convolution layer is performed for the dimension reduction and feature extraction. Next, the output from the convolution layer is input to the LSTM layer, where the relevance with the preceding subsequences is also considered. The fully connected layer receives the output from the LSTM layer and outputs a W-dimensional vector. Subsequently, the mean squared error between the input vector and the output vector is calculated in order to utilize in the backpropagation process. The backpropagation process is performed after the feedforward process of subsequences for each basic wave. In this process, first, the sum total E of the mean squared errors is calculated. Next, E is minimized by the back propagation process in order to bring output vector closer to input vector. Fig. 2. Training data preparation.
[image:2.595.309.553.223.387.2]
C. Abnormal wave detection
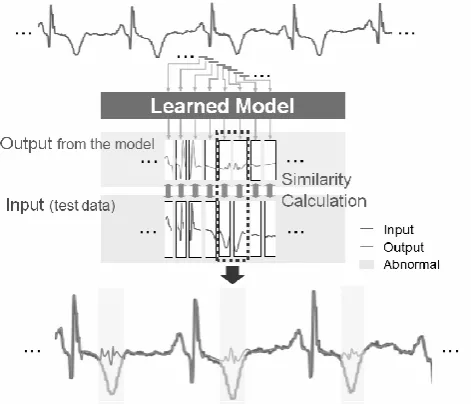
Figure 4 illustrates the procedure of detection of abnormal waves in ECG data. Test data for abnormal wave detection is created in the following procedure. First, detrending process and smoothing process are performed to remove the trend and noise of the test ECG data. Next, the amplitude values of the ECG data are normalized by Z-score. After that, subsequences are generated by shifting the window with the width W by S points from the start point of the ECG data. Each subsequence is represented by a W-dimensional vector concerning the closed interval of [(i-1)*S, (i-1)*S+W] (i=1,2,…,(TestData.length-W)⁄S+1). In this vector, each dimension shows a time point in a closed interval, and each element corresponds to normalized amplitude in a time point. The W-dimensional vectors are input one by one to the model as a test data. Output from the model is also W-dimensional vector.
Subsequently, for each output vector, similarity score with input vector is calculated. If the similarity score is under a threshold θ, then the output vector (the subsequence) is judged as being abnormal. In the creation of the test data, there exist intervals in which subsequences overlaps for each other by the window shift. Thus, different judgement results might be obtained between two subsequences. In this case, if either or both of two subsequences are normal, the interval is judged as being normal.
V. EXPERIMENTS
A. Datasets
ECG data was acquired from the public database, PhysioBank [14]. As the training data, 20 healthy data was collected from the database, and 200 basic waves were extracted. As the test data, an abnormal ECG data of a myocardial infarction (MI) patient was used. This data shows repetitive abnormality called T-wave inversion in the basic waves [15]. In this experiment, we used ECG data of the lead II that shows clear signals and is commonly used for diagnosis of heart disease.
B. Parameter settings
The model was constructed using the free software Chainer [16]. Table 1 shows the parameters and functions of the model. Window width W and shift width S were set to 50 and 25, respectively.
C. Evaluation
In this evaluation, the interval of T-wave was regarded as abnormal wave. Detection accuracy of the abnormal waves was computed by the following three indexes.
Precision = CDP / DDP (1)
Recall = CDP /EDP (2)
F-measure = (3)
Here, CDP is the number of correctly detected abnormal intervals, DDP is the number of abnormal intervals detected by the method, and EDP is the total number of abnormal intervals.
Judgement of abnormality was performed based on the Euclidian similarity between input subsequence and output subsequence. Euclidian similarity Sim( ) is calculated as follows.
(4)
Here, and are input vector and output vector, respectively, and d( ) is the Euclidian distance between and .
In this evaluation, we show the results of detection accuracy when changing in the range from θ = 0.1 to θ = 0.9.
VI. RESULTS AND DISCUSSION
A. Visualization of abnormal wave detection
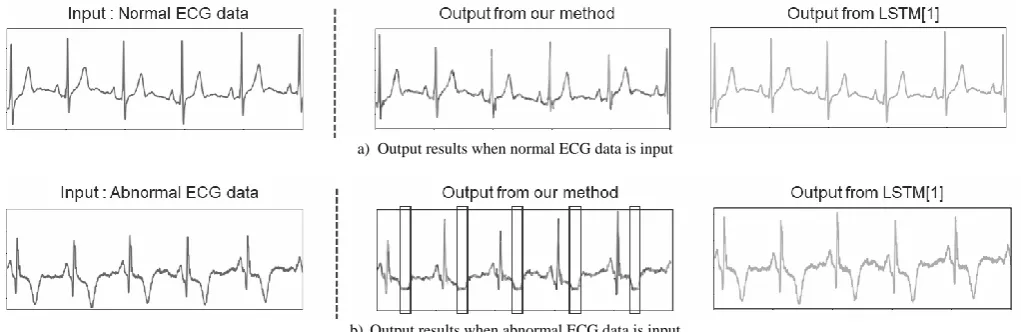
In this section, we compare the output results between our method and an existing LSTM-based method [1]. Figure 5 shows the visualization results of the two methods. Figure 5a is the result when a normal ECG data is input. From this figure, we see that the normal ECG data can be almost reconstructed in the both methods, i.e., no abnormal waves are detected. Figure 5b is the result when an ECG data with abnormality (T-wave inversion) is input. In this figure, we can see that our method outputs distorted waves around the T-wave. This is because our model is designed so as not to reconstruct abnormal waves. Thus, it enables us to discriminate interval of abnormal waves. In contrast, the
TABLEI
PARAMETERS AND FUNCTIONS
Types of Layers
# of Nodes (Input layer)
# of Nodes (Output layer) Activation Function Filter size Convolution Convolution Convolution Convolution LSTM FC 1ch×50 4ch×47 8ch×44 4ch×41 38 38 4ch×47 8ch×44 4ch×41 1ch×38 38 50 ReLU ReLU ReLU Sigmoid - - 4 4 4 4 - - Loss Function : Mean Squared Error
[image:3.595.308.544.47.249.2]Optimizer : Adam
LSTM-based method reconstructs abnormal ECG data as it is. This means that the abnormal waves cannot be recognized.
B. Detection accuracy
Figure 6 shows the detection accuracy of abnormal waves by our method. The horizontal axis is θ, and the vertical axis is accuracy score of each index. Precision decreases with increase of θ. This is because, in larger θ, normal waves are incorrectly detected as abnormal waves. Recall increases with increase of θ. This is because, in larger θ, abnormal waves are easy to be detected. F-measure is an index showing balance of precision and recall and takes the maximum value (= 0.57) in θ = 0.6. In this condition, the precision and the recall are 0.50 and 0.66, respectively. Namely, there exist misdetections of 50% for precision and 34% for recall. This reason is discussed below. Figure 7 visualizes the detection result in θ = 0.6. The shaded part is the region detected as abnormal waves. As seen in this figure, all the R waves, which are normal waves, are incorrectly judged as abnormal waves. It is one of the major causes of decreasing the precision. Such misdetection is caused due to large dispersion of amplitude of R wave among subjects/patients. To solve this problem, it is necessary to introduce the preprocessing of R wave. In this study, abnormal wave in the test ECG data is defined as the interval of T-wave. Namely, abnormal interval is widely set than actual one. This is one of the major causes of decreasing the recall. Hence we think that recall can be improved by reconsidering the evaluation method.
VII. CONCLUSION
In this paper, we proposed a new method for detecting interval of abnormal wave from ECG data. This method was based on the deep neural network model that performs learning of wave’s shape by AutoEncoder and learning of temporal relevance between waves by LSTM. In the experiments, the ECG data of a myocardial infarction patient was used to evaluate the detection accuracy of abnormal waves. As a result, the following conclusions were obtained; 1) This method was able to detect periodic abnormal waves that were not able to be detected by the existing method based on LSTM [1].
2) Although the results did not show sufficiently high accuracy, it can be improved by modifying the preprocessing of ECG data and the evaluation method of detection accuracy.
In the future, we will tackle the problem of the above 2) and apply the method to other ECG data.
a) Output results when normal ECG data is input
b)Output results when abnormal ECG data is input Detected abnormal waves are surrounded by the frame.
Fig. 5. Visualization results of the two methods
[image:4.595.44.555.52.218.2][image:4.595.50.562.114.527.2]
Fig. 6. Detection accuracy
ACKNOWLEDGMENT
This work was partially supported by Grant-in-Aid for Scientific Research (C) (No. 17K00373) from the Japan Society for the Promotion of Science.
REFERENCES
[1] P. Malhotra, L. Vig, G.Shroff, and P.Agarwal, “Long Short Term Memory Networks for Anomaly Detection in Time Series,” in ESANN, 23rd European Symposium on Artificial Neural Networks, Computational Intelligence and Machine Learning, 2015.
[2] S.Chauhan, and L.Vig, “Anomaly detection in ECG time signals via deep long short-term memory networks,” In Data Science and Advanced Analytics (DSAA), 2015. 36678 2015. IEEEInternational Conference on, pp. 1–7. IEEE, 2015.
[3] S. Kiranyaz, T. Ince, and M. Gabbouj, “Real-Time Patient-Specific ECG Classification by 1-D Convolutional Neural Networks,” IEEE Transactions on Biomedical Engineering, vol. 63, pp. 664–675, March. 2016.
[4] M.M. AlRahhal, Y. Bazi, H. AlHichri, N. Alajlan, F. Melgani, and R.R.Yager, “Deep learning approach for active classification of electrocardiogram signals,” Imformation Sciences, vol. 345, pp. 340-354, June. 2016.
[5] P. Malhotra, A. Ramakrishnan, G. Anand, L. Vig, P. Agarwal, and G. Shroff, “LSTM-based Encoder-Decoder for Multi-sensor Anomaly Detection,” Presented at ICML 2016 Anomaly Detection Workshop, NewYork, NY, USA, 2016.
[6] B. Pourbabaee, M. J. Roshtkhari, and K. Khorasani, “Deep Convolutional Neural Networks and Learning ECG Features for Screening Paroxysmal Atrial Fibrillation Patients,” IEEE Transactions on Systems, Man, and Cybernetics: Systems, pp. 1-10, June. 2017. [7] P. Rajpurkar, A. Y. Hannun, M. Haghpanahi, C. Bourn, and A. Y. Ng,
“Cardiologist-Level Arrhythmia Detection with Convolutional Neural Networks,” arXiv preprint arXiv:1707.01836, 2017.
[8] U. R. Acharya, S. L. Oh, Y. Hagiwara, J. H. Tan, M. Adam, A. Gertych, and R. S. Tan, “A deep convolutional neural network model to classify heartbeats,” Computers in Biology and Medicine, vol. 89, pp. 389-396, October. 2017.
[9] T. Reasat, and C. Shahnaz, “Detection of Inferior Myocardial Infarction using Shallow Convolutional Neural Networks,” arXiv preprint arXiv:1710.01115, 2017.
[10] U.R. Acharya, H. Fujita, S.L. Oh, Y. Hagiwara, J.H. Tan, and M. Adam, “Application of deep convolutional neural network for automated detection of myocardial infarction using ECG signals,”Information Sciences, vol. 415-416, pp. 190-198, November. 2017
[11] G. E. Hinton and R. R. Salakhutdinov, “Reducing the Dimensionality of Data with Neural Networks,” Science, vol. 313, pp. 504-507, July. 2006
[12] S. Hochreiter, and J. Schmidhube, “Long short-term memory,” Neural Computation, vol. 9, pp. 1735-1780, 1997
[13] F. A. Gers, J. Schmidhuber, and F. Cummins, “Learning to Forget: Continual Prediction withLSTM,” Neural Computation, vol. 12, pp. 2451-2471, 2000
[14] PhysioBank, [Online]. Available: {https://physionet.org/physiobank/}. [15] S. Watanabe, I. Yamaguchi, ECG Perfect Manual, 19th ed.
YODOSHA, 2016, pp. 202-203.