Freeze-Drying
G.-W. Oetjen, Chemical Engineering, Lu(beck, Germany
Copyright^ 2000 Academic Press
Introduction
Freeze-drying is a process, in which a product isRrst frozen and then dried by sublimation of the ice. The total process involves four steps: freezing; sublima-tion of the ice, called main drying (MD); desorpsublima-tion of the water bound to the solid, called secondary drying (SD); and packing in containers to exclude absorption of water and/or oxygen from the atmos-phere. By freeze-drying a product unstable in water is transformed into a dry, stable product. The process has to be developed to satisfy four demands on the
Rnished product: its volume remains that of the frozen substance; the structure and the biological activity of the dried solid correspond as far as possible to those of the original substance; the dried product remains stable during storage, if possible at temperatures up to #403C and for up to 2 years; and with the addition of water the original product is quickly reconstituted. This article summarizes the problems and solutions to achieve these aims.
Theoretically, sublimation of ice can be done at atmospheric pressure; however, the vapour pressure of ice between!103C and!403C is approximately 2.6}0.13 mbar and 1 kg of ice has a volume of ap-proximately 470 m3 at !103C and 8400 m3 at !403C. To transport these volumes at atmospheric pressure the gas volume has to be approximately 400}8000 times larger than that of the vapour. Therefore all freeze-drying plants today are vacuum plants, in which the air is reduced to some 10% of the vapour pressure, to allow the freeSow of vapour at velocities up to 100 m s\1.
The Rrst organ tissues were freeze-dried in 1890 and in 1932 a vacuum freeze-drying plant was built, but only after 1940 did it become an industrial pro-cess with the freeze-drying of blood plasma and penicillin.
Freezing
Structure of Water and Ice
In a water molecule the two H atoms form an almost tetrahedral angle with a strong dipole moment. A shell of about four water molecules exists at a dis-tant of 28 nm, followed by a second at approximately
45 nm, and beyond 80 nm no shell can be identiRed. In addition to this short range order, a network of hydrogen bonds exits with a very short lifetime of 10\12to 10\13s.
In sub-cooled, very pure water the nucleation of ice crystals (homogeneous nucleation) starts around
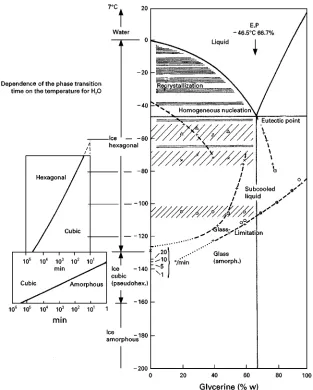
!413C. Normally water contains about 106particles which act as nuclei for crystallization (heterogeneous crystallization). They become more effective as their structure approaches that of ice. Ice crystals exist in nine forms, of which the cubic and hexagonal at under atmospheric pressure. The growth rate of crystals depends on the diffusion of molecules to the nuclei, onRnding a suitable place, and on the transportation of the freed energy to the heat sink. With extreme cooling rates (of the order of 1053C min\1), crystalli-zation can be avoided and water solidiRes into an amorphous, glass-like phase.Figure 1shows that the amorphous phase of ice is only stable below
!1603C; in the range!1603C to!1303C amorph-ous and cubic phases can exist, and between!1303C and!653C all the forms can be present, depending on the speed of warming. It is technically impossible to cool pure water quickly enough, to produce glassy ice; even small droplets (1 mm) injected into liquid nitrogen may freeze at a rate less than 1033C min\1. The freezing behaviour of water changes completely if other substances are present in the water, e.g. cryoprotective agents (CPAs). The most widely used CPAs are:
E protein: human serum albumin, gelatin E amino acids: glycine, arginine, alanine E alcohols: mannitol, polyethylene glycol (PEG) E carbohydrates
} monosaccharides: glucose, fructose
} disaccharides: lactose, maltose, sucrose, trehalose
} polysaccharides: dextran, cyclodextrins E others
} metals
} surfactants
} polymers
} buffer salts
They all protect in one way or another, alone or in combination, the original quality of the product to be freeze-dried.
Figure 1 Phase diagram, water}glycerine. On the left-hand side the dependence of the phase transformation time from the ice temperature is shown: at!1403C amorphous ice transforms into cubic ice in approximately 10 min. (From Umrath, W. Kurzbeitrag fuKr die Tagung Raster-Elektronenmikroskopie in Medizin und Biologie, unpublished, BruKhl.)
(Thn) can be reduced by about 203C, the devitriR ca-tion temperature (Tg) can rise by almost 353C and sub-cooled liquids can exist down to very low tem-peratures. Polyvinyl pyrrolidone reduces Thn only a few degrees, whileTgcan be changed by more than 703C. The freezing of a product is mostly done so quickly that no equilibrium state is reached during the process. The structure of the frozen product de-pends therefore not only on its components but also very much on the freezing rate and the temperature at the end of the freezing process. Generally speaking, during slow freezing the nuclei have time to grow and the solution in between the ice crystals becomes increasingly concentrated. During quick freezing only small crystals can grow and the remaining solution can become so viscous that the water
molecules cannot diffuse to the crystals and they become part of the solidiRed liquid (glass) between the ice crystals.
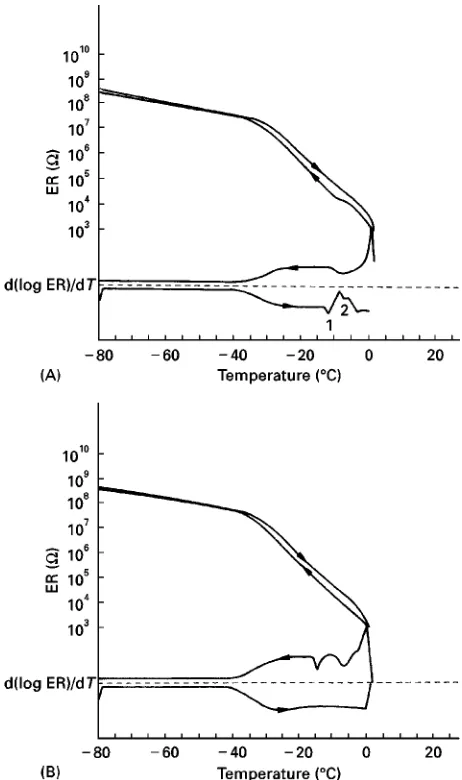
Figure 2 (A) Electrical resistance (ER) of a pharmaceutical product as a function of temperature during cooling at 13C min\1
and warming at 33C min\1. Heat transfer medium and product are
approximately uniformly heated. (B) Measurement of the electri-cal resistance as in A, but with the wall of the vial insulated by a plastic tape up to the filling height of the product. Heat is therefore mostly removed through the bottom of the vial. (A and B from Willemer, H., KoKln, unpublished measurements.)
formation of the structure and the factors which inS u-ence it.
Methods of Structure Analysis
A number of methods have been described to supply information during freezing. Electrical resistance dur-ing cooldur-ing and warmdur-ing (ER) is measured in a test vial at different freezing and warming rates. For a more accurate interpretation of the function log (ER)"f(T) the Rrst derivative of the plot is cal-culated as shown inFigure 2. The advantages of the method are: sample size is of the order of a product in
a vial; it simulates heat transfer from the shelf to the vial/product; and the equipment is relatively inexpen-sive and easy to operate. The disadvantages are that interpretation needs some experience, the measured data reSect the mobility of ions and the amount of energy used or freed during an event cannot be cal-culated. InFigure 2A, the heat transfer medium and product are at a similar temperature; in Figure 2B, the wall of the test vial is isolated from the heat transfer medium to simulate the freezing of a product in a vial on the shelf. InFigure 2A, the effect of sub-cooling during freezing can be seen at about!103C, but the derivative shows it more clearly between
!33C and !103C. During warming at event 1 (!123C) the structure softens, allowing unfrozen water to crystallize, represented by the increase in resistance. In Figure 2B the crystallization energy cannot be quickly removed: freezing occurs in two steps. During warming, events 1 and 2 are not found, all freezable water is crystallized during cooling.
Differential scanning calorimetry (DSC) compares heatSows, one to and from the sample and the other to and from a substance with no transitions in the measuring range. Roos and Karel showed by DSC (Figure 3) the inSuence of unfrozen water on Tg of fructose (1) and glucose solutions (2). After rapid freezing (303C min\1) to!1003CT
gof fructose and glucose is at !883C and !843C respectively; at
!483C and!443C respectively the unfrozen water crystallizes, followed by the melting of ice. If the products are thermally treated or annealed (after freezing the product is warmed to!483C for 15 min and then cooled again to!1003C),Tg, calledTgYif all freezable water is frozen, is raised to!583C and
!573C and no crystallization event is measurable. Time and temperature of annealing must be carefully determined to achieve a certain mobility of the mol-ecules without collapse of the structure (see Fig-ure 9B). The advantages of DSC are the quantitative measurement of the changes in the heat capacity of the sample and the energy freed or used in an event. The disadvantage is the small sample (milligrams), which can behave differently from a product in vials (grams) and the cost of the equipment.
Figure 3 Results of annealing (thermal treatment) on the formation of ice in a 60%fructose solution (1) and in a 60%
glucose solution (2). Curve A: after cooling at 303C min\1down to !1003C, the DSC plots have been recorded during warming at
53C min\1.T
gapproximately!853C and!883C, respectively,
for fructose and glucose. At approximately!483C and!443C respectively, ice crystallization starts clearly, followed by the be-ginning of the melting of ice. (During freezing only a part of the water has been crystallized.) Curve B: after cooling down to
!1003C, the product has been warmed at 103C min\1to!483C,
kept for 15 min at this temperature (thermal treatment), cooled down again at 103C min\1to !1003C, and the DSC plot (B)
measured during rewarming. During thermal treatment all freezable water is crystallized, andTgYis increased to!583C and !573C, respectively. During warming, no crystallization can be detected. (Reproduced with permission from Roos and Karel, 1991.)
Figure 4 Photographs taken with a cryomicroscope of Factor VIII solutions at four temperatures. At!403C the structure is still visible, but is more coarse compared with the appearance at
!443C. At!353C the structure is collapsed. (Reproduced with permission from Willemer, 1996.)
other methods, e.g. ER or DSC, and the possibility to analyse the image quantitatively by computer. The disadvantages are high cost and the relatively small region of the sample that can be observed.
Nuclear magnetic resonance (NMR) provides in-formation, among other things about free or bound water (e.g. to protein molecules), the inSuence of unfrozen water on the collapse temperature and the crystallization of amorphous dry products. Hanafusa has shown by NMR (Figure 5) how the amount of unfrozen (bound) water in a 0.57% ovalbumin solu-tion is reduced by the addisolu-tion of a 0.01 M solusolu-tion of sucrose or glycerol. Similar information can be gained for a coffee extract with 25% solids: during freezing and rewarming at !703C 0.01 g water per gram solid are unfrozen, at!403C 0.1 g per gram and at
!203C approximately 30%; thereafter the amount increases rapidly. This extract has to be freeze-dried
at a Tico(!203C, otherwise the structure would collapse. The unique advantage of NMR is the ability to discriminate between free, crystallized and bound water.
More details concerning these methods and addi-tional procedures have been reported by Oetjen.
Freezing Rates
The freezing time can be estimated by an equation developed by Steinbach:
tf"J/Tg(2/2g#d/Ksu)
wheretf"freezing time;J"enthalpy difference be-tween the initial freezing point and theRnal temper-ature; T"difference of temperature between the freezing point and the cooling medium;d"thickness of the product parallel to the direction of prevailing heat transfer; g"density of the frozen product; g"thermal conductivity of the frozen product; and
Ksu"surface heat transfer coefRcient between cool-ing medium and the freezcool-ing zone.
[image:4.568.290.518.364.653.2]Figure 5 Unfreezable water (UFW) in a 0.57%ovalbumin solu-tion as a funcsolu-tion of the freezing temperature with different CPAs. (Reproduced with permission from Hanafusa, 1992.)
Figure 6 Course of main drying observed using a cryomicro-scope, in which freeze-drying is carried out. The hydroxyethyl starch solution is optimally frozen. The dark lines show the form of the sublimated ice crystals. (Reproduced with permission from Kochset al., 1991.)
can changeKsuby a factor of two}if the vials are in trays without machined bottom surfaces by a factor four and more. With Ksu measured, tf can be esti-mated with an error of 10}15%.
Main or Sublimation Drying
The main drying process (MD) has been photo-graphed in a cryomicroscope by Kochs et al. as shown in Figure 6. The ice crystals grow extremely uniformly using a special freezing method. The ice sublimes and the remaining solids show their original structure after freezing. During sublimation the temperature of the ice at the sublimation front (Tice) has to be kept well below the collapse temper-atureTc.
As can be seen inFigure 6Ticecannot be measured by a sensor because the ice front travels. If the valve between chamber and condenser (8 in Figure 11) is closed for a short time ((3 s) the water vapour pressure in the chamber rises until the saturation pressure (g) of the ice front is reached. The rising pressure is measured 100 times per second and the change in the slope (after 2.14 s), if saturation is reached, is determined as 0.286 mbar, corresponding to !32.73C as shown by Haseley and Oetjen in Figure 7. This procedure is called barometric temper-ature measurement (BTM). It permits checking
Ticeduring MD (e.g. every 10 min). To estimate the main drying time (tMD) the following equation
developed by Steinbach is used:
tMD"(gwLSm d)/Ttot(1/Ktot)#(d/2.g)
#(d/2 LSb/u)
where g"density of the frozen product (kg m\3); w"amount of water (kg kg\1); LS"sublimation energy (2.805 kJ kg\1);T
tot"temperature difference (Tsh!Tice); Ktot"total heat transmission coefRcient from the shelf to the sublimation front of the ice;
g"thermal conductivity of the frozen product;
d"thickness of the layer (m); m"content of frozen water; and b/"permeability (kg m\1 h\1mbar\1) for water vapour through the dried product.
[image:5.568.290.519.295.653.2]Figure 7 Pressure rise as a function of time. 1, Pressure rise in the chamber after the valve is closed; 2, first derivative of 1. The maximum of 2 is reached at 2.14 s; the related equilibrium vapour pressure ps"0.286 mbar, corresponding to Tice"
!32.73C. (Reproduced with permission from Haseley and Oetjen, 1998.)
Figure 8 Density of water vapour flow (g cm\2h\1) as function
ofpchwith jet flow and differentl /d as parameter. (Reproduced
with permission from Oetjen, 1999.)
expect values between 60 and 120 kJ m\2h\13C\1.
Ktotis only slightly dependent on the operation pres-sure up to 0.1 mbar; then it increases up to 1 mbar by a factor of two.gis, in most cases, theRgure for pure ice.m has to be determined for each product by methods described above. b/"1.3;10\2 (kg m\1h\1mbar\1) is an average which is often found in practice, it can vary by a factor of two, but
the term with b/ in most freeze-drying processes only has an inSuence of a few per cent ontMD. The standard deviation ofTice, measurements during MD in the range of!15 to!453C should be(0.53C, if measured automatically. tMD is in most cases governed by the value of Ttot and the term (1/Ktot). The term (d/2)g) is, fordvalues below 10 mm, of the order of 10% or less of l/Ktot, growing to approxim-ately 50% atd"35 mm.Ticeis the result of a ther-modynamic equilibrium between heat transfer to the sublimation front and energy consumption for subli-mation. Both depend on several factors, but the heat supply and vapour transport to the condenser are most important during MD. Therefore the operation pressure is a very effective tool to controlTice, if the shelf temperature is kept constant and the condenser temperature is always below a maximum, which de-pends on the water vapour pressure in the chamber and the design of the plant. By changing the operation pressure, e.g. from 0.1 mbar to 0.8 mbar,Ticecan be controlled between!303C and!203C. For another product, a different product thickness or a different plant, the pressure range and its controlled range are different, but the dependence is reproducible. Since
Ticedepends also on the structure of the frozen prod-uct it can be used to prove that the strprod-ucture of products in different runs is homogeneous and sufR -ciently identical. If the structure contains unfrozen water,Ticedata will from time to time jump by 13C or more (when the water evaporates) and the data will be different for a product frozen at different freezing rates.
At the end of MD the ice is mostly sublimed and the measuredTicedecreases below the standard deviation ofTiceduring MD. This effect can be used to change automatically from main to secondary drying (SD), e.g. if the measuredTicebecomes 2}33C smaller than the average during MD. Other criteria are often sug-gested, such as an increase of product temperature, a decrease in operating pressure or a decrease in partial pressure of water vapour, but it is more difR -cult to use these other methods quantitatively.
Besides heat transfer, the water vapour transport from the chamber to the condenser is often critical in a freeze-drying process. The length (l) and diameter (d) of the connection between chamber and conden-ser in a freeze-drying plant as shown in Figure 11 determine the vapourSow, assuming that the other
Sow resistances in the chamber are relatively small by comparison. The vapourSow can be estimated using the GuKnther}Jaeckel}Oetjen equation.Figure 8shows that: the vapourSow density decreases in a nonlinear manner with the chamber pressure; the relation of
[image:6.568.50.277.456.672.2]Sow density at l/d"5 is only 30% that atl/d"1. Right-angle bends contribute to the length not only by their physical dimensions but, depending on the design, by a factor of four or more of the measured length. For operation pressures below about 10\1mbar, l/d'2.5 should be avoided.
Secondary or Desorption Drying
Desorption Rates
During secondary drying (SD), water that is removed is more less bound to solid molecules. The amount of water removed is small (e.g. 10% of solids), com-pared to 10 times the weight of solids during MD. The behaviour of water molecules close to a protein surface has been described by Bellissent-Funel and Teixeira. The water molecules are in a monolayer around the protein with a reduced mobility compared with bulk water.
The desorption of bound water can be measured during SD by measuring the pressure rise in the cham-ber after closing the valve to the condenser for 60}120 s. The length of time is not critical since the temperature does not change quickly in this phase. The pressure rise (dps\1) can be converted into the desorption rate (DR) using:
DR"2.89;102(V
ch/mso) (dp/dt)
where DR"desorption of water vapour in per cent of solids per hour; Vch"chamber volume (L); dp"pressure rise (mbar); dt"time of dp (s); and
mso"mass of solids (g).
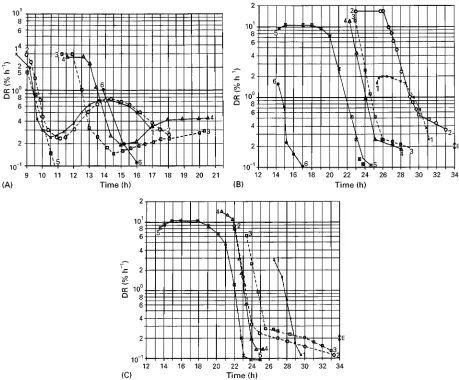
The course of DR describes not only the progress of the secondary drying quantitatively, but also reSects the structure of the frozen product as shown by Haseley and Oetjen in Figure 9. In Figure 9A DR data are shown for a 10% mannitol solution frozen in vials on the shelves of the freeze-drying plant at a rate of 0.5}0.83C min\1. InFigure 9B the same solution in the same vials is frozen in liquid nitrogen and in Figure 9C the solution is frozen in liquid nitrogen but annealed before freeze-drying. From theseRgures the following conclusions can be drawn. (1) Slow freezing of 10% mannitol solutions results in struc-tures in which the water is bound in several forms. The DR plots as a function of time are not single-valued. (2) Freezing at rates of more than 303C min\1produces structures with a more uniform desorption behaviour. DR plots show the inSuence of the operating conditions during MD: (1) run 6 in Figure 9B is collapsed, and the water has dissolved part of the solids, forming a sticky cake. The water
vapour of 378 vials resulted in an unstableTice, which is 5}73C higher than in all other runs. (2) The system-atic inSuence ofTshis shown inFigure 9B and C. (3) The inSuence of pc is shown in Figure 9C, and the inSuence of annealing or lowTiceis demonstrated by comparing Figure 9B and C: without annealing, DR plots bend between 3% and 5% per hour; with annealing this effect practically disappears. The ex-ceptions prove the sensitivity of the measurements: run 1 (Figure 9B) is freeze-dried atTice"!36.93C, others at approximately!34.93C; run 5 (Figure 9B) is annealed at!403C but for 8 h; runs 2 and 3 (Fig-ure 9C) are annealed at a temperat(Fig-ure 13C too high and 1.53C too low for 18 min. Annealing reduces the amount of unfrozen water.
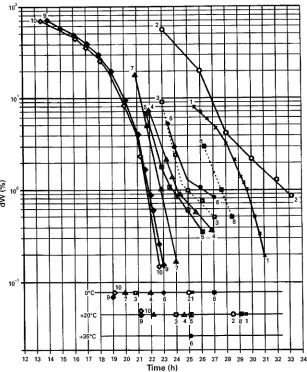
Residual Moisture Content
The integration of DR over time results in the amount of water which can still be desorbed; this is called desorbable water, dW or residual moisture content. InFigure 10Haseley and Oetjen show the calculated plots from the DR data of Figure 9B and C. From the lower part of Figure 10, it follows that the heat con-ductivity of the annealed product during SD is almost 100% higher and more uniform than that of the unannealed product. The upper part shows that the correctly treated products and the one dried at a lowTiceduring MD will dry more quickly than the others.
Storage
The storage capability of a dried product depends generally on its chemical and structural qualities. The complexity of the problem is highlighted, for example, by the storage stability of therapeutic pro-teins. The degradation of a protein, the irreversible change in primary structure, conformation or state of aggregation in a glassy surrounding depends on the thermodynamic behaviour of the glass as well as on the qualities of the protein produced during freezing and freeze-drying, as shown by Pikal. The storage temperature of such products has to be well below
Tgof the dried formulation; nevertheless unfolding or aggregation of unfolded molecules can occur because of poor interaction between the stable glass structure and movements in protein conRgurations. From this example some simpliRed guidelines can be proposed. There are no general rules to estimate the maximum storage time at a maximum tolerable temperature
Figure 9 (A) Desorption rate (DR) as a function of time of a 10%mannitol solution frozen on the shelves of the freeze-drying plant at a rate of 0.5}0.83C min\1. In all runs: 300 vials at an operation pressure (p
c)"0.3 mbar during MD. Runs 1 and 2 at a shelf temperature
(Tsh)"203C; runs 3 and 4,Tsh"53C. Plot 5 egg albumin and plot 6 saccharose for comparison. (B) DR as in A, but the solution is
frozen in liquid nitrogen at a rate between 353C and 663C min\1. During MD all runs atpc"0.15 mbar, except run 1"0.08 mbar and
Tshin run 1"!53C; in run 2"03C; in runs 3}6"03C for the first 11 h, thereafter until end of MD 103C. In runs 1}5, 126 vials; in run 6,
378 vials. Run 5 intentionally changed from MD to SD 7 h earlier than in runs 3 and 4. (C) DR as in B, but the frozen mannitol was annealed at slightly different temperatures and times:
Run Annealing temperature (3C) Annealing time (min)
1 !24 18
2 !23.5 18
3 !26 18
4 !24.5 18
5 !24 20
All runs atpc"0.15 mbar,Tshin the first 11 h"03C, thereafter 103C, during SD"303C except run 1pc"0.08 mbar andTsh"!53C
in the first 11 h. (Reproduced with permission from Haseley and Oetjen, 1999.)
inversely related to the maximum temperature and depends strongly on the residual moisture content ($1% or less can be decisive). For crystallized prod-ucts (e.g. antibiotics) the crystal structure must not
change during storage and for glassy products the maximum storage temperature has to be well below
Figure 10 Residual moisture content shown as desorbable water (dW) during secondary drying. Plot 1"plot 1 in Figure 9B; 2"2 (9B); 3"3 (9B); 4"4 (9B); 9"5 (9B); 5"2 (9C); 6"3 (9C); 7"4 (9C); 8"1 (9C); 10"5 (9C); except run 1,pc"0.08 mbar and Tsh"!53C in the first 11 h. (Reproduced with permission from Haseley and Oetjen, 1999.)
effective time: a few hours as opposed to many months up to years.
Relaxation time in molecular conRgurations may be large compared with the drying cycle, but this may be totally different for the long-term storage time. Besides temperature-induced changes, the residual moisture content (RM) can increase the mobility of molecules and promote chemical reactions. The RM at the end of drying can be as speciRed; nevertheless moisture can diffuse from the stoppers closing the vials into the product, raising the RM by several per cent during storage. Stoppers and the gas in the con-tainer of the product have to be dried carefully. On the other hand, ‘the drier the better’ is unjustiRed for many products. The Maillard reaction increases with decreasing water activity (aw"p/ps, where p" va-pour pressure of the product andps"saturation va-pour pressure) as well as the oxidation of fats. InS
u-enza virus in a freeze-dried formulation shows the largest decrease in infectivity at 0.4% and 3.2% RM, while at 1.7% it is about 30 times less. Tissue plas-minogen activator and human growth factor in cer-tain formulations are optimally stabilized if they are surrounded by a monolayer of water molecules (which may not be distributed evenly).
Freeze-Drying Equipment
Figure 11 shows a freeze-drying plant, designed for maximum current demands. The condenser is cooled by liquid nitrogen controllable between!703C and
!1003C (Tco); the brine for the shelves is temper-ature-controlled (Tsh) between #603C and !803C (cooling by liquid nitrogen); the four-stage pump set can reach about 5;10\5mbar (p
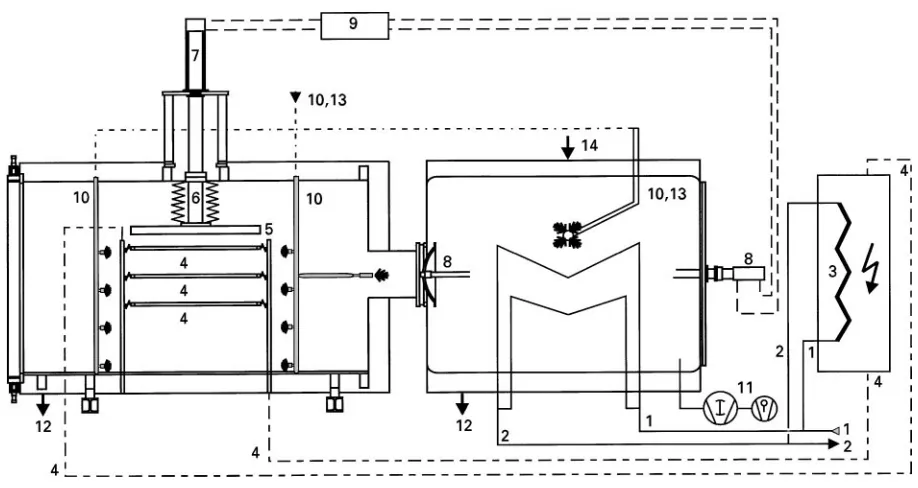
Figure 11 Freeze-drying plant condenser and shelves cooled with liquid nitrogen. Clean In Place system in chamber and condenser. 1, liquid nitogen inlet to condenser and heat exchanger; 2 nitrogen outlet from the condenser and heat exchanger; 3, heat exchanger for the brine in the shelves; 4, brine to and from the shelves; 5, pressure plate for closing vials; 6, piston rod with bellows; 7, hydraulic piston for 5 and 6; 8, hydraulically operated valve; 9, hydraulic system; 10 and 13, water and steam inlets; 11, pumping system; 12, water outlet. (Courtesy of Steris GmbH, HuKrth, Germany.)
pressure plate; the connection between chamber and condenser is as short as technically possible; the valve between chamber and condenser is operated by a fast hydraulic piston; chamber and condenser can be cleaned by a pressure spray and cleaning system (clean-in-place); chamber, condenser and all compo-nents within them can be sterilized by the pressureless Vaporized Hydrogen Peroxide (VHP)威process; load-ing and unloadload-ing of the plant is fully automatic; the documentation and control of the total process from loading to freezing, to drying, to closing of the valves, to venting and unloading can be automatic with no thermocouples in the product; this includes the change from MD to SD, the calculation of the moist-ure content during SD and the termination of the secondary drying at a speciRed moisture content.
If no extreme temperatures are required, refriger-ant compressors can be used for the condenser down to Tco+!803C and for the brine down to
Tsh+!603C, and a three-stage pump set is sufR -cient. If steam sterilization is mandatory, the equip-ment has to be built for pressures up to 2.5 bar and temperatures up to 1253C.
At the other end of the line of freeze-drying equip-ment laboratory installations are found, of which a typical example is shown inFigure 12. Usually the product is frozen in vials or trays in a separate freezer
or in the condenser of the plant and the shelves are only heated. The chamber is often a bell jar,
Tco+!453C,pe+0.05 mbar. It is not advisable to use this type of plant as a pilot plant for process development, because the product temperature is not sufRciently uniform and cannot be controlled accu-rately, especially in the low temperature area.
Regulatory Issues
In the Validation Documentation Inspection Guide, US Department of Health and Human Services, Food and Drug Administration, 1993, process validation is deRned as follows:
E Establishing documented evidence, which provides a high degree of assurance that a speciRc process will consistently produce a product meeting its predetermined speciRcations and quality at-tributes.
Figure 12 Schema of a laboratory freeze-drying plant: 1, two-stage vacuum pump; 2, exhaust filter; 3, valve; 4, refrigeration compressor; 5, liquefaction of refrigerant; 6, valve; 7, filter; 8, injection valve; 9, drain valve; 10, ice condenser; 11, pressure switch; 12, ventilator; 13, drying chamber with heated shelves and closing system for stopper of vials. (Lyovac威GT 2, Courtesy of Steris GmbH, HuKrth, Germany.)
In the European Union, the directive 91/356 EEC provides the principles and guidelines of Good Manu-facturing Practice (GMP). In a series of annexes, supplementary guidelines are covered, but up until 1996 only ‘Annex 1: Manufacture of Sterile Medical Products’ has been revised. In spite of all these guide-lines and annexes, Monger summarized the situation for the user of freeze-drying processes and installa-tions as follows: ‘It might be expected that some substantial guidance would be provided. Regrettably, this is not so’.
Powell-Evans provided a range of advice on how to ‘streamline validation’, which he calls ‘one of the most time-consuming and costly exercises faced by pharmaceutical manufacturers’. The qualiRcation and validation of freeze-drying installations and pro-cesses for the production of pharmaceuticals cannot be summed up in this section. For cosmetic and food products regulatory issues, depending on the country of manufacturing and use, have also to be followed.
Conclusion
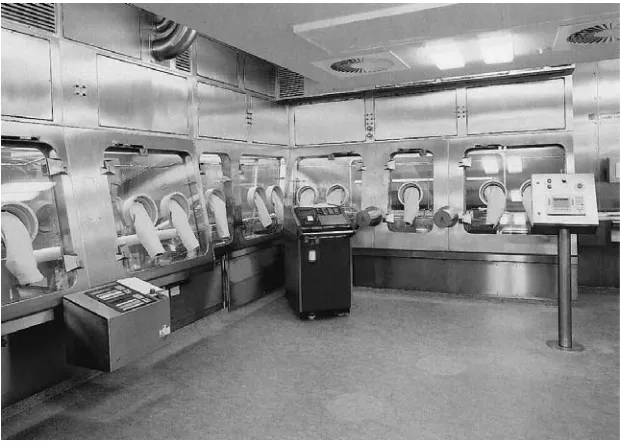
Figure 13 (See Colour Plate 37). Isolator, Class 100, for filling, transportation and loading of vials into the freeze-drying plant. Decontamination of the isolator and the equiment therein is accomplished by vaporized hydrogen peroxide (VHP). The VHP 100威 generator can be seen in the centre in front of the isolator. (Courtesy of Steris GmbH, HuKrth, Germany.)
unloading from the chamber in isolators as shown in Figure 13; (3) to exclude human error as much as pos-sible and to have each step documented by computer.
To automate an existing process can be more difR -cult than to develop a new automated process. This is based on several factors. The formulation of the drug has to reSect the automation, e.g.Rlling and loading can require hours, during which the solution has to be stable, possibly at room temperature. Freezing of the product on the shelves and drying in the chamber have to be executed without temperature sensors in the product; other methods of temperature control have to be used, tested and installed. Criteria have to be deRned for the automatic change from main to secondary drying. Automatic termination of the sec-ondary drying has to be effected when certain measurable events are accomplished. Besides these main points several others have to be evaluated. More accurate and independent sensor systems will inS u-ence freezing and drying procedures. The required data processing and the actuators to fulRl the com-mands are available today.
See Colour Plate 37.
Further Reading
Bellissent-Funel MC and Teixera J (1999) Structural and dynamic properties of bulk and conRned water. In: Rey
L and May JC (eds) Freeze-Drying/Lyophilization of Pharmaceutical and Biological Products, pp. 53}77. New York: Marcel Dekker.
Hanafusa N (1992) The behavior of hydration water of protein with the protectant in the view of HNMR. In: May JC and Brown F (eds) Developments in Biological Standardization, vol. 74, pp. 241}253. Basel: Karger.
Kochs M, KoKrber Ch, Nunner B and Heschel I (1991). The inSuence of the freezing process on vapor transport during sublimation in vacuum-freeze-drying. Interna-tional Journal of Heat and Mass Transfer 34: 2395}2408.
Monger P (1997) Freeze dryer validation. In: Cameron P (ed.) Good Pharmaceutical Freeze-Drying Practice, p. 157. Buffalo Grove, IL: Interpharm Press.
Oetjen GW (1999) Freeze Drying, ch. 1.1.5. Weinheim: Wiley}VCH.
Oetjen GW (1999) Freeze Drying, ch. 1.2.4. Weinheim: Wiley}VCH.
Pikal MJ (1999) Mechanisms of protein stabilization during freeze-drying and storage: the relative import-ance of thermodynamic stabilization and glassy state relaxation dynamics. In: Rey L and May JC (eds) Freeze-Drying/Lyophilization of Pharmaceutical and Biological Products, pp. 161}198. New York: Marcel Dekker.