1
Brexit has us all on Edge
:
An Investigation into the Predictive Efficacy of Investor Sentiment
Proxies on Irish Stock Market Returns during Brexit.
Written by:
Daniel Flynn
For the degree title:
M.Sc. (Research) in Computer Science Word count — 16,853
Degree awarded:
(August, 2019)
Student Number: 12307076
Email: dflynn5@tcd.ie
Supervisor: Prof Khurshid Ahmad (kahmad@scss.tcd.ie)
2
Abstract
In this piece of research, we examine the evolution of sentiment proxies, commonly used to account for investor behaviour in the financial economics literature. Advancements in computing techniques, such as sentiment analysis and natural language processing (NLP), have allowed the creation of investor sentiment proxies directly from textual news data. Recent literature identifies that such proxies may be used to predict movements in financial assets, particularly during heightened periods of investor sensitivity — recessions, bad news cycles, etc.
Plagiarism Declaration
3
Plagiarism Declaration
I hereby certify that the work contained within this piece is my own original
work. Where research, ideas and findings of others are presented, they have
been fully and adequately cited as per the plagiarism guidelines set-forth by
Trinity College Dublin, University of Dublin.
Name
: Daniel R. Flynn
Signed
: ____________________
4
Acknowledgements
Huge thanks also go to my roommates in 116, Artur and Aimee — each
provided support in their own way and boat-loads of laughter during my tenure.
My final thanks go to Dr. Stephen Kelly. You were always open to my
questions, provided clarifications when the weeds surrounded me and
forced-me-static — and you, more than anyone, helped me to muddle through.
“One fine morning in May, a slim young horsewoman might have been seen
riding a glossy sorrel mare along the avenues of the Bois, among the
Tables & Figures
5
Table of Contents
Chapter One — An Introduction ... 7
1.1 — Introduction ... 7
Chapter Two — A Review of the Literature ... 9
2.1 — Introduction ... 9
2.2 — The efficient market hypothesis ... 9
2.3 — Behavioural finance and its relationship to the EMH ... 11
2.4 — Exogenous news and evolving sentiment proxies ... 13
2.4.1 — Early sentiment proxies ... 13
2.4.2 — Sentiment analysis: Generating proxies from published news ... 15
2.5 — Résumé ... 17
Chapter Three — Methodology for Analysis ... 18
3.1 — Introduction to research methodology ... 18
3.1.1 — Overview of chapter ... 18
3.1.2 — Research questions ... 18
3.2 — Extraction of sentiment data using RockSteady ... 21
3.3 — Dictionaries: Construction and use ... 23
3.3.1 — Dictionary construction and pre-processing ... 23
3.3.2 — General Inquirer (base dictionary) ... 25
3.3.3 — Domain dictionaries ... 26
3.4 — Constructing a ‘Brexit’ Corpus ... 32
3.4.1 — Collection of articles from Lexis Nexis ... 32
3.4.2 — Descriptions of ‘Brexit’ News Corpus ... 33
3.4 — Creating, cleaning and pre-processing a dataset for analysis ... 35
3.5.1 — Data collection ... 35
3.5.2 — Pre-processing of data ... 37
3.5.3 — Statistical methods ... 38
3.6 — Résumé ... 39
Chapter Four — Analyses, Observations & Findings ... 40
4.1 — Overview of chapter ... 40
4.2 — The relationship between daily returns for the ISEQ 20 and our sentiment indicator ... 40
4.2.1 — Exploratory analysis ... 40
4.2.2 — Linear regressions for returns and sentiment (daily) ... 43
4.2.3 — Vector Auto-Regressive (VAR) models for returns and sentiment (daily) ... 49
4.3 — The relationship between monthly returns, the NSI, and existing measures of public sentiment ... 51
4.3.1 — Linear regressions for returns and sentiment indicators (monthly) ... 51
4.3.2 — VAR models for returns and sentiment indicators (monthly) ... 53
4.5 — Résumé ... 56
Chapter Five — Review, Conclusions & Avenues for Further Work ... 57
5.1 — Introduction ... 57
5.2 — Retrospective on the first research question ... 57
5.3 — Retrospective on the second research question ... 60
5.4 — Concluding remarks & future avenues of research ... 62
6
Tables
Table 1: Breakdown of ‘Persons of Interest’ dictionary……….…..29
Table 2: Overview of Brexit dictionary………....31
Table 3: Description of search criteria………...32
Table 4: Snapshot of corpus composition………....34
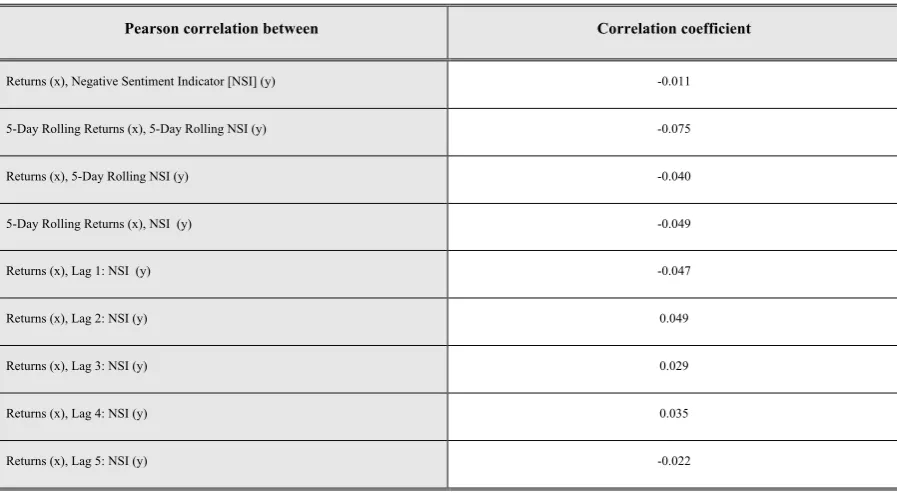
Table 5: Correlations between returns and NSI………...41
Table 6: Preliminary regression results for sentiment and returns with lags…………...44
Table 7: Akakie information criteria (AIC)……….…45
Table 8: Tests for autocorrelation and heteroscedasticity………...46
Table 9: Regression results of select models with HAC standard-errors………....48
Table 10: Capturing intertemporal relationships: Select models of interest …………..50
Table 11: Regression results for sentiment indicators on returns (monthly)………...…52
Table 12: Regression results for multiple OLS models (monthly)………..54
Figures
Figure 1: A schematic of the RockSteady text analytics engine……….….22Figure 2: Quartile-quartile plots……….….38
Chapter One: An Introduction
7
Chapter One
— An Introduction
1.1
— Introduction
Understanding the movements of financial markets has long been an area of intense interest in the fields of finance, economics, mathematics and computing, among others. However, of all these fields, arguably none has made a greater impact on modern financial markets than computing in the last fifty years. The introduction of computing has allowed individuals to process huge amounts of data, uncover patterns in market behaviour and, hopefully, generate profits for those involved. For others driven by knowledge alone — computing paved a way to better understand markets which, for all intents and purposes, seemed wholly random.
Our research begins with the efficient market hypothesis (EMH) of the 1960-1970s. The EMH held that investors behaved rationally in markets, information from news events was incorporated instantly into price, and patterns in price data alone couldn’t be used to
continuously earn excess returns in the long term. The price of a financial asset was held to contain the ‘full information’ available about the asset.
But over time these ideas were challenged — and empirical examples of irrational investor behaviour and market inefficiencies began to appear. The field of behavioural finance emerged, centred on investor biases and irrationality, which could account for market moves that the EMH could not satisfactorily explain. It seemed that investor sentiment, if measured properly, could account for patterns of irregular behaviour — like those following IPOs, company announcements or large news events.
It is this last case that we’re primarily interested with in our research. Early proxies of
8
Computing advancements in sentiment analysis and natural language processing (NLP) allowed the creation of such sentiment proxies from large quantities of text-based news data. Early work had hypothesised a connection, but semantic information had to be extracted by hand limiting the creation of datasets and the replicability of techniques. Modern computing techniques changed this, enabling the analysis, extraction and modelling of sentiment time-series against financial returns. Recent research builds on these breakthroughs to expand the creation of sentiment proxies using news to other markets, periods and assets.
The focus of our research is the creation of one such sentiment proxy for the Irish Stock Market, which we refer to as the negative sentiment indicator (NSI). By employing
techniques present in the literature, we construct a measure of negative sentiment which we extract from a corpus of ‘Brexit’-related news gathered from Irish publications. We then analyse the NSI against returns for the ISEQ 20 Index, a measure of Irish Stock Market performance.
Chapter Two: A Review of the Literature
9
Chapter Two
— A Review of the Literature
2.1 — Introduction
This chapter opens with an overview of the efficient market hypothesis (EMH), a prominent hypothesis about the functioning of financial markets. This is followed by an introduction to behavioural finance approach, which supplanted the EMH’s primacy in the 1990s.
Behavioural finance addresses several market inefficiencies in the EMH, produced by irrational investor behaviour, and measured through investor sentiment. Investor sentiment refers to a measure of investor behaviours created through various sentiment proxies and is used to predict stock price movements. From here we briefly chart the evolution of sentiment proxies within the financial literature, before reaching more modern approaches for
extracting sentiment time-series from text-based news data.
2.2 — The efficient market hypothesis
Understanding the behaviour of stock market prices has long been an area of interest within both academia, and the wider financial industry. In the 1960s, Eugene Fama (1965), along with other authors at the time (Mandelbrot, 1966; Samuelson, 1965), introduced empirical evidence in support of the random-walk hypothesis. Said hypothesis states that ‘the future price movements of a security are no more predictable that those of a series of cumulated random numbers’ (Fama, 1965). Put simply, informational flow in markets is assumed to be unimpeded and immediately updates prices. Updates are exogenous in nature, e.g. coming from news — and news, by its nature, is unpredictable; hence, ‘tomorrow’s change in price is the result of tomorrow’s news and is independent of price changes today’ (Malkiel, 2003).
10
markets immediately discount all available information for listed assets — and neither technical nor fundamental analysis would allow investors achieve greater returns than holding a randomly selected portfolio of individual stocks with comparable risk (Malkiel, 2003). In this manner markets are said to be efficient with respect to information if prices ‘fully reflect’ all of the available information (Naseer & Bin Tariq, 2015).
Following this early hypothesis, Fama (1970) then presents three forms of efficiency: Weak-form, semi-strong form and strong-form market efficiencies. Weak-form efficiency posits that excess returns in the long run may not be generated from technical analysis using historical price data alone. Such that future price movements may be attributed solely to information existing outside of the price series itself. Semi-strong and strong-form efficiency relate to the speed at which prices adjust to new information, with the former proposing rapid, unbiased price adjustments to public information, e.g. corporate announcements1 and economic events. The latter case assumes that all information — public or private — is instantly incorporated into price and no investor has monopolistic access to information (Fama, 1970). In both cases, the author posits that it shouldn’t be possible for an investor to generate excess returns acting on new information, with technical or fundamental analysis.
Since its introduction the EMH has seen a large body of empirical and theoretical literature supporting and contradicting its claims in the domains of economics and quantitative finance. A thorough representation of this entire body of literature, spanning over 50 years, is outside the scope of this piece of work. There are already a number of excellent resources available detailing much of this debate: see Malkiel (2003), Yen and Lee (2008) and Naseer and Bin Tariq (2015). Instead we turn our attention to behavioural finance which introduces the concept of investor sentiment as an explanation for some of the anomalies shown to arise under the EMH.
Chapter Two: A Review of the Literature
11
2.3 — Behavioural finance and its relationship to the EMH
Behavioural finance represents one of the most actively researched areas in opposition to the traditional EMH outlined previously. Early work by Tversky and Kahneman (1974)
demonstrated that when making judgements under uncertainty, such as in financial markets, decision-makers often employed heuristics which incorporate certain biases. These
heuristics, while economical and effective, produce systematic and predictable errors.
The idea that individuals don’t behave as rational investors when faced with unexpected news was studied by De Bondt and Thaler (1985). This seminal work built upon that of Tversky and Kahneman (1974) to demonstrate that overreactions are present in price data, uncovering the potential presence of weak-form market inefficiencies by observing
portfolios of “winners” and “losers”. The authors show that the “losers” — those stocks underperforming on P/E metrics and returns prior to portfolio formation — go on to
outperform the market and the “winners” portfolio despite being significantly less risky than their “winning” counterparts (De Bondt & Thaler, 1985).
Early proponents of behavioural finance pointed to De Bondt and Thaler (1985) and other empirical studies as evidence that corporate cash flows are highly mean-reverting (Haugen, 1996). The claim was that investors’ appraisals of these securities are irrational, i.e. they were influenced by recent events in a compounding manner, pushing the security’s value above or below its underlying value. As Haugen (1996, pp. 87) states;
“Upon seeing a sequence of good (bad) earnings reports, investors drive the prices of stocks too high (low) based on the perception that the sequence of good (bad) past reports foretells of many more similar reports coming in the future”.
12
returns, or the IPO “pop” phenomenon, were conducted and found a similar market underperformance to that identified in De Bondt and Thaler (1985) (Baker & Wurgler, 2006). Other studies have examined the ‘hotness’ of markets, a team referring to positive investor sentiment, to explain first day price-pops; making use of sentiment proxies such as grey market prices (Cornelli et al., 2006), book-building investors as noise-trader proxies (Derrien, 2005) and underwriter/investor demand curve modelling (Ljungqvist et al., 2006).
The forms of efficiency put forward by Fama (1970) were effectively re-evaluated by mounting empirical research from behavioural finance. Thaler (1993), one of the leading scholars in the area, edited a collection of said works. According to Fridson (1994), this research cast the picture of a rational investor into doubt given the ‘apparent presence of dark forces in the price-discovery process’. We borrow directly from Fridson (1994) who summarises the alternative paradigm of EMH posited by Thaler (1993):
• Weak-form: Some investors fail to behave rationally, and the distortions this causes are corrected by arbitrageurs who use correct pricing models.
• Semi-strong form: Prices diverge for extended periods and by a non-insignificant amount from their correct level due to persistent analytical errors.
• Strong-form: Company financial performance is near-dislocated from the security’s price. Market price change is driven by bouts of irrational investor sentiment.
Robert Shiller, another proponent of behavioural finance, points to historical evidence of ‘feedback models’ which may partially account for periods of volatility in returns as well as the irrational behaviour of investors (Shiller, 2003). Shiller notes that ‘while the scholarly literature has been slow to accept ideas of sentiment creating price distortions, such theories about financial markets were expressed long ago in more informal publications’. Price-to-price feedback theory, as it were, suggests the following;
Chapter Two: A Review of the Literature
13
Shiller (2003) asserts that behavioural finance countered the idea that financial markets always worked efficiently, and that all price changes reflect genuine information. There exist prolonged periods of price-discovery which may be caused by events, news, pervasive investor sentiments or a combination of all of these factors. Fama (1998) refutes much of the behaviourist claims against the EMH — citing the tendency for investors to overreact and underreact in relative proportion to each other, as well as the reversal of the anomalies cited in studies.
Shiller (2003) asserts that this thinking misses the point of the behavioural finance approach — just because people tend to behave a certain way does not mean that they predictably will. Rather behavioural finance helps researchers understand periods of anomalous behaviour with regards to pricing. And, likewise, regression to the mean is not an indicator of a truly efficient market if the time horizon to correct stock price is days, months, or years (bubbles) from an event.
2.4 — Exogenous news and evolving sentiment proxies
2.4.1 — Early sentiment proxies
Previously, we presented literature reflecting the idea that investors may behave irrationally when faced with new information, e.g. news. Said events may distort the price discovery process leading to inefficiencies in financial markets. However, the literature quantifying sentiment is itself of considerable interest to our research.
In the domain of financial economics sentiment analysis typically refers to ‘the derivation of market confidence indicators from proxies such as stock prices and trading volumes’ (Devitt & Ahmad 2007, pp. 984).
14
computers for sentiment analysis, instead relying on hand classification of headlines into 19 semantic categories. This early scholarship on the impact of news events on markets
identified a relationship between the two — in particular the overreaction of markets to bad news.
Niederhoffer (1971) identifies that large changes in markets increase in likelihood following world events by his definition. However, of particular interest is the increased frequency of large changes when world events occur in clusters rather than as isolated incidents. This may, perhaps, point to increased volatility in markets arising from a perceived uncertainty. Niederhoffer also comments on the typical behaviour of markets on days following these events — namely, that that price changes on the first and second day following a world event tend to exhibit the same directionality of change. By incorporating knowledge of news events, price changes — at least in the limited short run — demonstrate some weak patterns.
Engle and Ng (1993) also explore the impact of news on volatility utilising daily Japanese stock prices. The authors derive a proxy for news from a measure unexpected returns, which signifies an event in their series. The authors find that ‘negative shocks introduce more volatility than positive shocks, with this effect particularly apparent for the largest shocks’ (Engle & Ng, 1993).
Seminal work by Cutler, Poterba, and Summers (1988) also focuses on connecting exogenous news with stock price movements. The authors derive their proxy for
macroeconomic news by using a combination of seven monthly macroeconomic indicators such as Moody’s AAA corporate bond yield, the Consumer Price Index and the logarithm of the real money supply for the USA. They note that their approaches fail to account for much of the variance present in whole-market movements2 over the period examined, and the inclusion of important qualitative stories does not aid predictive power without their macroeconomic indicators.
Chapter Two: A Review of the Literature
15
One point of note from these early examples is that aside from Niederhoffer (1971), the other authors derive their news proxies from sources that aren’t news publications. The justification for such an approach is evident — quantification of sentiment in textual news for use in statistical models at the time was quite difficult. More recent publications in the domain of finance also make use of proxies for investor sentiment derived from price data, as well as other trade-related data, macroeconomic indicators, etc. (Baker & Wurgler, 2006; Cornelli et al., 2006; Derrien, 2005; Ljungqvist et al., 2006). However, with marked
improvements in natural language processing (NLP) and sentiment analysis techniques in the 21st century, we saw a shift to new proxies of investor sentiment generated from the news sources themselves.
2.4.2 — Sentiment analysis: Generating proxies from published news
For the purposes of our research, the creation of sentiment proxies from news may be divided into two distinct camps. In the first camp, containing the early work of Niederhoffer (1971), researchers place news sources into relatively coarse categories — with headings such as “good”, “bad” and “neutral” (Hayo & Kutan, 2005). This approach to generating sentiment proxies from news provided some results, but lacked the scientific rigor required for researchers to replicate these approaches globally. The second camp, however,
introduced modern NLP and sentiment analysis techniques which ameliorated some of these issues.
It was Paul Tetlock (2007) who is credited with ‘first finding evidence that news media content can predict movements in broad indicators of stock market activity’. His research centred on analysing the ‘abreast of the market’ column; a well-known financial column published in the Wall Street Journal (WSJ) with strong readership within the financial industry. Tetlock (2007) makes use of the General Inquirer (GI) dictionary, a large dictionary of terms classified into 77 affect categories, such as strong, weak, positive and negative, which are neither mutually-exclusive nor exhaustive.
variance-16
covariance matrix produced from the GI affect categories. Through this method the author develops a pessimism factor which is then applied to forecast returns generated by the Dow Jones Industrial Average (DJIA). There are a number of interesting observations made by Tetlock (2007):
• Pessimism as a category exhibits an inverse relationship with returns, i.e. that periods of high negative sentiment can produce lower stock returns.
• Much of the pessimism factor can be explained using ‘negative’ or ‘weak’ word-counts. Such an approach is easier to interpret directly and the inverse
relationship with returns holds.
• Negative sentiment, proxied by negative terms, shows immediate negative
impacts on returns during the first three-days, before reversing over days four and five. Return reversals typically happen within a trading week (five-days).
Since Tetlock’s seminal publication, there have been a number of publications producing sentiment proxies from news sources directly. These studies appear to corroborate the predictive value of negative sentiment discovered by Tetlock (2007). For instance, Tetlock, Saar-Tsechansky, and Macskassy (2008) demonstrate a link between low firm-earnings and negative sentiment. One which is most evident when news concerns firm fundamentals. Garcia (2013) finds that recessionary periods concentrate the predictive power of sentiment proxies when controlling for well-known price patterns. The author uses measures of positive and negative sentiment extracted from a corpus of New York Times columns using an alternative dictionary specialising in financial terms (Loughran & McDonald, 2011).
More recent work by Ferguson, Philip, Lam, and Guo (2015) measures the effect of positive and negative tone in news using UK publications, firms and stock returns. Lillo, Miccichè, Tumminello, Piilo, and Mantegna (2015) seeks to understand the impact of news events on trader behaviour — breaking down trader-types into household, institutional, governmental, corporate, etc.. The authors employ a number of endogenous factors, e.g. returns and
Chapter Two: A Review of the Literature
17
Finally, Kelly (2016) produces an automatic system for the extraction of sentiment from unstructured text corpora, such as news, along with the creation and modelling of a
sentiment time series with additional financial datum. To evaluate the system, a corpora of domain-related news are collected — along with financial data for equities, using the DJIA, and commodities markets using the West Texas Intermediate (WTI) crude oil price (Kelly, 2016; Kelly & Ahmad, 2018). Similar to previous research, negative sentiment is the most significant predictor of returns in both asset classes, and the two display an inverse
relationship. The authors note that returns exhibit the same reversal process identified by Tetlock (2007), as well as an immediate negative impact in the first three-days.
2.5 — Résumé
In this chapter we introduced the EMH, and some challenges that were subsequently levied against it from the school of behavioural finance. Next followed some of the various proxies used to quantify and model investor sentiment. Of these sentiment proxies, news data
18
Chapter Three
— Methodology for Analysis
3.1 — Introduction to research methodology
3.1.1 — Overview of chapter
In this chapter we begin with an introduction to our research question and our research objectives. Following this, we introduce our methodologies for data creation, which utilise in-part a proprietary system for sentiment analysis developed within TCD.
First, we present the RockSteady system, a text analysis engine which enables the extraction
of sentiment data from unstructured text using domain-specific dictionaries. We then outline the construction and use of said dictionaries, as well as our methodology for the collection of a ‘Brexit’ text corpus. Building on the literature, we create a unique news corpus, and using an ensemble of dictionaries we extract a time series of negative sentiment as our investor sentiment proxy.
With negative sentiment extracted for a period of interest through the aforementioned methods — we then present the methodology for construction of our dataset. The dataset combines the sentiment proxy and financial datum, and aligns these datum for further analysis. Finally, we introduce the statistical methods of analysis.
3.1.2 — Research questions
There is an extensive literature concerning the impact of news on financial returns (Garcia, 2013; Kelly & Ahmad, 2018; Tetlock, 2007; Tetlock et al., 2008). Garcia’s (2013) work demonstrates that during recessionary periods, or times of heightened investor-wariness, that the effects of negative sentiment in news hold the most explanatory power over price
Chapter Three: Methodology for Analysis
19
A relationshipbetween the short-term financial performance of equities and negative
sentiment in print media has previously been demonstrated when coverage explicitly mentions the company (Tetlock, 2007). In these cases a corpora is built either from a single print media outlet, or from multiple outlets in a single region or country — usually
connected directly to the financial market by way of readership (Kelly & Ahmad, 2018).
A recent long-term news event which introduces considerable market uncertainty into a single region or country, is that of “Brexit”, for both the UK and Irish economies.
Uncertainty arises from the potential breakdown of trading relationships between the two countries following a UK exit from the single EU market. Of concern is that exports to the UK account for approximately 15% of Irish goods and services, while in some sectors, like agri-food, this may be as high as 40% (Sunesen, 2018). Hence, for the Ireland, the Brexit process and outcome may have considerable impacts on the national economy.
Furthermore, what makes Brexit an interesting case, is that the term’s creation can be traced back to as recently as 2012.3 Meaning that it’s possible to compile a corpus of print articles which contain “Brexit” and have a definite cut-off point in the recent past. This, combined with the aforementioned uncertainty created in the Irish economy, means that potentially, we can extend the techniques used on multiple financial asset classes to measures of economic performance.
Selecting Ireland as our market of interest, we propose to evaluate whether the research methods used to predict movements in equities can be generalised to market-level when a long-term news event creates economic uncertainty across a period for an entire national economy. We propose to evaluate what predictive power, if any, a negative sentiment-proxy extracted from a Brexit news corpus has over Irish Stock Market performance. Furthermore, we propose to evaluate our negative sentiment proxy against traditional measures of market sentiment. Finally, whether our negative sentiment proxy, or negative sentiment indicator
3 https://www.euractiv.com/section/uk-europe/news/oxford-english-dictionary-the-man-who-coined-brexit/
20
(hereafter, NSI), has any explanatory power over the traditional measures of market sentiment.
|Research Question (1): When a long-term news event creates prolonged investor uncertainty for a national economy, is it possible to predict movements in national stock market performance using sentiment proxies extracted from print media related to said event?
|Null Hypothesis1A: It is not possible to predict movements in national stock market
performance using sentiment proxies extracted from national print media related to the prolonged news event.
|Alternate Hypothesis1A: It is possible to predict movements in national stock
market performance using sentiment proxies extracted from national print media related to the prolonged news event.
|Research Question (2): Given that qualitative measures of market sentiment exist already, is it possible to predict said measures using sentiment proxies extracted from national media during prolonged periods of market uncertainty?
|Null Hypothesis1A: It is not possible to predict qualitative measures of market
sentiment using sentiment proxies extracted from national print media during prolonged periods of market uncertainty.
|Alternate Hypothesis1A: It is possible to predict qualitative measures of market
sentiment using sentiment proxies extracted from national print media during prolonged periods of market uncertainty.
An additional contribution of this piece of work, is the creation of an Irish political
Chapter Three: Methodology for Analysis
21
Ireland. While said dictionary is not the main focus of this body of work, its construction is outlined in this chapter.
|Research objectives
1(i) — Construct corpus of ‘Brexit’ related news from Irish publications
1(ii) — Construct domain dictionaries to facilitate additional analyses of sentiment as it relates to government in Northern Ireland (NI) and the Republic of Ireland (ROI)
2(i) — Construct a proxy for investor sentiment from a corpus of Irish news.
Examine whether negative sentiment in Irish news related to Brexit is correlated with Irish Stock Market performance.
2(ii) — Examine the explanatory power of existing measures of consumer/market sentiment over Irish Stock Market performance.
2(iii) — Evaluate the explanatory power of our negative sentiment indicator (NSI) over existing measures of Irish Stock Market performance.
3.2 — Extraction of sentiment data using
RockSteady
For sentiment analysis we utilised the RockSteady system, a proprietary text analytics system developed in the Computer Science department at Trinity College Dublin. The RockSteady
system performs text analytics on documentation utilising a bag of words approach for sentiment analysis. The bag of words approach analyses structured or unstructured text based on word multiplicity, i.e. the frequency of word occurrences, rather than observing word order or grammatical structure. The system has been previously applied to Irish news media in election cycle to predict candidate/party preference from media coverage (Ahmad, Daly, & Liston, 2011).
RockSteady consists of a text analysis engine that counts the frequency of terms as they
22
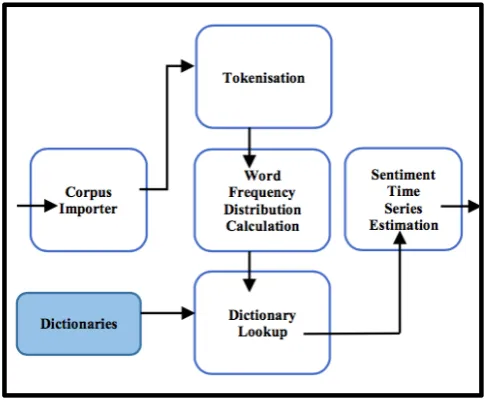
[image:22.595.145.388.243.444.2]we aggregate a ‘Brexit’ news corpus, i.e. a text corpus containing articles associated with ‘Brexit’, following the methodology outlined in Section 3.4. The system is then supplied with multiple dictionaries which enable text and sentiment analysis.
Figure 1: A schematic of the RockSteady text analytics engine
Note: The above diagram provides an overview of the text analytics and sentiment time series estimation output of the RockSteady system. A text corpus is imported, tokenised, and a word frequency distribution calculated. This distribution is then categorised based on the
dictionary (dictionaries) supplied to the system, and a sentiment time series is output which can be used for further analyses.
Said dictionaries contain a list of terms, which may be categorised according to a unifying
topic. RockSteady is capable of working with multiple dictionaries in concert, and for the
purposes of our research we create two additional specialist domain-dictionaries which augment the base dictionary. The base dictionary, for the purposes of our research, refers to a well-known, expert-compiled dictionary of terms and sentiment call the General Inquirer (GI) dictionary (P. J. Stone, Dunphy, & Smith, 1966; P. J. Stone & Hunt, 1963; P. J. H. Stone, Earl B, 2018). Said dictionary contains the Harvard-IV psychosocial dictionary,
which is a list of terms compiled, categorised and labelled for various affect categories by
Chapter Three: Methodology for Analysis
23
Additional dictionaries may also be created and imported into RockSteady depending on the
domain one wishes to examine. Said dictionaries allow one to extract and analyse sentiment from sub-populations within the corpora, according to the additional categories supplied. In the course of our research, we create a ‘Persons of Interest’ dictionary, which contains the majority of all the publicly-elected officials for the governments of the Republic of Ireland and Northern Ireland — and we create a lexicon of Brexit-terminology from publicly available sources.
An example of the function of multiple dictionaries, is that one can analyse all those texts within the corpus that relate to a category, e.g. a political party, and then the affect categories associated with that sub-population. Hence, it is possible in theory to generate a time series
of negative sentiment, where articles represent Fine Gael, and concern the topic of Brexit
because of the supplied corpus.
We normalise the sentiment generated with our dictionaries by dividing the total frequency of negative sentiment by the total number of terms in the document, and organise this score according to time allowing us to compare the level of sentiment in each document.
Organising the output of the text analysis in this manner allows the sentiment variable to be aligned with other time series data such as the return of a financial asset. These variables may then be modelled to estimate any potential inter-relationships between text sentiment and financial assets.
3.3 — Dictionaries: Construction and use
3.3.1 — Dictionary construction and pre-processing
Critical to our analyses with RockSteady is the construction and implementation of various
24
[character strings] initially form a column vector of length ‘m’, with additional categories
[character strings] for each term populating a row vector of length ‘n’. Hence, our constructed dictionaries take the form of ‘m x n’ matrices, stored as text files, which are readable in Rocksteady.
A term by our definition, may be a singular word or compound-phrase (multiple words) which is placed in the dictionary and then assigned zero or more categories as a description. We define a category as an arbitrary label applied to a term. Categories may denote
sentiment, groupings or any arbitrary categorization of terms. Constructing a dictionary in this manner allows one to analyse text corpora in sub-populations according to the categories of interest.
We specify zero or more categories for each term because, in the case of domain
dictionaries, the inclusion of a term without a category label appendage still serves a purpose in analysis. Namely, such an un-appended term in a domain dictionary overwrites categories (or otherwise) present in the base dictionary. For instance, in the GI dictionary the term ‘fine’ is classified as negative, i.e. to monetarily fine a person. However, in our corpus of Irish news, the political party ‘Fine Gael’ is incorrectly classified as a negative affect category, because ‘Fine’ is tagged as a negative term. The inclusion of ‘Fine Gael’ in a specialist domain dictionary overwrites this misclassification.
Additionally, if terms such as names contain a prefix, suffix, middle-name or nickname, the entry is duplicated as many times as required, creating each possible permutation of the term. These variations of the term (name) are then listed along with the unaltered original name. This ensures that the system can handle variations that may appear in the corpora. For example, John Joe Higgins as an entry becomes: 1) John Joe Higgins and 2) John Higgins.
Chapter Three: Methodology for Analysis
25
Union’, which requires us to add the term ‘EU’ to our dictionary. The inverse of this process handles the transformation of abbreviations.
For ease of analysis, RockSteady isn’t case-sensitive, and part of our pre-processing method involves the cleaning of dictionary terms. Terms are generally comprised of alphabetical characters only, with the addition of a space to separate compound-phrases and names. Where an Irish name contains a fádá we hold high fidelity to the original, as our corpus is comprised of Irish news. A test was carried out to verify that the inclusion of fádás was appropriate for our analyses. We sampled our corpus for both variations of terms and names, i.e. with and without fádás, and found that Irish news favoured the fádá spelling in all cases examined. There was also no material difference in the sentiment scores produced between each approach.4
3.3.2 — General Inquirer (base dictionary)
The General Inquirer (GI) lexicon is a collection of over 20,000 general language terms created by P. J. Stone et al. (1966). This lexical record, originally created by experts in social sciences, computing and linguistics, provides a number of descriptive categories for terms, including affect categories representing the sentiment associated with an individual term. The GI lexicon is used as the base dictionary within RockSteady, allowing one to tag words from a corpus with various affect categories: Negative, positive, weak, strong, economic, etc. For the purposes of our investigation, we use the negative affect category — for reasons previously identified in the literature.
The GI dictionary may be acquired in its original form from the General Inquirer site.5 As previously mentioned, the GI provides a base dictionary to the RockSteady system, one which is then overwritten with custom-made domain dictionaries for the purpose of our analyses. While the GI dictionary allows us to drill-down into text corpora by affect
4We examined the top and bottom 10 articles across negative sentiment, and sub-groupings of parties, for fádá
variations. We found no difference in ordering, and an acceptable variance in scores (+/- 0.5%) between both scores.
26
category, the introduction of domain dictionaries allows us to drill-down into additional categories of interest and then analyse by affect category. In this manner one could group articles related to a particular topic, or those which reference a particular person, and then evaluate affect categories present in that sub-population of the larger corpus.
3.3.3 — Domain dictionaries
3.3.3.1 — Overview of the domain dictionaries
The construction of domain dictionaries involves the collection of terms which appear in the lexicon of the domain one wishes to analyse. Features which characterise each term, or a collection of terms, may be specified in the construction of the domain dictionaries — similar to the specification of affect category in the GI. Categorisations and groupings allow for further analysis, e.g. by political party or region, using our domain dictionaries.
For the purposes of our investigation we construct two domain dictionaries. A ‘persons of interest’ dictionary was created from an amalgam of political representatives for both the Republic of Ireland (ROI) and Northern Ireland (NI). While an additional ‘Brexit’ domain dictionary was constructed from various public sources which described the Brexit lexicon as it evolved through time.
3.3.3.2 — Building a ‘persons of interest’ dictionary
We constructed four separate dictionaries containing ROI and NI politicians. Once constructed, these four dictionaries were amalgamated to form a ‘persons of interest’ dictionary, and stored as a single text file.
From the ROI we listed Teachta Dála (TDs)6, which belong to the Oireachtas, the ROI’s equivalent to parliament. From NI we listed members of parliament (MPs)7 and Members of
6Taken from the Oireachtas website: http://www.oireachtas.ie/parliament/tdssenators/tds/ [Accessed:
01/07/2019].
7Taken from the UK Parliament website: https://www.parliament.uk/mps-lords-and-offices/mps/ [Accessed:
Chapter Three: Methodology for Analysis
27
the Legislative Assembly (MLAs)8 — the former are elected to sit in the House of
Commons, the lower house of the UK’s Parliament. The latter represent a devolved form of government within NI, in which representatives are elected to an assembly to manage national issues. For both the ROI and NI, we construct a dictionary containing Members of the European Parliament (MEPs).9
In each of the aforementioned dictionaries, we map the terms, i.e. politicians’ names and their variants after pre-processing, to categories of interest: the role (TD, MP, etc.) and party affiliation (Sinn Féin, Fine Gael, etc.), along with constituency-related information. Mapping party affiliation in this manner may allow us to represent sentiment related to a particular party in a different manner — by aggregating from the individual party member to the party as a whole as opposed to searching for articles with the party name included. This way, when one drills-down based on party, we can be sure that a party representative is explicitly mentioned by name in each of the articles included in the sub-population.
An alternative method for tracking Brexit sentiment related to political parties in Ireland would involve populating a domain dictionary with party names (term), and then specifying the party name as a category. While this approach provides comparable sentiment scores for our corpus10, it limits additional avenues for analysis which we can derive by aggregating party information from the individual. For instance, if our dictionary simply contained party names as terms, then we lose potentially valuable regional information.
3.3.3.3 — Aligning non-concurrent political tenures in our dictionary
One of the issues which presented itself when we elected to aggregate party data from the individual to the party were changes in office which took place overtime, namely people who lost and gained positions. For instance, of the four elected positions collected for our
8Taken from the Northern Irish Assembly website: http://www.niassembly.gov.uk/ [Accessed: 01/07/2019]. 9Taken from the European Parliament website: http://www.europarl.europa.eu/ireland/en/your-meps
[Accessed: 01/07/2019].
10 We contrast a dictionary with political parties (terms) mapped to themselves (category), e.g. Sinn Féin (term)
28
‘persons of interest’ dictionary, only MEPs remained unchanged through the period of interest. The current (8th) term for MEPs lasts from 2014-2019.11
The Dáil for instance, which houses the TDs, held a general election during our period of interest, moving from the 24th to the 25th Dáil, which remains in place. The final sitting for the 24th Dáil was the 3rd of February, 2016, with elections taking place that month, and the first sitting of the 25th Dáil taking place on the 8th of June, 2016.12 We elected to complete our study with the current sitting of the Dáil only.
Similarly, the House of Commons in the UK also dissolved the 56th parliament and held elections to create the 57th parliament in 2017. Northern Irish MPs number 18 in total, the 57th parliament saw eight of these positions change between elections (44%).13 For our purposes, we used only those listed in the 57th parliament in dictionary construction.
The Assembly in Northern Ireland has also seen considerable changes in composition. The current assembly, the 6th, was elected on the 2nd March, 2017 — triggered automatically by the resignation of, and failure to appoint a new, deputy first minister. The 4th assembly dissolved in early 2016, and was replaced by the 5th — elected on the 5th of May, 2016. Additionally, between the 5th and 6th assemblies, the number of MLAs was reduced from 108 to 90. Between the 4th and 5th assemblies, 45/108 MLAs were replaced (42%). Whereas between the 5th and 6th assemblies 12/90 MLAs were new to the position (13%).14
In addition to these changes, the Assembly has not exercised its executive functions since January 2017 (BBC News, 2018). For the purposes of our investigation, the ‘persons of interest’ dictionary contains just the MLAs of the 6th assembly.
11http://www.europarl.europa.eu/meps/en/map.html [Accessed: 01/07/2019].
12Dates courtesy of the Oireachtas website: https://www.oireachtas.ie/en/debates/dail-and-seanad-terms/
[Accessed: 01/07/2019].
13Data collected from UK parliament website: https://www.parliament.uk/mps-lords-and-offices/mps/
[Accessed: 01/07/2019].
14Calculated from data collected from the Northern Irish Assembly website: http://www.niassembly.gov.uk/
Chapter Three: Methodology for Analysis
29
A limiting factor of our work is deciding whether it is better to aggregate party sentiment from all persons that held positions during the period of interest, or to limit it to those to only those most recently elected officials. For the purposes of our investigation, we elected to confine our dictionary entries to the most recent cases given that our final period of analysis covers January, 2016 to July, 2018 — this is due to the frequency of Brexit publications needed to form a continuous time series of sentiment data.
3.3.3.4 — Incorporating geographical information
In addition to creating categories based on party affiliation, each elected official, with the exception of MEPs, represents a particular constituency or geographical region on the Island of Ireland. When we constructed the dictionaries of elected officials, we included this
[image:29.595.107.559.403.769.2]constituency-related information. Using this information, it was possible to introduce additional categories to the ‘persons of interest’ dictionary.
Table 1: Breakdown of ‘Persons of Interest’ dictionary
‘Persons of Interest’ Dictionary
Number of Terms 292 (including amendments)
Categories gathered from TDs TD, Social Democrats, Sinn Féin (ROI), Labour Party, Independents 4 Change, Independent, Green Party, Fine Gael, Fianna Fáil, Ceann Comhairle, AAA–PBP, constituency-based information
Categories gathered from MLAs
MLA, Democratic Unionist Party, Sinn Féin, Social Democratic and Labour Party, Ulster Unionist Party, Alliance Party of Northern Ireland, Green Party in Northern Ireland, People Before Profit Alliance, Traditional Unionist Voice, Independent Unionist, constituency-based information
Categories gathered from MPs MP, Democratic Unionist, Sinn Féin (NI), Independent, constituency-based information
Categories gathered from MEPs MEP(All), MEP(NI), MEP(ROI), national party affiliation
Final categories (used + created*)
MLA, TD, MP, MEP(NI), MEP(ROI), MEP(All)*, Democratic Unionist Party, Sinn Féin (NI), Sinn Féin (ROI), Sinn Féin (All)*, Social Democratic and Labour Party, Ulster Unionist Party, Alliance Party of Northern Ireland, Green Party of Northern Ireland, People Before Profit Alliance, Traditional Unionist Voice, Independent Unionist, Social Democrats, Labour Party, Independents 4 Change, Independent, Green Party, Fine Gael, Fianna Fáil, Ceann Comhairle, AAA-PBP, Connacht*, Ulster*, Munster*, Leinster*, Border Counties*, Dublin*, Remaining Counties of Ireland*
Sources used
TDs: http://www.oireachtas.ie/parliament/tdssenators/tds/ [Accessed: 01/07/2019].
MLAs: http://www.niassembly.gov.uk/your-mlas/ [Accessed: 01/07/2019].
MPs: https://www.parliament.uk/mps-lords-and-offices/mps/ [Accessed: 01/07/2019].
30
Using constituency as a category was quickly determined to be impractical15, and of little added-value. Instead we used the constituency information to create composite categories. We began by categorising politicians (terms) based on county, and then aggregated these into an additional four categories representing the four provinces of Ireland: Munster, Leinster, Ulster and Connacht.
Due to the political nature of Brexit, as well as the historical and the perceived significance of the border between NI and ROI during the negotiation period, we constructed a border category within the persons of interest dictionary. Using the county information, we categorised politicians into border counties16, i.e. politicians who represented constituents within counties that would be directly affected by the imposition of a border between NI and ROI. Given the significance of this issue within Irish news, this composite category may provide additional insights otherwise unavailable to us in the future.
3.3.3.5 — Constructing a ‘Brexit’ dictionary
We noted previously that our analyses using RockSteady benefit from an additional domain dictionary to overwrite the sentiment classification of some terms in the GI, where
appropriate. For the purposes of our research, we created a Brexit domain dictionary from a number of Brexit-lexicons available.
This dictionary contains only the terms themselves, as a singular column (1 x n), and does not further categorise the terms. Contrary to the categorization systems which could be devised for elected officials, our Brexit term dictionaries were constructed from glossaries and lexical collections compiled by various sources. In this instance, our choice of source material made the construction of a rigorous methodology for further analysis quite difficult. Ultimately, we determined that the creation of a simple dictionary for the purpose of
15Additional categories in a dictionary adds complexity to RockSteady’s calculations. The addition of multiple
constituencies was computationally costly and provided no additional insights.
16 ROI border counties (6): Donegal, Cavan, Sligo, Leitrim, Monaghan & Louth. NI border counties (5): Down,
Chapter Three: Methodology for Analysis
31
reducing some spurious negative sentiment classifications was the natural limit of the scope of the Brexit-term dictionary.
We combined five sources for the Brexit Dictionary,17 creating one list of terms. Each entry listed at source was included, except where an entry was a duplicate. Once a working list of terms had been compiled, the terms were pre-processed, whereby abbreviations were
[image:31.595.84.563.357.590.2]expanded and added — and the inverse, where applicable, was also carried out. For example, if the term ‘European Union’ occurred in a lexicon, then the abbreviated term ‘EU’ would be added to as well, and the reverse if it occurred. The list was then converted to a text file and could be used as an addendum to the GI dictionary.
Table 2: Overview of Brexit dictionary
Brexit Dictionary
Number of Terms 214 (including amendments)
Source(s) For full references see bibliography: Sullivan and Houlder (2017); Gadd (2017); Bergman and Lakhdhir (2018); Williams (2017); BBC News (2016)
Site links
Sullivan and Houlder. Brexicon: your guide to the language of leaving the EU. [Financial Times]
Available: https://ig.ft.com/brexicon/
Gadd. Briefing Paper Number 07840: Brexit Glossary. [House of Commons] Available:
http://researchbriefings.parliament.uk/ResearchBriefing/Summary/CBP-7840 [Accessed: 01/07/2019]. Bergman, Lakhdhir. Keeping Track of the Moving Pieces - Our Brexit Lexicon. [Paul Weiss] Available:
https://www.paulweiss.com/practices/transactional/capital-markets-securities/publications/keeping-track-of-the-moving-pieces-our-brexit-lexicon?id=25862 [Accessed: 01/07/2019].
Williams. The Brexit Lexicon. [Stephen William’s Blog] Available:
https://stephenwilliamsmp.wordpress.com/2017/12/07/the-brexit-lexicon/ [Accessed: 01/07/2019]. BBC News. EU jargon: A-Z guide to Brussels-speak. [BBC News Online] Available:
http://www.bbc.com/news/world-europe-35920422 [Accessed: 01/07/2019].
17Sullivan and Houlder (2017); Gadd (2017); Bergman and Lakhdhir (2018); Williams (2017); BBC News
32
3.4 — Constructing a ‘Brexit’ Corpus
3.4.1 — Collection of articles from Lexis Nexis
For our research purposes we opted to source news articles from a well-known news aggregator, Lexis-Nexis.18 Through the Lexis Nexis portal for news, one can specify search parameters and examine articles related to a topic of choice. With these search features we were able to construct a ‘Brexit’ news corpus. Said corpus contains both major national publications, and smaller regional publications, as well as online media from registered Irish news outlets and press wires. For the purposes of our research, we limit our aggregation of Irish news to those sources available through Lexis Nexis and deem this to be our
[image:32.595.22.514.363.512.2]representative sample — although, undoubtedly, limitations are present.
Table 3: Description of search criteria
Key search parameters for Brexit news corpus in Lexis Nexis
Single Keyword for Search ‘Brexit’
Search criteria Keyword must appear in article title
Countries Publications Collected Republic of Ireland, Northern Ireland
Time period for article search 01/01/2007 – 06/07/2018
Additional constraints Removal of articles <100 words (terms); Removal of duplicates by Lexis Nexis
To construct the Brexit corpus, we specified a single-keyword search using the term ‘Brexit’. Furthermore, said keyword must appear within the title of an article for it to be returned to us. Publications were also limited to those published within the Republic of Ireland and Northern Ireland only. The time period for corpus collection ran from the 1st of January, 2007 until the 6th of July, 2018.
Chapter Three: Methodology for Analysis
33
Finally, we remove duplicate articles and those with <100 words. From our examination of the early search results, we found that articles <100 words were often snippets of articles directing the reader to the full article.19 Duplicates were sometimes present due to the nature of news distributions from larger publications to smaller, and vice-versa. We use Lexis Nexis’ inbuilt comparator, simple sub-string, to remove duplicates.
One issue with using a simple sub-string method for removal of duplicates is that often small, immaterial differences in articles are enough to render them distinct in the algorithm’s view. Classic examples of such differences include extra or redistributed whitespace, the publication’s introduction or sign-off to an article, or simply any additional content that doesn’t alter the piece in a meaningful way — especially if large swaths of the article are taken verbatim from another source.
To verify that duplicates where adequately removed from our corpus, we elect to run an additional similarity check in R. We begin by downloading the articles from Lexis Nexis as a series of text files, combining into corpus, and bucketing our corpus by date. We reason that duplicates should appear within a 5-day window, and apply a cosine similarity measure to these rolling 5-day buckets. As this is a secondary process for duplicate removal, we apply a threshold of 95%. We perform a manual spot check for duplicate articles in 10 of the buckets randomly selected. With no duplicates found we can then import our corpus into
RockSteady for further analysis.
3.4.2 — Descriptions of ‘Brexit’ News Corpus
Once imported into RockSteady, our Brexit news corpus is analysed with the aforementioned dictionaries to extract time series of negative affect, as well as negative affect associated with other categories of interest that we either aggregated or created ourselves, i.e. political parties or border counties, respectively.
19In a randomised experiment we ran, in which we selected articles with <100 words at random from our
34
The final corpus contains approximately 17,000 articles, just under 9,000,000 words, spanning from 01/01/2007 to 06/07/2018. However, the presence of a ‘Brexit’ term in a headline doesn’t appear in our corpus until the 18th of January, 2014.20 Furthermore, the term only appears under these search criteria five times between the 01/01/2007 and the
01/01/2015. For the purposes of our investigation, we require a far greater frequency of publications so that a usable time series may be extracted and analysed with financial data.
[image:34.595.53.536.441.712.2]To achieve this workable time series from the corpus, we examine and frequency of publications in our corpus. From mid-January, 2016, ‘Brexit’ begins to feature daily as a headline within the Irish news sources — this trend persists through the remainder of our research period and into the present day. With a processed corpus, we can extract usable sentiment time series that can form part of our dataset for analysis.
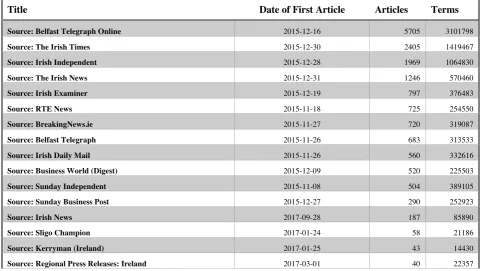
Table 4: Snapshot of corpus composition
20Irish Examiner (2014), see link:
https://www.irishexaminer.com/business/brexit-not-as-cut-and-dried-as-osborne-suggests-255753.html[Accessed: 01/07/2019].
Title Date of First Article Articles Terms
Source: Belfast Telegraph Online 2015-12-16 5705 3101798
Source: The Irish Times 2015-12-30 2405 1419467
Source: Irish Independent 2015-12-28 1969 1064830
Source: The Irish News 2015-12-31 1246 570460
Source: Irish Examiner 2015-12-19 797 376483
Source: RTE News 2015-11-18 725 254550
Source: BreakingNews.ie 2015-11-27 720 319087
Source: Belfast Telegraph 2015-11-26 683 313533
Source: Irish Daily Mail 2015-11-26 560 332616
Source: Business World (Digest) 2015-12-09 520 225503
Source: Sunday Independent 2015-11-08 504 389105
Source: Sunday Business Post 2015-12-27 290 252923
Source: Irish News 2017-09-28 187 85890
Source: Sligo Champion 2017-01-24 58 21186
Source: Kerryman (Ireland) 2017-01-25 43 14430
Chapter Three: Methodology for Analysis
35
Note: This table is not representative of the final corpus, but rather is an illustration of the typical article breakdowns within RockSteady
during our research period. The heading ‘terms’ refers to the number of words present in the corpus for each publication. Terms for the purpose of our work refer to absolute number of lexical tokens, in which duplicate tokens or words are counted. We do not count white space or punctuation as a token. This corpus contains approximately 16,621 articles from these listed sources. Once processed the final number is closer to 15,000 once further constrains on similarity, word count and time span are included. In this particular snapshot all articles pre-November, 2015 have already been removed.
3.4 — Creating, cleaning and pre-processing a dataset for analysis
In this section we outline our data collection processes for financial data and additional measures of Irish consumer/market sentiment collected for our analyses. Said datum are transformed and merged with our own NSI extracted from the Brexit news corpus. We present pre-processing methods, as well as computing packages used in processing and analysis.
3.5.1 — Data collection
3.5.1.1 — Financial data
In order to test our research hypotheses, it is necessary to create a dataset containing both the time series of negative sentiment we extracted from our Brexit news corpus, and certain
Source: Sunday Life 2017-01-22 34 15057
Source: Wexford People (Ireland) 2015-11-17 33 14714
Source: Corkman (Ireland) 2017-01-26 30 12861
Source: Drogheda Independent (Ireland) 2017-01-25 24 8749
Source: Eolas Magazine 2015-09-18 18 18673
Source: The Argus (Ireland) 2017-08-26 13 6474
Source: The Pharma Letter 2018-06-11 6 2408
Source: New Ross Standard (Ireland) 2017-08-26 3 899
Source: The Herald (Ireland) 2018-02-23 3 1691
Source: Gorey Guardian (Ireland) 2018-02-24 2 666
Source: Bray People (Ireland) 2017-10-07 1 355
Source: Enniscorthy Guardian (Ireland) 2018-06-16 1 491
36
economic measures of interest. Firstly, we require a suitable measure of Irish Stock Market performance to form the basis of our dataset.
For the purposes of our investigation we selected the ISEQ 20 Index21 — an index of the top-20 companies, by trading volume and market capitalisation, listed on the Euronext Dublin exchange. From the exchange, we gathered a time series of daily closing prices for the ISEQ 20 spanning from January, 2015 to July, 2018.
3.5.2.2 — Market sentiment indicators
We also sought to evaluate existing measures of consumer/market sentiment, as it relates to economic activity. To this end, we collected two separate indices of consumer confidence — one collected from the Organisation for Economic Co-operation and Development
(OECD),22 the other from Eurostat, a supranational EU body for statistical information funded by the European Commission.23
While Eurostat relies on data produced by the Irish government solely in creation of the Consumer Confidence Index (CCI), the OECD favours several types of business survey data in construction of their harmonized CCI: “the harmonized industrial confidence indicator, business confidence indicators (national definition), business situation or business sentiment indicators”, respectively (Brunet & Nilsson, 2005; OECD, 2006). In addition to this, each of the organisations applies its own methods to normalising, standardising and smoothing their datum. The result is that even those based on similar core measures appear distinct.
The consumer confidence index for Ireland is calculated by Eurostat from the consumer sentiment index jointly produced by the Economic and Social Research Institute (ESRI) and KBC Bank (ESRI, 2018). Said indicator is constructed from a monthly consumer survey distributed in Ireland, and is based on qualitative research which is quantified by the ESRI.
21 http://www.ise.ie/Market-Data-Announcements/Indices/ISEQ-20-Constituents/ [Accessed: 01/07/2019].
Chapter Three: Methodology for Analysis
37
We also opted to include the composite leading indicator (CLI) created by the OECD as an additional measure of market sentiment (OECD, 2009). The CLI uses a monthly index of industrial production as a proxy measure for economic activity, which contrasts with CCI, a more qualitative market indicator. The CLI focuses on the business cycle, specifically identifying potential turning points for economies. The series is de-trended for comparisons across OECD countries, and is considered a leading indicator.
Each of these measures, those qualitative-based CCI measures, and the more quantitative market performance proxy of the CLI are produced at a monthly frequency. In our analyses we explore the relationships that exist, if any, between market performance of the ISEQ 20, our constructed NSI, the CCIs and CLI outlined here. Each of the indicators was available for the period from January, 2015 to April, 2018.
3.5.2 — Pre-processing of data
All of the analyses, including pre-processing, are carried out using R, a statistical
programming language. We utilise the packages “zoo”, “tseries” and “dplyr” mainly for data manipulation. Converting time series data into Zoo objects allows convenient indexing and lagging, and is specifically geared towards manipulation of financial data. We also make use of “tidyr”, “tibble”, “ggpubr”, “cowplot” and “Hmisc” to visualise, explore and process the data.
To begin with we elected to transform the ISEQ 20 financial data, i.e. to take the log
difference of our closing prices. By taking the log difference (percentage change) of closing price, we convert to returns and can assume the series is now stationary (Taylor, 2007). Next we must align the financial series with that of our negative sentiment indicator extracted from the Brexit corpus.
38
standardise our negative sentiment series to enable comparisons with returns. We obtain a continuous time series spanning from the 19th of January, 2016 to the 6th of July, 2018 — with 600+ observations in the series.
We also construct an additional dataset to be transformed to monthly frequency to
incorporate existing market sentiment indicators into our models. Using the date index, we aggregate both returns and the negative sentiment indicator to monthly average values to allow comparisons. We combine this with existing market sentiment indicators and produce a continuous monthly series for all indicators and returns from January, 2016 to April, 2018 — approximately 29 observations.
3.5.3 — Statistical methods
[image:38.595.99.434.473.669.2]We opted to use ordinary least squares (OLS) methods for estimating our linear models. Through pre-processing, testing and correcting for errors, we handled violations of the Gauss-Markov theorem to ensure OLS produced the best linear unbiased estimator (BLUE) (Wooldridge, 2016). We computed the linear models using built in packages in R.
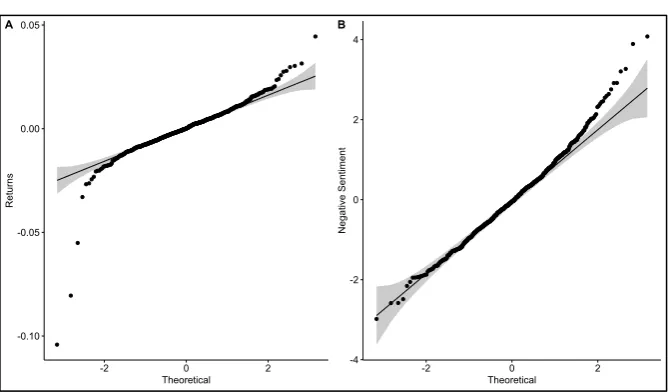
Figure 2: Quartile-quartile plots
Note: The above shows quartile-quartile plots for Returns (A) and Negative Sentiment (B), the indicator extracted from the Brexit news corpus. Theoretical, on the x-axis, represents a Gaussian distribution zero mean. While the y-axis shows the range of values for each
variable.
-0.10
-0.05 0.00
0.05
-2 0 2
Theoretical
R
et
urn
s
A
-4
-2 0 2 4
-2 0 2
Theoretical
N
eg
at
ive
Se
nt
ime
nt
Chapter Three: Methodology for Analysis
39
We previously standardised and transformed our financial and sentiment datum, to visualise the results of this we create quartile-quartile plots for each variable. The plots seem to indicate that the variables are normally distributed with some variation at the tails.
Next we compute several lags (n=5) of both our sentiment indicator and returns, this will enable exploratory analysis and the specification of linear models during later analyses. We test these now autoregressive models (AR5) using the augmented Dickey-Fuller test (Said & Dickey, 1984; Wooldridge, 2016). Each variable returns a result of stationarity significant to the 1% level, which corroborates the previous quartile-quartile plots.
We introduce vector autoregressive models using the “vars” package in R, which allows us to examine the intertemporal and dynamic relationships which may exist between our variables (Wooldridge, 2016). This is particularly useful when we examine monthly data, as we can see what relationships, if any, the existing measures of consumer/market sentiment display with the NSI and financial returns. In chapter 4, once the models have been
specified, we begin to test for the presence of heteroscedasticity, multicollinearity and autocorrelation using a variety of packages such as “tseries”, “lmtest” and “het.test”.
3.6 — Résumé
At the onset of this chapter we presented our research question. Following this, we outlined the methods employed for extracting a time series of negative sentiment data to act as our sentiment proxy — the NSI. The creation of the NSI included the construction of domain dictionaries, a Brexit news corpus and the collection of financial data for the Irish market.
40
Chapter Four
— Analyses, Observations & Findings
4.1 — Overview of chapter
In this chapter we present the results of our research, beginning with an exploratory analysis into any relationships which may, potentially, exist between our negative sentiment indicator (NSI), and returns generated by the ISEQ 20 Index — our chosen measure for performance of the Irish Stock Market. Following this, we present a number of linear models further exploring this relationship with daily time series data. We introduce vector autoregressive (VAR) models to capture the dynamic, intertemporal relationships which may exist between our two variables.
We then aggregate the NSI to monthly frequency, along with returns, in order to