Comparison of the defective pyrochlore and ilmenite polymorphs of AgSbO
3using
GGA and hybrid DFT
Jeremy P. Allen,*M. Kristin Nilsson, David O. Scanlon, and Graeme W. Watson†
School of Chemistry and CRANN, Trinity College Dublin, Dublin 2, Ireland (Received 20 October 2010; published 24 January 2011)
Silver antimonate, AgSbO3, in both its defective pyrochlore and ilmenite structural polymorphs, has been
suggested as a possible candidate mixed metal oxide for use in the photocatalytic splitting of water in visible light. In this study, we report electronic-structure calculations, using both standard and hybrid density-functional-theory approaches, on both structural forms of AgSbO3to fully characterize the band structure and composition of the
valence and conduction bands. Analysis of conduction properties and optical absorption is also used to compare the predicted properties of the two materials. Results show that the valence band is dominated by O 2pand Ag 4dstates, whereas the conduction band is composed mainly of Ag and Sb 5sstates. Band-edge effective-mass calculations indicate the materials operate via ann-type mechanism, with conduction properties being comparable for the two materials. The fundamental and optical band gaps are also predicted to be compatible with visible light adsorption.
DOI:10.1103/PhysRevB.83.035207 PACS number(s): 31.15.−p, 71.20.Mq, 71.15.Mb
I. INTRODUCTION
Over the past decade, photocatalysis has received a great deal of attention.1–3This has mainly been in an effort to achieve an efficient use of solar radiation to help combat issues relating to both energy production, such as the formation of H2 from
the splitting of water, and environmental concerns, such as the degradation of organic pollutants.1,4,5
The search for new or improved photocatalysts is never straightforward, as certain requirements in the electronic structure are needed. For example, a number of condi-tions are required for an efficient water-splitting material. Not only is the size of the band gap of importance, but also the positions of the band edges. The conduction-band minimum (CBM) must have a potential more neg-ative than that of the H+/H2 redox potential [0 V
ver-sus normal hydrogen electrode (NHE)]. In addition, the valence-band maximum (VBM) must have a more positive potential than the redox potential of O2/H2O (+1.23) eV.
This also provides the requirement that the very minimum theoretical band gap for a water-splitting material is 1.23 eV. To generate an effective photocatalyst that is driven by visible light, a band gap of less than 3.0 eV is also required.1
The first reported semiconductor for use in solar hydrogen production was anatase TiO2,6 and, as such, it has spawned
a vast amount of research.1,7–9 TiO
2 is also highly stable
and cost-effective, however, as anatase TiO2 has a band gap
of 3.2 eV,4 it cannot operate efficiently under visible light illumination.
One approach to improve the efficiency of TiO2 has been
through doping with nonmetallic elements, such as N and C, or metallic elements, for example Cr and V, but this approach only yields limited improvement.10–14Although doping offers one way to enhance the properties, investigations of alternative systems can also be instructive. One such alternative is mixed metal oxides, which have been shown to possess promising photocatalytic properties.1,15–18
Most mixed metal oxide photocatalysts typically contain at least two different metal cations, one of low valence (I-II) and
a second of higher valence (III-VI). The higher valence metal cation possesses eitherd0, such as Ti(IV), Nb(V), or W(VI),
or d10 electronic configurations, such as Ga(III), Sn(IV), or
Sb(V). This gives rise to conduction bands (CB) that are composed mainly of d or s/p states, respectively. As s/p
electrons are less localized thandelectrons, they are believed to give rise to a more dispersive conduction band with higher electron mobility and higher photocatalytic activity.19,20 The low valence cation, often an alkali or alkaline earth metal element, has little influence on the top of the valence band (VB), giving rise to an O 2pdominated VB. However, many of the mixed metal oxides with these compositions, such as Ca2Nb2O7, NaTaO3, and NaSbO3, have a band gap greater
than 3 eV, making them only responsive to ultraviolet (UV) rather than visible light. To make them usable as a visible light photocatalyst, some kind of modification or band engineering is required.1By choosing a low valence cation that has orbitals that will mix with the O 2pstates, such as Ag(I) 4dor Pb(II) 6sstates, the energy of the valence band can be raised and the band gap decreased. An example of such a material is the photocatalyst AgSbO3.21,22
AgSbO3 has two main polymorphs, with defective
pyrochlore23 and ilmenite24 structures. The ilmenite is metastable, only forming through low-temperature ion exchange from the isostructural NaSbO3, and will undergo
a phase transition to the defective pyrochlore under heat treatment.24,25The reported optical band gaps are 2.6 (Ref.22) and 2.4–2.5 eV (Refs.21and25) for the defective pyrochlore and ilmenite structures, respectively.
The evolution of O2, via the photocatalytic splitting of
water, in the defective pyrochlore structure has been studied
by Kako et al.22 The results of this study showed it to
have a greater performance than WO3, which is known to
be a good photocatalyst for O2 evolution in the presence of
Ag(I) but inactive for H2evolution.26 Although the defective
pyrochlore was untested for H2 evolution, this suggests that
suggesting that AgSbO3 in a defective pyrochlore structure
has a strong enough oxidizing potential to decompose organic compounds.
Singh and Uma21 also looked at the potential for AgSbO
3
to decompose organic molecules, studying both the ilmenite and defective pyrochlore polymorphs. Their results suggested that the ilmenite is superior to the defective pyrochlore for the degradation of the organic dyes and 2-chlorophenol under visible light. The defective pyrochlore structure showed either reduced activity, or, for the 2-chlorophenol, a lack of significant activity at all. However, they did suggest that this lower activity could be related to varying stoichiometries in the samples, as the work of Kakoet al.22 showed that deviations away from ideal stoichiometries had a significant effect on the reactivity, with Ag1.00SbO3>Ag1.02SbO3>Ag0.99SbO3.
The reduction in reactivity with stoichiometry for the defective pyrochlore AgSbO3suggests that any defects present
in the material will cause a reduction in the photocatalytic properties. For the Ag-deficient Ag0.99SbO3, Ag vacancies
are suggested to act as centers of recombination between the photogenerated holes and electrons,22,27 in a similar manner to that observed for AgTaO3.28 For hyperstoichiometries,
Ag1.02SbO3, the silver excess is manifested as metallic silver,
which Kako et al. reasoned would have a shielding effect
on the surface of the material, reducing both the number of active sites for O2 evolution and the amount of visible light
it could adsorb.22 Wang et al.29 have also studied the effect of varying the Ag/Sb ratio on the photocatalytic properties. Conversely, they reported that an increase in the amount of Ag to Sb caused a reduction in the optical band gap and an increase in the photocatalytic activity, which they attributed to the formation of Sb(III) in the sample.
Kako and Ye25suggested that the photocatalytic properties of AgSbO3can be improved by preparing samples with mixed
phases of the defective pyrochlore and ilmenite. Their results showed a greater activity than both a TiO2photocatalyst and
the single-phase ilmenite material for the decomposition of acetylaldehyde to CO2. They claim that the cause of this
increased photocatalytic activity is a synergistic effect between the two phases, which occurs as the band edges of the ilmenite polymorph lay within those of the defective pyrochlore.
Although the primary focus on AgSbO3 has been for its
utilization in photocatalysis, the defective pyrochlore has also been investigated for use as an Ag(I) ion conductor,30ann-type thermoelectric material,31,32 and as a transparent conducting oxide (TCO).23,33
Density-functional-theory (DFT) calculations have been previously employed by Kakoet al.22and Mizoguchiet al.23 to consider the electronic structure of the defective pyrochlore form of AgSbO3. Both studies showed that the composition
of the VB and CB are as expected, with the top of the VB consisting of a mixture of Ag 4d and O 2p states and the
bottom of the CB dominated by Ag and Sb 5s states. The
composition of the VB has also been confirmed through UV photoemission spectroscopy (UPS).34 As expected for these computational approaches, the calculated band gaps for the defective pyrochlore structures are significantly underesti-mated, with reported values of 0.1 (Ref.23) and 0.4 eV.22
The aim of this study is to provide a characterization of the electronic structures of both the defective pyrochlore and
ilmenite forms using hybrid-DFT, which is expected to not only give a better structural representation but also to signifi-cantly improve the calculated band gap.35–38Calculations have also been carried out using the standard generalized-gradient approximation (GGA), allowing for a direct comparison to be made with the hybrid-DFT method. In addition, the calculation of band structures, optical absorption and the hole effective masses at both the VBM and CBM allows a quantification of the conduction properties of these materials. This not only allows comparisons to be made between the two different structures, but also a discussion of the suitability of the two materials forn-type water splitting.
II. COMPUTATIONAL METHODS
The calculations described in this study were all performed using the periodic DFT codeVASP,39,40 which uses a plane-wave basis set to describe the valence electrons. The projector-augmented-wave (PAW)41,42method was used to describe the interactions between the cores (Ag: [Kr], Sb: [Kr], and O: [He]) and valence electrons. Two methods of treating the exchange and correlation were used in this study to allow a comparison to be made of their effectiveness. The first method used the standard GGA approach with the Perdew-Burke-Ernzerhof (PBE)43functional. The second approach was that of Heyd, Scuzeria, and Ernzerhof (HSE06),44,45 which uses a screened hybrid functional and includes a percentage of exact Fock exchange. The HSE06 methodology is identical to that described elsewhere, where the percentage of exact nonlocal Fock exchange added to the PBE functional is 25% and the long- and short-range parts of the functional are partitioned by a screening ofω=0.11 bohr−1.38,46 Although hybrid functionals are more computationally demanding, they are often found to give better approximations of band gaps in semiconductor systems and improved structural data.35,38,47–63 The bulk equilibrium lattice parameters were determined by performing structural optimizations at a series of volumes. In each of these calculations, the atomic positions, lattice vectors, and cell angles were allowed to relax while the total cell volume was held fixed. The resulting energy-volume curves were then fitted to the Murnaghan equation of state to obtain the equilibrium bulk cell volume.64 This approach avoids the problems of Pulay stress and changes in basis set that accompany volume changes in plane-wave calculations. The two polymorphs were modeled using their primitive unit cells, for which a-centered 4×4×4k-point mesh was found to be sufficient for both materials. A plane-wave cutoff of 500 eV was used for the PBE calculations but reduced to 400 eV for the HSE06 due to the high computational cost.46 For all calculations, the structures were deemed to be converged when the forces on all the atoms were less than 0.01 eV ˚A−1.
However, this approach has been shown to provide reasonable optical-absorption spectra.16,38,46,56,69
Structural figures have been generated using the VESTA package.70
III. RESULTS AND DISCUSSION A. Defective pyrochlore structure
The defective cubic pyrochlore structure, space group
Fd3m, is the most common form adopted by AgSbO3. A
typical cubic pyrochlore structure has a general formula of
A2B2O6X, whereX is typically O, F, or OH.71 The structure
is composed of a corner-sharing BO6 octahedra network,
with the largerA cations possessing eightfold coordination, approaching a hexagonal bipyramid, to six O and two
Xanions. ThisAX2sublattice forms a channel network through
the structure. The defective pyrochlore structure, exhibited by AgSbO3, differs from that of a typical cubic pyrochlore in that
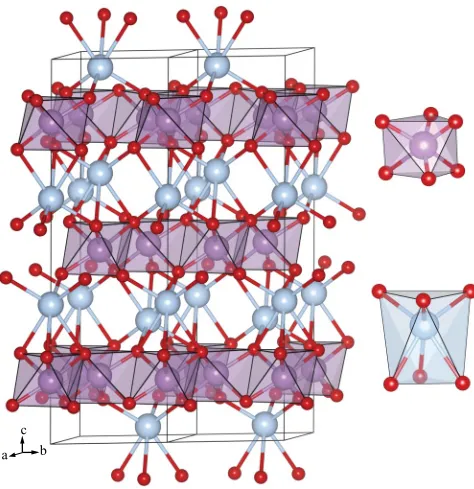
theXanions are absent. This gives rise to sixfold-coordinated Ag ions with a distorted octahedral geometry, approximating a flattened trigonal antiprism.72The structure is shown in Fig.1, with a comparison of the calculated structural parameters to the experimental structure of Mizoguchiet al.23 provided in Table I. As can be seen, there is good agreement between the calculated and experimental structures, with the HSE06 functional providing a better fit to experiment as expected.
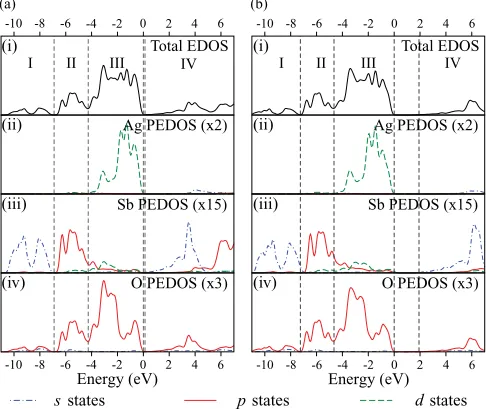
The calculated total and partial (ion decomposed) electronic densities of states (EDOS and PEDOS, respectively) for the defective pyrochlore structure are shown in Fig.2. The EDOS can be broadly separated into four regions, with the VB comprising regions I–III and region IV representing the CB. The HSE06 calculation gives rise to a widening of the band gap and a small expansion of the VB in comparison to the PBE calculation, therefore giving slightly different widths for the different regions of the EDOS. However, similarities in the peak structure and composition are seen between the different methods. The O 2pstates are seen throughout all regions in the EDOS for both methods, although the contributions from the cations are seen to differ between regions. The cation states
a b c
FIG. 1. (Color online) Schematic showing the optimized AgSbO3
defective pyrochlore structure. Silver, antimony, and oxygen atoms are colored blue (light gray), purple (medium gray), and red (dark gray), respectively. The antimony atoms are also shown as polyhedra in the main image. Coordination environments of the AgO6and SbO6
[image:3.608.312.560.128.233.2]octahedra are also shown.
TABLE I. Comparison between experimental lattice constants and bond lengths for AgSbO3in the defective pyrochlore structure
with those calculated using PBE and HSE06 methods. Percentage changes from experiment are given in parentheses, and all values are in ˚A except the cell volume, which has units of ˚A3.
Property PBE HSE06 Experiment23
a 10.43(1.6) 10.31(0.4) 10.27 Volume 1134.62(6.0) 1095.91(2.4) 1083.21 Ag-O 2.59(1.6) 2.58(1.2) 2.55 Sb-O 2.01(1.5) 1.97(−0.5) 1.98 Ag-Ag 3.69(1.7) 3.65(0.6) 3.63 Ag-Sb 3.69(1.7) 3.65(0.6) 3.63 Sb-Sb 3.69(1.7) 3.65(0.6) 3.63
in regions I and II are primarily composed of Sb 5sand 5p
states, respectively, with a small amount of Sb 4dstates seen in region II. Region III, however, is a mixture of Ag and Sb 4d
states mixing with the O 2p, with the Ag states dominating. The CB, region IV, is comprised of Ag 5s, Sb 5s and p, and O 2p.
Agreement is seen between the calculated PEDOS and
experimental photoemission spectra.34 The UPS data of
Yasukawaet al.indicate four peaks in the upper valence band. Working back from the Fermi energy, the first three peaks were designated as being composed of Ag 4dand O 2pstates, with the peak at the top of the VB having a significant contribution
from the Ag 4d states. The fourth peak was described as
consisting of mixed O 2p and cationics and p states. This description is qualitatively similar to the calculated PEDOS, with Ag 4d and O 2p states dominating the upper valence band. The calculated PEDOS also suggests that the cationics
p states d states
s states
(a) (b)
(i)
(ii)
(iii)
(iv)
(i)
(ii)
(iii)
(iv)
I II III IV
I II III IV
Total EDOS
Ag PEDOS (x2)
O PEDOS (x3)
-10 -8 -6 -4 -2 0 2 4 6
-10 -8 -6 -4 -2 0 2 4 6
Ener gy (eV)
-10 -8 -6 -4 -2 0 2 4 6
-10 -8 -6 -4 -2 0 2 4 6
Energy (eV)
Sb PEDOS (x15)
Total EDOS
Ag PEDOS (x2)
Sb PEDOS (x15)
O PEDOS (x3)
FIG. 2. (Color online) Electronic density of states for AgSbO3in
[image:3.608.314.559.464.669.2] [image:3.608.54.286.536.677.2]L X
Energy (eV)
W (a)
Energy (eV)
(c)
(b)
(d) -4
-2 0 2 4 6 8
Γ Γ-4
-2 0 2 4 6 8
L W X
Γ Γ
L W X
Γ Γ
-4 -2 0 2 4 6 8
L W X
Γ Γ
-4 -2 0 2 4 6 8
FIG. 3. (Color online) Band structure of the defective pyrochlore form of AgSbO3calculated using (a) the PBE approach and (b)–(d)
the HSE06 method. The HSE06-determined band structures are shown in fatband format with the contributions to the bands from the (b) Ag 4d(green), (c) Sb 5s(blue), and (d) O 2p(red) states indicated. The Fermi level is set to 0 eV, as indicated by the horizontal dashed gray line.
andp states described for the fourth peak originate from the Sb cations, with very little contribution seen for the Agsand
pstates in the valence band.
The calculated band structures for the defective pyrochlore, along the space group high-symmetry lines from Bradley and Cracknell,73are given in Fig.3. The VBM is located atLand extends in theLtodirection for both methods, whereas the CBM is observed at thepoint, leading to indirect band gaps of 0.08 and 2.09 eV for PBE and HSE06, respectively. The smallest direct band gaps, however, are only slightly larger at 0.09 and 2.11 eV for PBE and HSE06, respectively, and are observed at thepoint.
For the HSE06-predicted band structure, fatband analysis has been conducted to show the contribution from the Ag 4d, Sb 5s, and O 2pstates, Figs.3(b)–3(d), respectively. As seen in the PEDOS, the top of the VB is dominated by mixed Ag 4dand O 2pstates, with very little contribution from the Sb 5sstates.
The bottom of the CB is comprised of mainly Sb 5sand O
2pstates. The contributions from Ag 5sstates to the bottom of CB, not shown, are comparable to those of the O 2pstates. The extent of the Sb 5sand O 2pcontributions to the lowest bands in the CB are also seen to be phase-dependent. For example, at thepoint, the primary component is seen to be from the Sb 5sstates, however this is reversed at the W point, where O 2pstates dominate. Although not shown, fatband analysis of the PBE-predicted band structures yields similar results. This analysis is qualitatively similar to a previous GGA study by
Mizoguchiet al.,23 although they report a greater mixing of Ag 5sstates at the CBM with the Perdew-Wang functional.
B. Ilmenite structure
The ilmenite structure has a rhombohedral unit cell, space group R3H, and consists of distorted octahedral AgO6 and
SbO6units, with the former showing the greatest distortion,
ex-hibiting a trigonal antiprism polyhedron. The SbO6octahedra
form edge-sharing sheets in theabplane, as do the distorted AgO6octahedra, with the layers alternating between Ag and
Sb in thecdirection, as shown in Fig.4. The distorted AgO6
octahedra connect to the SbO6 octahedra by face-sharing on
one side in thecdirection and corner-sharing in the other, with this arrangement alternating across the layer in theabplane.
Comparisons between the calculated and experimental structures are given in Table II. As expected, the HSE06 method gives rise to the closest fit to experiment, with cell
vectors and bond lengths within 2.1 %, whereas the PBE
method predicts values within 3.0 %. However, the clattice vector is seen to be expanded relative to theaandbvectors for both methods. This is more apparent in the HSE06-minimized structure as the PBE-calculated vectors also possess the typical overestimation seen for PBE calculations. Although the source of this expansion is not apparent, it may be a result of the failure of DFT (and hybrid-DFT) to account for van der Waals forces, as previously seen in the expansion of layered materials, such as SnO (Refs.74and75) and V2O5.76,77
The calculated EDOS and PEDOS for the ilmenite structure are shown in Fig.5. As with the defective pyrochlore structure, the EDOS can be broadly characterized by four regions, with
a b
c
FIG. 4. (Color online) Schematic showing the optimized AgSbO3
ilmenite structure. Silver, antimony, and oxygen atoms are colored blue (light gray), purple (medium gray), and red (dark gray), respectively. The antimony atoms are also shown as polyhedra in the main image. Coordination environments of the AgO6 and SbO6
[image:4.608.52.294.67.348.2] [image:4.608.316.553.436.681.2]TABLE II. Comparison between experimental lattice constants and bond lengths for AgSbO3 in the ilmenite structure with those
calculated using PBE and HSE06 methods. Percentage changes from experiment are given in parentheses, and all values are in ˚A except the cell volume, which has units of ˚A3.
Property PBE HSE06 Experiment24
a 5.42(1.7) 5.35(0.4) 5.33 b 5.42(1.7) 5.35(0.4) 5.33 c 17.05(2.1) 16.99(1.7) 16.70 Volume 500.87(5.6) 486.30(2.5) 474.43 Sb-O 2.02(2.5) 1.99(1.0) 1.97 2.04(3.0) 2.01(1.5) 1.98 Ag-O 2.41(0.0) 2.41(0.0) 2.41 2.75(1.5) 2.75(1.5) 2.71 Ag-Ag 3.28(2.2) 3.24(0.9) 3.21 Ag-Sb 3.40(2.7) 3.38(2.1) 3.31 Sb-Sb 3.13(1.6) 3.09(0.3) 3.08
the VB spanning regions I–III and region IV representing the CB. As expected, both the PBE- and HSE06-predicted densities of states have a number of similarities in both the peak structures and their compositions, with the primary difference being an increased band gap with the HSE06 approach. The O 2pstates are evident throughout the VB, with the different regions being characterized by the mixing with different Ag and Sb states. The cation states are very similar to those seen for the defective pyrochlore structure, with regions I and II being composed primarily of Sb 5sand 5p, respectively. Region II also has a minor contribution from the Sb 4dstates. Region III, however, is a mixture of Ag and Sb 4d states with the O 2p.
p states d states s states
(a) (b)
(i)
(ii)
(iii)
(iv)
(i)
(ii)
(iii)
(iv)
I II III IV
I II III IV
Total EDOS
O PEDOS (x3)
Total EDOS
Ag PEDOS (x2)
Sb PEDOS (x15)
O PEDOS (x3)
-10 -8 -6 -4 -2 0 2 4 6
-10 -8 -6 -4 -2 0 2 4 6
Energy (eV)
-10 -8 -6 0 6
-10 -8 -6 -4 -2 0 2 4 6
Energy (eV)
Sb PEDOS (x15) Ag PEDOS (x2)
-4 -2 2 4
FIG. 5. (Color online) Electronic density of states for AgSbO3in
an ilmenite structure, split into (i) the total EDOS, (ii) Ag PEDOS, (iii) Sb PEDOS, and (c) O PEDOS, as calculated using the (a) PBE and (b) HSE06 method. Thes,p, anddstates are colored blue (dot-dash), red (solid), and green (dash), respectively. Vertical dashed gray lines represent divisions between different regions in the DOS. The Fermi energy has also been set to 0 eV.
F Γ Z Γ L
-4 -2 0 2 4 6 8
F Γ Z Γ L -4
-2 0 2 4 6 8
Energy (eV)
(a)
F Γ Z Γ L -4
-2 0 2 4 6 8
Energy (eV)
(c)
(b)
-4 -2 0 2 4 6 8
F Z L
(d)
FIG. 6. (Color online) Band structure of the ilmenite form of AgSbO3 calculated using (a) the PBE approach and (b)–(d) the
HSE06 method. The HSE06-determined band structures are shown in a fatband format with the contributions to the bands from the (b) Ag 4d(green), (c) Sb 5s(blue), and (d) O 2p(red) states indicated. The Fermi level is set to 0 eV, as indicated by the horizontal dashed gray line.
The CB, region IV, is comprised of mixed Sb 5sandp with O 2pstates.
Overall, the EDOS for the two different AgSbO3structures
share a number of similarities, with the basic composition of both the VB and CB being qualitatively the same.
The band structures of the ilmenite form of AgSbO3, using
both PBE and HSE06 methods, are given in Fig.6. Although both methods give rise to a similar band structure, the major difference is in the opening up of the band gap with the HSE06 method. The positions of both the VBM and CBM are the same for both methods, located at the point, with direct band gaps of 0.13 and 1.92 eV for the PBE and HSE06 methods, respectively.
The HSE06-predicted band structure is shown in a fatband format, displaying the contributions from the Ag 4d, Sb 5s, and O 2pstates in Figs.6(b)–6(d), respectively. As expected from the PEDOS, the top of the VB is dominated by mixed Ag 4d and O 2p states, with little contribution from the Sb 5s states. The bottom of the CB, however, is comprised of mainly Sb 5sand O 2pstates. The contribution of the Ag 5s
[image:5.608.49.296.127.277.2] [image:5.608.52.295.465.670.2]Optical Absor
ption
α
2 (arb
. units)
Photon Energy (eV)
1.0 1.0
1.2 1.2
1.4 1.4
1.6 1.6
1.8 1.8
2.0 2.0
2.2 2.2
2.4 2.4
2.6 2.6
2.8 2.8
3.0 3.0
3.2 3.2
3.4 3.4
3.6 3.6
3.8 3.8
4.0 4.0
Defective pyrochlore (calculated) Ilmenite (calculated)
Defective pyrochlore (experimental) Ilmenite (experimental)
Extrapolation
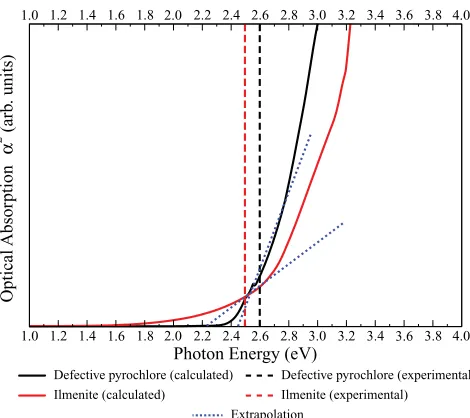
FIG. 7. (Color online) Calculated optical absorption (α2) of the
two forms of AgSbO3summed over all possible direct VB to CB
tran-sitions. Solid lines represent calculated absorption using the HSE06 method with the extrapolation used to determine the calculated optical band gap shown by the dotted lines. The experimental optical band gaps are given by the dashed lines.21,22
shown, fatband analysis of the PBE-predicted band structures yields similar results.
C. Optical absorption
As the experimental optical band gaps of 2.6 and 2.5 eV for the defective pyrochlore21 and ilmenite22 structures, respec-tively, are determined by optical absorption, it is instructive to compare these directly to the calculated optical absorption, rather than the fundamental band gaps. The Tauc relation states that Eg ∝ α2, therefore, by extrapolating α2, we can
determine the value of the optical band gap. Figure7 shows the plots of optical absorption (in terms of α2) for both AgSbO3structures calculated using HSE06, with comparison
to experiment.21,22 The calculated optical band gaps for the defective pyrochlore and ilmenite forms are seen to be equal to 2.44 and 2.24 eV, respectively. Both the magnitudes and the relative order are consistent with experiment. The calculated optical band gaps, however, are larger than the fundamental band gaps of 2.09 and 1.92 eV for the defective pyrochlore and ilmenite, respectively.
For both materials, adsorption between the VBM and CBM
at the point is forbidden, which is the location of the
direct fundamental band gap. The onset of adsorption for the defective pyrochlore is therefore seen along the -X
high-symmetry line, and along-Zfor the ilmenite structure. This observation is also noted for a range of oxide materials that show a symmetry-forbidden fundamental band gap, such as CuBO2,46SrCu2O2,78In2O3,79and Cu2O.80
D. Band-edge effective masses
[image:6.608.56.291.67.276.2]To allow a comparison of the electronic conductivity of the two structures, the electron and hole effective masses at the
TABLE III. Band-edge effective masses for the VBM and CBM of the defective pyrochlore and ilmenite forms of AgSbO3, calculated
with the HSE06 method. Note: For the ilmenite, the-Ldirection is the same as the [010].
Defective
pyrochlore [001] [010] [100] L- L-W -L -X
VBM 0.85 0.85 0.85 11.79 1.03
CBM 0.26 0.26 0.26 0.26 0.26
Ilmenite [001] [010] [100] -F -Z
VBM 4.30 2.51 4.30 18.17 1.55
CBM 0.27 0.27 0.27 0.28 0.29
CBM and VBM, respectively, can be determined. The effective mass (m∗) is calculated by
1
m∗(E) = 1 ¯
h2k dE
dk, (1)
where E(k) is the band-edge energy as a function of wave vectork, obtained directly from the calculation.81The bands at the top of the VB for both structures are clearly not parabolic, therefore AgSbO3is not expected to be well described under
a typical semiconductor effective-mass approximation. How-ever, as the bottom CB bands for the two structures are seen to be more parabolic in nature, the calculated electron effective masses should have a higher degree of accuracy than the hole effective masses. However, the calculated effective masses will serve as an approximate guide allowing comparisons to be drawn, as has been previously done for CuMO2 (where M=
Al, Sc, Y, Cr, and B),82 (Cu2S2)(Sr3Sc2O5),38 and In2O3,83
indicating the relative abilities of the two structures forn-or
p-type conductivity. The calculated effective masses at the VBM and CBM for the defective pyrochlore and ilmenite structures are given in TableIII. Effective masses have been calculated in the [001], [010], and [100] directions, as well as along the special directions shown in the previously mentioned band structures.
As can be seen, the results show that in terms of then-type conductivity, both structures have very similar properties. The electron effective masses of the CBM are also smaller than the hole effective masses of the VBM for both structure types, indicating that then-type ability of the materials will be greater than thep-type ability. Thep-type properties differ between the structure types though, with the VBM hole effective masses suggesting that the defective pyrochlore structure will possess betterp-type properties. However, neither material is predicted to exhibit strongp-type properties.
Effective-mass calculations have been used recently to describe In2O3, which is an industrial standardn-type TCO.83
The effective masses at the VBM and CBM were calculated as being 16me and 0.24me, respectively, and can be considered
as being indicative of poorp-type and goodn-type ability. The
CBM electron effective masses of both AgSbO3 polymorphs
are comparable to In2O3, albeit slightly larger, suggesting that
AgSbO3has strongn-type properties. Although the calculated
[image:6.608.311.560.119.232.2]significantly better than In2O3. Cu2O is the parent compound
of a range ofp-type delafossite TCO’s with general formula CuMO2, whereMis typically a group 3 or 13 metal. The
ex-perimental hole effective mass of the VB of Cu2O is 0.56me,84
whereas the calculated value for the delafossite CuBO2 is
0.45me.82 In comparison, our calculated VBM hole effective
masses suggests that the defective pyrochlore may also exhibit reasonablep-type properties.
IV. CONCLUSION
In conclusion, this study has used both PBE and HSE06 DFT approaches to model the electronic structure of the
defective pyrochlore and ilmenite forms of AgSbO3. As
expected, the HSE06 method affords a structure that has a much better fit to experiment, in terms of both the unit-cell dimensions and the bond lengths.
Despite the different structures, the orbital composition of the density of states and band structures for the two materials is similar, with orbital contributions to the bands in agreement with experiment34 and previous calculation.23,25 The top of
the VB is composed primarily of Ag 4d and O 2p states.
For the ilmenite polymorph, the O 2pstates in the uppermost bands are slightly diminished, with respect to the defective pyrochlore, which may give rise to the increased dispersion in these bands. For the bottom of the CB, the composition is seen to be mainly mixed Ag 5s, Sb 5s, and O 2pstates. However, there is a difference in the phase dependence of contributions to the lowest-energy conduction band. Both materials show a reduction in the O 2pstates at the CBM, which increases in directions away from this point. For the defective pyrochlore, the Sb 5s contribution also has an inversely proportional relationship to those of the O 2p, reaching a maximum at the CBM.
Agreement between experiment and the HSE06-calculated band gaps is also seen. For the defective pyrochlore (ilmenite) structure, the HSE06 approach predicts an indirect (direct) fun-damental band gap of 2.09 eV (1.92 eV) and an optical band gap of 2.44 eV (2.24 eV), which compares well with the ex-perimental value of 2.6 eV (Ref.22) [2.4–2.5 eV (Refs.21and 25)]. The calculated band gaps are also consistent with their use in photocatalytic splitting of water in visible light, which requires a band gap of between 1.23 and 3.00 eV. The magni-tudes of these optical band gaps, however, exclude the use of AgSbO3as a TCO, which previous studies have suggested.
The two materials are also seen to have comparable effective masses for the CB, which would give rise to similarn-type properties. As the values of the effective masses are only slightly bigger than those calculated for In2O3,83theirn-type
properties are predicted to be good, which is a consequence of the strong dispersion seen at the bottom of the CB due to Sb 5sand O 2p interactions. In contrast to these results, experiment has suggested different reactivities for the two polymorphs.21,29 However, this has been linked to differing stoichiometries rather than an inherent property of the pure materials. The defective pyrochlore is predicted to have better
p-type ability than the ilmenite, and, while neither polymorph is predicted to be a strong p-type material, the defective pyrochlore may show reasonablep-type properties.
ACKNOWLEDGMENTS
This work was supported by Science Foundation Ireland through the Principal Investigators program (PI Grants No. 06/IN.1/I92 and No. 06/IN.1/I92/EC07). Calculations were performed on the IITAC and Lonsdale supercomputers as maintained by TCHPC, and the Stokes supercomputer as maintained by ICHEC.
*[email protected] †[email protected]
1A. Kudo and Y. Miseki,Chem. Soc. Rev.38, 253 (2009).
2D. Ravelli, D. Dondi, M. Fagnoni, and A. Albini,Chem. Soc. Rev. 38, 1999 (2009).
3U. I. Gaya and A. H. Abdullah,J. Photochem. Photobiol., C9, 1
(2008).
4M. R. Hoffmann, S. T. Martin, W. Choi, and D. W. Bahnemann,
Chem. Rev.95, 69 (1995).
5A. Fujishima, X. Zhang, and D. A. Tryk,Int. J. Hydrogen Energy 32, 2664 (2007).
6A. Fujishima and K. Honda,Nature (London)238, 37 (1972). 7M. Ni, M. K. Leung, D. Y. Leung, and K. Sumathy,Renew. Sust.
Energy Rev.11, 401 (2007).
8K. Pirkanniemi and M. Sillanp,Chemosphere48, 1047 (2002). 9B. J. Morgan and G. W. Watson,Phys. Rev. B80, 233102 (2009). 10R. Asahi, T. Morikawa, T. Ohwaki, K. Aoki, and Y. Taga,Science
293, 269 (2001).
11H. Irie, Y. Watanabe, and K. Hashimoto, Chem. Lett. 32, 772
(2003).
12R. Dholam, N. Patel, M. Adami, and A. Miotello,Int. J. Hydrogen
Energy34, 5337 (2009).
13H. Yamashita, M. Harada, J. Misaka, M. Takeuchi, K. Ikeue, and
M. Anpo,J. Photochem. Photobiol. A148, 257 (2002).
14G. Liu, L. Wang, H. G. Yang, H.-M. Cheng, and G. Q. Lu,J. Mater.
Chem.20, 831 (2010).
15M. D. Hernandez-Alonso, F. Fresno, S. Suarez, and J. M. Coronado,
Energy Environ. Sci.2, 1231 (2009).
16A. Walsh, Y. Yan, M. N. Huda, M. M. Al Jassim, and S. H. Wei,
Chem. Mater.21, 547 (2009).
17A. Walsh, K. S. Ahn, S. Shet, M. N. Huda, T. G. Deutsch, H. L.
Wang, J. A. Turner, S. H. Wei, Y. F. Yan, and M. M. Al Jassim, Energy Environ. Sci.2, 774 (2009).
18A. Walsh, S.-H. Wei, Y. Yan, M. M. Al Jassim, J. A. Turner,
M. Woodhouse, and B. A. Parkinson, Phys. Rev. B 76, 165119 (2007).
19K. Ikarashi, J. Sato, H. Kobayashi, N. Saito, H. Nishiyama, and
Y. Inoue,J. Phys. Chem. B106, 9048 (2002).
20N. Arai, N. Saito, H. Nishiyama, Y. Inoue, K. Domen, and K. Sato,
Chem. Lett.35, 796 (2006).
21J. Singh and S. Uma,J. Phys. Chem. C113, 12483 (2009). 22T. Kako, N. Kikugawa, and J. Ye,Catal. Today131, 197 (2008). 23H. Mizoguchi, H. W. Eng, and P. M. Woodward,Inorg. Chem.43,
24V. B. Nalbandyan, M. Avdeev, and A. A. Pospelov,Solid State Sci. 8, 1430 (2006).
25T. Kako and J. Ye,J. Mol. Catal. A320, 79 (2010).
26W. Erbs, J. Desilvestro, E. Borgarello, and M. Gr¨atzel,J. Phys.
Chem.88, 4001 (1984).
27B. Ohtani, R. M. Bowman, D. P. Colombo, H. Kominami,
H. Noguchi, and K. Uosaki,Chem. Lett.27, 579 (1998).
28H. Kato, H. Kobayashi, and A. Kudo,J. Phys. Chem. B106, 12441
(2002).
29W. L. Wang, G. Q. Li, N. Yang, and W. F. Zhang,Mater. Chem.
Phys.123, 322 (2010).
30H. Wiggers, U. Simon, and G. Sch¨on,Solid State Ion.107, 111
(1998).
31S. Nishiyama, A. Ichikawa, and T. Hattori,J. Ceram. Soc. Jpn.5,
298 (2004).
32H.-Y. Sang and H.-F. Li,J. Alloys Compd.493, 678 (2010). 33H. Hosono, M. Yasukawa, and H. Kawazoe,J. Non-Cryst. Solids
203, 334 (1996).
34M. Yasukawa, H. Hosono, N. Ueda, and H. Kawazoe,Solid State
Commun.95, 399 (1995).
35J. P. Allen, D. O. Scanlon, and G. W. Watson,Phys. Rev. B81,
161103 (2010).
36C. Franchini, G. Kresse, and R. Podloucky,Phys. Rev. Lett.102,
256402 (2009).
37D. O. Scanlon, B. J. Morgan, G. W. Watson, and A. Walsh,Phys.
Rev. Lett.103, 096405 (2009).
38D. O. Scanlon and G. W. Watson,Chem. Mater.21, 5435 (2009). 39G. Kresse and J. Hafner,Phys. Rev. B49, 14251 (1994). 40G. Kresse and J. Furthm¨uller,Phys. Rev. B54, 11169 (1996). 41P. E. Bl¨ochl,Phys. Rev. B50, 17953 (1994).
42G. Kresse and D. Joubert,Phys. Rev. B59, 1758 (1999).
43J. P. Perdew, K. Burke, and M. Ernzerhof,Phys. Rev. Lett.77, 3865
(1996).
44S. Heyd, G. E. Scuseria, and M. Ernzerhof,J. Chem. Phys.118,
8207 (2003).
45A. V. Krukau, O. A. Vydrov, A. F. Izmaylov, and G. E. Scuseria,
J. Chem. Phys.125, 224106 (2006).
46D. O. Scanlon, A. Walsh, and G. W. Watson,Chem. Mater.21, 4568
(2009).
47A. Stroppa and G. Kresse,New J. Phys.10, 063020 (2008). 48A. Stroppa and G. Kresse,Phys. Rev. B79, 201201(R) (2009). 49A. Stroppa and S. Picozzi,Phys. Chem. Chem. Phys.12, 5405
(2010).
50A. Stroppa, K. Termentzidis, J. Paier, G. Kresse, and J. Hafner,
Phys. Rev. B76, 195440 (2007).
51G. Giovannetti, S. Kumar, A. Stroppa, J. van den Brink, and
S. Picozzi,Phys. Rev. Lett.103, 266401 (2009).
52M. Marsman, J. Paier, A. Stroppa, and G. Kresse,J. Phys. Condens.
Matter20, 064201 (2008).
53J. Heyd and G. E. Scuseria,J. Chem. Phys.121, 1187 (2004). 54J. Heyd, J. E. Peralta, G. E. Scuseria, and R. L. Martin,J. Chem.
Phys.123, 174101 (2005).
55J. L. F. Da Silva, M. V. Ganduglia-Pirovano, J. Sauer, V. Bayer, and
G. Kresse,Phys. Rev. B75, 045121 (2007).
56A. Walsh, J. L. F. Da Silva, Y. Yan, M. M. Al Jassim, and S. H. Wei,
Phys. Rev. B79, 073105 (2009).
57S. Chen, Z. G. Gong, A. Walsh, and S. H. Wei,Appl. Phys. Lett. 94, 041903 (2009).
58J. Paier, R. Asahi, A. Nagoya, and G. Kresse, Phys. Rev. B79,
115126 (2009).
59I. D. Prodan, G. E. Scuseria, and R. L. Martin,Phys. Rev. B73,
045104 (2006).
60J. E. Peralta, J. Heyd, G. E. Scuseria, and R. L. Martin,Phys. Rev.
B74, 073101 (2006).
61B. G. Janesko, T. M. Henderson, and G. E. Scuseria,Phys. Chem.
Chem. Phys.11, 443 (2009).
62D. O. Scanlon and G. W. Watson, J. Phys. Chem. Lett.1, 3195
(2010).
63D. O. Scanlon and G. W. Watson, J. Phys. Chem. Lett.1, 2582
(2010).
64F. D. Murnaghan,Proc. Nat. Acad. Sci. USA30, 244 (1944). 65M. Gajdos, K. Hummer, G. Kresse, J. Furthmuller, and F. Bechstedt,
Phys. Rev. B73, 045112 (2006).
66B. Adolph, J. Furthmuller, and F. Bechstedt, Phys. Rev. B63,
125108 (2001).
67L. E. Ramos, J. Paier, G. Kresse, and F. Bechstedt,Phys. Rev. B78,
195423 (2008).
68J. Paier, M. Marsman, and G. Kresse,Phys. Rev. B78, 121201
(2008).
69X. Nie, S. H. Wei, and S. B. Zhang,Phys. Rev. Lett.88, 066405
(2002).
70K. Momma and F. Izumi,J. Appl. Crystallogr.41, 653 (2008). 71H. Mizoguchi, P. M. Woodward, S.-H. Byeon, and J. B. Parise,
J. Am. Chem. Soc.126, 3175 (2004).
72A. W. Sleight,Mater. Res. Bull.4, 377 (1969).
73C. J. Bradley and A. P. Cracknell,Mathematical Theory of Symmetry
in Solids(Oxford University Press, Oxford, 1972).
74G. W. Watson and S. C. Parker,J. Phys. Chem. B103, 1258 (1999). 75G. W. Watson,J. Chem. Phys.114, 758 (2001).
76D. O. Scanlon, A. Walsh, B. J. Morgan, and G. W. Watson,J. Phys.
Chem. C112, 9903 (2008).
77D. O. Scanlon, G. W. Watson, D. J. Payne, G. R. Atkinson, R. G.
Egdell, and D. S. L. Law,J. Phys. Chem. C114, 4636 (2010).
78K. G. Godinho, J. J. Carey, B. J. Morgan, D. O. Scanlon, and G. W.
Watson,J. Mater. Chem.20, 1086 (2010).
79A. Walsh, J. L. F. Da Silva, S. H. Wei, C. Korber, A. Klein,
L. F. J. Piper, A. DeMasi, K. E. Smith, G. Panaccione, P. Torelli, D. J. Payne, A. Bourlange, and R. G. Egdell,Phys. Rev. Lett.100, 167402 (2008).
80J. P. Dahl and A. C. Switendick, J. Phys. Chem. Solids27, 931
(1966).
81D. Segev and S. H. Wei,Phys. Rev. B71, 125129 (2005). 82D. O. Scanlon, K. G. Godinho, B. J. Morgan, and G. W. Watson,
J. Chem. Phys.132, 024707 (2010).
83A. Walsh, J. L. F. Da Silva, and S. H. Wei,Phys. Rev. B78, 075211
(2008).
84J. W. Hodby, T. E. Jenkins, C. Schwab, H. Tamura, and D. Trivich,