TOWARDS THE DEVELOPMENT OF A BIOSENSOR
Thesis by Jae-Woo Choi
In Partial Fulfillment of the Requirements for the Degree of
Doctor of Philosophy
California Institute of Technology Pasadena, California
2011
Acknowledgements
First, I would like to thank my advisor, Demetri Psaltis. I am indebted to him for accepting me into the group when I had very little experience in experimental optics. I learned a lot about research as well as life and he knew when to inspire confidence and crack jokes along with the occasional motivational speeches. I benefited greatly from his vision and creativity and I was very lucky to be in such an exciting intellectual environment.
Pu, Zhenyu Li, Fai Mok, Ted Dikaliotis, Christos Santis, Shai Barak, Helge Eggert, Felix Kuhnert, Andreas Vasdekis, Kostas Makris, Ioannis Papadopoulous, Hang Xu, Alexandre Goy, Julien Cuennet, and Jianhang Yang. And our administrative assistant, Carole Berthet, who acts like a mother and worries about us, helping us get medicine when we are sick with a cold.
I would also like to thank my collaborators: Herb Shea and his group, especially Samuel Rosset, Muhamed Niklaus and Luc Maffli, provided valuable technology for the microfluidic devices; and Karsten Buse and his group, especially Daniel Schutze and Bastian Knabe, for providing valuable insight into lithium niobate.
I don’t think I can acknowledge all the people whose friendship was valuable during my studies: Caltech ultimate frisbee, the Ballistic Photons, the Caltech Korean graduate students association and the various athletic events especially the weekly Wednesday evening tennis group. In Lausanne, the Flyhigh ultimate club who served as a means of practicing my French every week.
Finally, I’d like to acknowledge my parents. My mother has always been there and loves me unconditionally. My father, a big idol in my life, I am forever grateful for his constant support and gentle nudging towards things that pique my interest.
Abstract
Microfluidics is a multidisciplinary field that uses minute volumes of liquids to attempt complex functionalities. These complicated functionalities often require manipulating interfaces through external forces. In addition, optics have become a fundamental necessity for most microfluidic devices. We combine these two concepts and call it surface optofluidics. Here, we focus on the advantages of surface optofluidics for the development of a biosensor, specifically focusing on the flexibility and adaptability offered by these techniques.
Table of Contents
Acknowledgements... iii
Abstract... v
Table of Contents... vi
Table of Figures ... ix
I. Introduction... 1
A. Biosensing ... 1
B. Optofluidics... 3
C. Surface optofluidics... 4
D. Thesis organization ... 5
E. References ... 7
II. Electrowetting ... 8
A. Introduction ... 8
1. Electrowetting ... 9
2. Droplet electrowetting ... 14
B. Electrowetting devices ... 15
1. Introduction... 15
2. Electrowetting display device ... 17
3. Grating electrowetting ... 22
4. Electrically adjustable iris... 26
5. Mechano-optofluidic device ... 28
C. References ... 32
III. Bacteria detection... 34
A. Introduction ... 34
B. Motivation ... 34
1. Conventional methods of detection ... 35
2. Bacteria identification using optical instruments... 36
3. Light scattering of bacteria ... 38
C. Optical scattering of bacteria... 41
2. Aligned bacteria ... 46
3. Optical scattering data of aligned bacteria... 50
D. Electrode patterning ... 55
1. Introduction... 55
2. Chip design ... 58
3. Simulation... 65
4. Electro-orientation within a fluidic channel ... 71
5. Dielectrophoresis within a fluidic channel ... 73
E. References ... 77
IV. Plasmonic optofluidics... 81
A. Introduction ... 81
1. Plasmonic nanoparticles as thermal sources ... 82
2. Optically controlled fluidic valves... 83
B. Biological compatibility of plasmonic optofluidic valves ... 85
1. Optofluidic pump background ... 85
2. Chip synthesis ... 89
3. Bacteria concentration ... 91
4. Two bubbles in a single fluidic channel ... 95
5. Fluidic switch... 99
C. Bidirectional flow using plasmonic optofluidic valves... 103
1. Chip design ... 103
2. Chemical concentration gradient ... 106
3. Latex bead particle motion control ... 109
4. Bacteria motion control... 112
D. References ... 115
V. Nanowire light sources ... 117
A. Introduction ... 117
1. Second harmonic radiating imaging probes (SHRIMP) ... 118
2. Dielectrophoresis and electro-orientation... 119
1. Introduction... 120
2. Measuring SHG signal... 121
3. Electro-orientation of nanowires... 123
C. Long term bacteria behavior targeting ... 128
1. Introduction... 128
2. Bacteria motility... 129
3. Labeled bacteria ... 131
4. Discussion... 131
D. References ... 133
VI. Conclusion/Outlook ... 135
Appendix... 137
A. Making superhydrophobic surfaces ... 137
B. Photolithography ... 139
C. Polydimethylsiloxane chip manufacture ... 140
D. Silver nanoparticle synthesis... 141
E. Gold nanoparticle in micelle synthesis... 142
Table of Figures
Figure 1. A prototypical lab-on-a-chip device... 2
Figure 2. Three different forms of modified surfaces for optofluidics ... 6
Figure 3. Schematic of electrowetting ... 11
Figure 4. Images of electrowetting from the side and the top ... 12
Figure 5. Images showing droplets on substrates with different hydrophobocity being tilted ... 13
Figure 6. Schematic of electrowetting display... 19
Figure 7. Image of a single droplet electrowetting display device ... 20
Figure 8. Image of a multiple-droplet electrowetting display device ... 21
Figure 9. Schematic of the electrically adjustable iris ... 23
Figure 10. Image of the electrically adjustable iris... 24
Figure 11. Electrowetting with patterned electrodes ... 25
Figure 12. Miniaturized electrically adjustable iris ... 27
Figure 13. Electrowetting with a flexible substrate ... 30
Figure 14. Image of electrowetting with a flexible substrate... 31
Figure 15. E. coli bacteria under 500x magnification... 40
Figure 16. Schematic of the electrode pattern ... 43
Figure 17. Diagram of the optical setup of bacteria scattering ... 44
Figure 18. Schematic diagram of the specimen holder... 45
Figure 19. Live E. coli bacteria under 500x magnification ... 47
Figure 20. Specimen holder which aligns bacteria in and out of the plane ... 48
Figure 21. Optical scattering measurements at an angle of approximately 33 degrees.... 52
Figure 23. Optical scattering with respect to bacteria concentration and angle of detector
... 54
Figure 24. Bacteria in a microfluidic channel aligning to an electric field... 57
Figure 25. Implantation of metal ions... 61
Figure 26. Schematic of the implantation of electrodes on the device ... 62
Figure 27. Picture of the device ... 63
Figure 28. Schematic of setup... 64
Figure 29. Simulation of electric field within a fluidic channel ... 67
Figure 30. COMSOL simulation of electric field as the electric field is applied across the fluidic channel... 68
Figure 31. COMSOL simulation of electric field within a fluidic channel as the electric field is applied from the electrodes on the fluidic channel to the ITO-coated glass slide 69 Figure 32. COMSOL simulation of the normalized negative dielectrophoresis forces experienced by a particle when the electric field is applied across the fluidic channel.... 70
Figure 33. Demonstration of bacteria orientation ... 72
Figure 34. Demonstration of bacteria concentration... 75
Figure 35. Data showing bacteria concentration with respect to applied electric field strength... 76
Figure 36. Technology used in the optofluidic pump ... 84
Figure 37. Schematic of optofluidic pump ... 86
Figure 38. Image showing the creation of the vapor bubble... 87
Figure 39. Increasing complexities taking advantages of the unique properties of the optofluidic pump... 88
Figure 40. Bacteria concentration using the optofluidic pump... 93
Figure 41. Arrival of bacteria with respect to time... 94
Figure 42. General configuration with two vapor bubbles in a single fluidic channel... 97
Figure 44. Images of fluidic switching ... 101
Figure 45. Power in each vapor bubble versus flow rate... 102
Figure 46. Picture and diagram of the device with schematic of optical setup ... 105
Figure 47. Demonstration of bidirectional fluidic flow ... 108
Figure 48. Demonstration of latex bead particle motion control ... 110
Figure 49. Curve showing particle motion control by changing laser power... 111
Figure 50. Demonstration of bacteria motion control... 113
Figure 51. Demonstration of bacteria motion control... 114
Figure 52. Polarization response of SHG from a single potassium niobate nanowire with corresponding SEM image... 122
Figure 53. Schematic of the setup for the electrical and optical manipulation... 126
Figure 54. DEP response of a nanowire... 127
Figure 55. E. coli reproduction with nanoprobe ... 130
I. Introduction
A. Biosensing
Figure 1. A prototypical lab-on-a-chip device. The image shown above is a diagram of the inner workings of a typical pregnancy test [2]. Fluid is placed onto the left-hand side of the device. The fluid moves into the detection window in the middle of the device. A specific chemical is detected in the urine at the detection window which results in an optical change in the detection window from white to colored (a single line to a crossed line).
Not Pregnant
B. Optofluidics
The motivation for the development of optofluidics comes from the integration of fluidics into traditional optical devices. Optimal performance of these devices within a changing fluidic environment requires the ability to adapt. The reconfiguration within the fluidics of the devices occurs due to external forces and results in an optical and/or fluidic modification within the device.
C. Surface optofluidics
Surfaces in optofluidic devices have a significant impact on their biological, chemical, mechanical and electrical properties [9]. Within this thesis, we will narrow our topics to three specific types of surfaces. First, we discuss surface coatings that can change the wetting properties for specific liquids [10]. Second, microstructuring of electrodes is a method to define the external control of the device. Lastly, monolayers are a simple method of coating substrates or fluidic channels with plasmonic nanoparticles [8] or biological/chemical compounds [11].
First, droplet electrowetting serves as an example of surface optofluidics. Teflon, a fluorinated substrate, can be used to make the surface hydrophobic. For polar liquids like water, an electrode can be used to change the wetting properties and decrease the contact angle. Devices with adaptable optical properties using electric fields are shown.
Next, microstructuring is a technique that is readily compatible to mass production. Structured electrodes can be used for various purposes. Applying electric fields allows the user to align and attract/repel samples of interest by taking advantage of the difference in the dielectric permittivity between the sample and the media. Bacteria manipulation such as detection, alignment, and concentration are critical to the development of a biosensor.
pressure differences. Fluidic manipulation such as distillation, switching, bidirectional flow, and chemical gradient generation are used within the context of bacteria manipulation.
D. Thesis organization
Figure 2. Three different forms of modified surfaces for optofluidics. On top, there is nanostructuring using self-assembled gold nanoparticles on a glass substrate. In the middle, there is microstructuring of electrodes on glass slides using photolithography. And on the bottom, there is changing of surface wetting properties using different materials.
Glass
Gold nanoparticles
ITO Glass
Cover glass
ITO Glass
E. References
1. Andersson H, van den Berg A. Microfluidic devices for cellomics: a review. Sensors and Actuators B: Chemical 92, 315–325 (2003).
2. Clearblue Easy +/- Results Pregnancy Test with color change tip, http://www.clearblue.com.
3. Psaltis D, Quake SR, Yang CH. Developing optofluidic technology through the fusion of microfluidics and optics. Nature 442, 381–386 (2006).
4. Song W, Vasdekis AE, Li ZY, Psaltis D. Low order distributed feedback optofluidic dye laser with reduced threshold. Applied Physics Letters 94, 051117 (2009).
5. Heng X, Erickson D, Baugh LR, Yaqoob Z, Sternberg PW, Psaltis D, Yang CH. Optofluidic microscopy — a method for implementing a high resolution optical microscope on a chip. Lab on a Chip 6, 1274–1276 (2006).
6. Lim C, Hong J, Chung BG, deMello AJ, Choo J. Optofluidic platforms based on surface-enhanced Raman scattering. The Analyst 135, 837–844 (2010).
7. Liu GL, Kim J, Lu Y, Lee LP. Optofluidic control using photothermal nanoparticles. Nature Materials 5, 27–32 (2006).
8. Adleman JR, Boyd DA, Goodwin DG, Psaltis D. Heterogeneous catalysis mediated by plasmon heating. Nano Letters 9, 4417–4423 (2009).
9. Vasdekis AE, Cuennet JG, Song W, Choi JW, De Sio L, O’Neil CP, Hubbell JA, Psaltis D. Surface optofluidics. Proceedings of SPIE 7762, 776224 (2010).
10. Choi SK, Moon H, Kim CJ. Creating, transporting, cutting and merging liquid droplets by electrowetting based actuation for digital microfluidic circuits. Journal of Microelectromechanical Systems 12, 70–80 (2003).
II. Electrowetting
A. Introduction
1. Electrowetting
In 1875, Gabriel Lippmann described the behavior of metallic and polar liquids on surfaces with various charges. This effect of changing the wetting behavior of liquids on surfaces with an applied electric field is called electrowetting. This technique can be used for varying optical properties and is appropriate to the concept of surface optofluidics. The liquid itself is modified by the applied electric fields on the surface and results in varying optical properties of the device. A simple example of electrowetting is shown in Figure 3 and Figure 4.
The electrowetting effect is maximized by having a superhydrophobic surface while using an extremely polar liquid, as shown in Figure 5. [1] This is due to the fact that the applied electric field causes a change in the equilibrium solid-liquid-air contact angle. This change is maximized if the contact angle is extremely large to begin with, as an applied electric field can only decrease this contact angle. That is, the contact angle due to an applied electric field goes from a phobic state to a philic state for most surfaces. Therefore, most electrowetting devices utilize amorphous fluoropolymers such as Cytonix, CYTOP (Asahi), and Teflon AF (DuPont).
A rough explanation of the relationship between surface tension and contact angle before saturation voltage is given below [2]:
The equation relates the change in surface tension by an applied electric field. describes the surface tension between the solvent (w for water), the substrate (s for solid), and the surrounding air. Without an applied electric field, there is an initial surface tension state. This can be thought of as the phobic state where the solvent prefers to remain together and minimize its surface area with the substrate. This initial state is described in the following equation. Increasing the applied electric field results in a decrease of surface tension. Therefore, the solvent will relax and gradually increase its contact area with the substrate.
This equation relates the contact angle at the interface between the solvent, substrate, and air to the surface tensions between each component. The surface tension is dependent on the preference of the solvent and the substrate. For phobic substrates, the substrate has a certain preference to the surrounding air, which is fixed. Additionally, there is a relationship of the solvent to the air which is a modifiable value with respect to the contact angle.
2. Droplet electrowetting
B. Electrowetting devices
1. Introduction
Electrowetting on dielectric demands similar fabrication capabilities as required for liquid crystal displays (LCDs). In an LCD display, there are several million pixels filled with liquid crystal molecules. Each pixel in a display typically includes three sub-pixels, one for each color (red, green, and blue). The display is backlit by a light source. Each pixel is controlled by electrodes on both substrates. These electrodes control the liquid crystal molecule.
In droplet electrowetting, a matrix of electrodes is used. Each would control different droplets. These techniques have been used to manipulate the liquids, controlling the phobicity of the solvent on the substrate.
There are several advantages of using LCD-compatible techniques for biosensing. By 2008, worldwide sales of televisions with LCDs had surpassed the sale of CRT units, indicating that mass fabrication is not a concern. [11] In a LCD, there are two polarizers in a crossed state as well as a color filter [12]. Similar techniques could be used for biosensing in detection polarized colloids, as well as filtering laser light.
water, and the hydrophobic layer is controlled by an electric field. Application of an electric field across the layers causes water to contact the hydrophobic layer, displacing the oil, and the colored pixel is replaced by a white background.
2. Electrowetting display device
In this section, an individual pixel that allows light to be transmitted is demonstrated. A fluid droplet is placed between two substrates and serves as an electrically controlled waveguide between a light guiding substrate and a display cover. Electrodes modulate the amount of light conducted through the fluid droplets from the substrate into the cover by controlling the contact area between the droplet and the light guiding substrate through the electrowetting principle.
A schematic and images of the device are shown in Figure 6 through 8. Both layers of the substrate are made hydrophobic using Teflon. Certain areas of the hydrophobic layer are etched to create hydrophilic regions. Fluid droplets will collect and remain within the hydrophilic regions. There are patterned electrodes on only one of the substrates. There are two distinct regimes of on and off of the display device. When there is no voltage applied, the droplet remains within the hydrophilic region of the top substrate. When there is a voltage of 100 V at 1 kHz applied, the droplet spreads to the hydrophobic region. In the first case, the droplet is connected to the bottom substrate which allows light to pass through the droplet. In the second case, the droplet is disconnected from the bottom substrate which does not allow light to pass through the droplet due to total internal reflection conditions.
3. Grating electrowetting
These ideas can be further expanded to create a variable iris as shown in Figure 9 and Figure 10. In this concept, there are electrodes on each substrate. Rather than ambient air, oil is used as the other phase of the two-phase system. The conductive electrode substrate attracts the polar liquid and the hydrophobic-coated electrode substrate attracts the oil. There is a surrounding rubber spacer which attracts the oil. As an electric field is applied, the hydrophobic substrate will attract the water and the oil is displaced towards the rubber spacer. Since the oil is colored and absorbing, there is a variable iris which forms due to the clear liquid in colored, absorbing oil. With patterned electrodes on the hydrophobic substrate with clear liquids and clear oils of different refractive indices [18, 19], electrically variable devices are created as shown in Figure 11.
4. Electrically adjustable iris
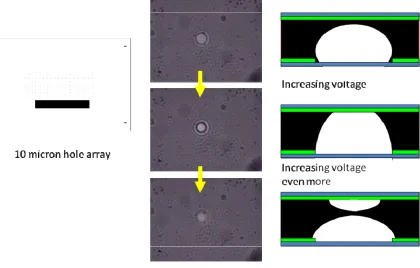
In Figure 12, the initial design is modified to have a two-phase system with oil and water. This type of system can have better control of evaporation and is compatible with backlit display technologies. In this embodiment, a voltage of 1 Vpp is applied to the electrodes which wet both substrates causing a capillary bridge to form. At voltages higher than 10 Vpp, the capillary bridge separates into two separate droplets [21, 22]. In the situation where colored, absorbing oil is used, this can be used as a display device. However, with clear oil, lenses are created from the capillary bridge leading to high-focal-length changes in an extremely compact device.
5. Mechano-optofluidic device
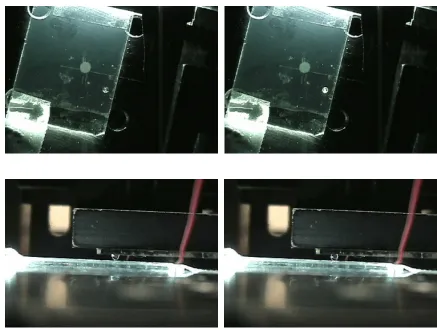
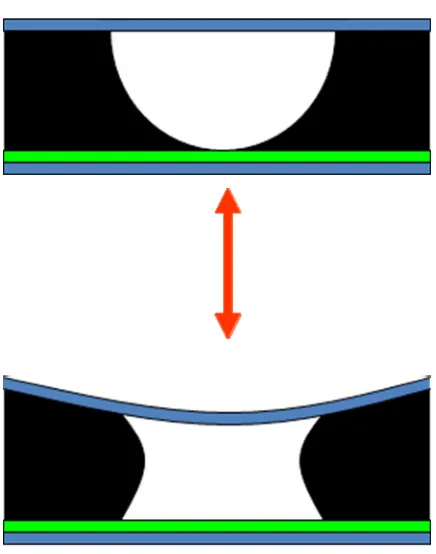
In this device, one of the substrates has a flexible plastic backing. This allows for the substrate to flex, dependent on contact with the liquid due to surface tension forces. These types of substrates are explored for bistability with regard to optical and tactile feedback.
ease for smaller devices, however, for larger devices, a larger force is required which means that a larger voltage may exceed the breakdown voltage of the dielectric between the liquid and conductive layer. [23]
As a tactile device, such a device is imagined to be capable of having a pattern of raised and lower surfaces. This device can be reset, leaving all the flexible substrates flexed down mechanically. Then, using electrical means, the substrate may be changed to have certain regions flexed up. We imagine this may be useful to provide tactile feedback for touchscreen devices or display devices where it can provide additional stimulation with regard to buttons. There is an ultimate limitation in the speed of such devices as there is a mechanical component to the liquid. We imagine that changes on the order of 1 second are possible.
A. References
1. Berge, B. Electrocapillarity and wetting of insulator films by water. CRAS 317, 157– 163 (1993).
2. Mugele F, Baret JC. Electrowetting from basics to applications. J Physics: CM 17 (2005).
3. Cho SK, Moon H, Kim CJ. Creating, transporting, cutting and merging liquid droplets by electrowetting based actuation for digital microfluidic circuits. J Microelectromechanical Systems 12, 70–80 (2003).
4. Fair RB, Khlystov A, Tailor TD, Ivanov V, Evans RD, Griffin PB, Srinivasan V, Pamula VK, Pollack MG, Zhou J. Chemical and biological applications of digital microfluidic devices. IEEE Circuits and Systems 24, 10–24 (2007).
5. Song H, Chen DL, Ismagilov RF. Reactions in droplets in microfluidic channels. Angewandte Chemie 45, 7336–7356 (2006).
6. Zhao Y, Cho SK. Microparticle sampling by electrowetting-actuated droplet sweeping. Lab on a Chip 6, 137–144 (2006).
7. Srinivasan V, Pamul VK, Fair RB. An integrated digital microfluidic lab-on-a-chip for clinical diagnostics on human physiological fluids. Lab on a Chip 4, 310–315 (2004).
8. Moon H, Wheeler AR, Garrell RL, Loo JA, Kim CJ. An integrated digital microfluidic chip for multiplexed proteomic sample preparation and analysis by MALDI-MS. Lab on a Chip 6, 1213–1219 (2006).
9. Dubois P, Marchand G, Fouillet Y, Berthier J, Douki T, Hassine F, Gmouh S, Valutier M. Ionic liquid droplet as e-microreactor. Anal Chem 78, 4909–4917 (2006). 10. Paik P, Pamul VK, Fair RB. Rapid droplet mixers for digital microfluidic systems.
Lab on a Chip 3, 253–259 (2003). 11. http://www.displaysearch.com.
12. http://en.wikipedia.org/wiki/Liquid_crystal_display.
13. Hayes RA, Feenstra BJ. Video-speed electronic paper based on electrowetting. Nature 425, 383–385 (2003).
14. You H, Steckl AJ. Three color electrowetting display devices for electronic paper. Applied Physics Letters 97, 023514 (2010).
15. Heikenfeld J, Steckl AJ. Intense switchable fluorescence in light wave coupled electrowetting devices. Applied Physics Letters 86, 011105 (2005).
17. Quilliet C,Berge B. Electrowetting: a recent outbreak. Curr. Opin. in Colloid and Interface Science 6, 34–39 (2001).
18. Staicu A, Mugele F. Electrowetting induced oil film entrapment and instability. Phys. Rev. Lett. 97, 167801 (2006).
19. Brown CV, Wells GG, Newton MI, McHale G. Voltage programmable liquid optical interface. Nat. Photonics 3, 403–405 (2009).
20. De Aguiar HB, De Beer AGF, Strader ML, Roke S. The interfacial tension of nanoscopic oil droplets in water is hardly affected by SDS surfactant. JACS Communications 132, 2122–2123 (2010).
21. Klinger A, Herminghaus S, Mugele F. Self excited oscillatory dynamics of capillary bridges in electric fields. Appl. Phys. Lett. 82, 4187 (2003).
22. Mugele F, Baret JC, Steinhauser D. Microfluidic mixing through electrowetting induced droplet oscillations. Appl. Phys. Lett. 88, 204106 (2006).
III.Bacteria detection
A. Introduction
The adaptability provided by surface optofluidic techniques is compatible with biosensing. Both topics deal with a change in the sample of interest. Normally, the sample of interest is in a fluidic environment. Optical means of identifying the sample of interest is one of the possible methods of biosensing. In the following section, we motivate and review traditional methods and some current optical means of biosensing.
B. Motivation
1. Conventional methods of detection
2. Bacteria identification using optical instruments
First, the necessity of a lab technician can be eliminated through visual recognition software by a camera counting cells on a microscope. [4] Another method adds a pre-labeling step by mixing the cells with fluorescent markers and counting the number of cells by flow cytometry. [5] However, both techniques still require preparation of the sample including colony growth of the cells, modification of the solution, and loading the sample into the microscope or device.
Many methods that have high specificity rely on pre-labeling techniques whereby an additional marker is attached to the sample of interest to increase identification abilities. In this section, some previous works involving pre-labeling which rely on optical methods for detection are discussed. The additional markers are attached to surfaces to change the refractive index. These would be detected with a waveguide [6], surface plasmon resonance [7] , or interferometers [8].
In [6], a thin film waveguide is placed below a fluidic channel with the sample of interest. The evanescent field penetrates into the fluidic channel approximately 100 nm. The surface of the waveguide is immobilized with the appropriate antibody to detect the fluorescently labeled sample of interest. As these fluorescently labeled samples attach to the surface, the intensity can be detected to determine the concentration.
attach to the interface, the refractive index is changed. By monitoring the reflected light, the device can determine the concentration of samples on the interface. This data can be determined by either scanning across different angles or by looking at the changing reflectivity.
In [8], two separate light beams interfere with each other before the detector. One of the light sources acts as a control. The other light source interacts with the sample of interest evanescently. As the refractive index is changed for one of the light sources, the phase of the light changes, which results in intensity change after the interference of the two beams.
In these surface-immobilized evanescent sensors, a high level of specificity can be obtained by utilizing the proper antigens. However, they suffer from false positives which occur when contaminants attach to the functionalized surface.
3. Light scattering of bacteria
Light scattering is one of the techniques utilized to determine the properties of a single bacterium [10], cells [11], and tissues [12]. For bacteria, Rayleigh-Debye-Gans approximation can predict the optical scattering [9]. This approximation has the following requirements: the refractive index difference between the bacteria and media must be small and the phase shift of the light must be small. For bacteria, both these conditions generally hold true [10].
In the Rayleigh-Debye-Gans approximation, the two requirements allow for the assumption that the particle does not perturb the incident field. Therefore, the scattering field is generated by the independent dipoles within the particle that are excited by the incident wave. In the next chapter, we will use similar terminology to describe scattering from gold nanoparticles much smaller than the wavelength of light. For asymmetric particles, the optical scattering for ellipsoids in media has been calculated [13]. The equation assumes two things: the solution is dilute such that the secondary scattering effects may be ignored and the solvent scattering can be accounted for separately.
different possibilities. If all the asymmetric bacteria are aligned, the scattering response is similar to that for a single bacterium.
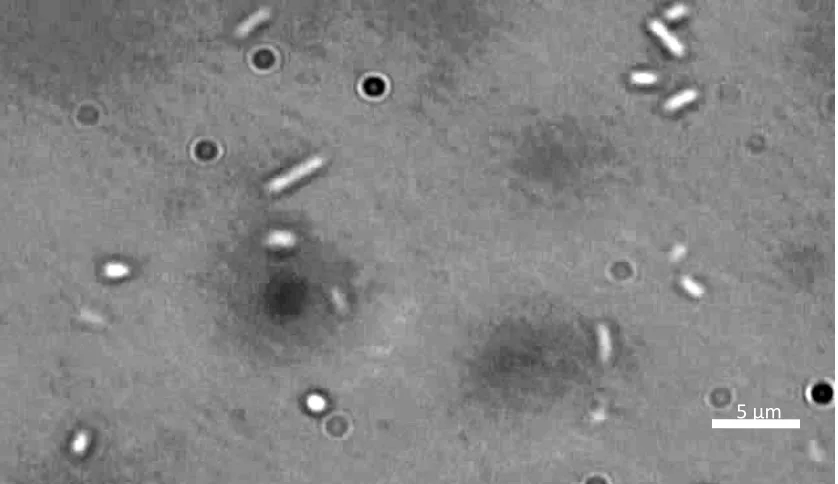
Figure 15. E. coli bacteria under 500x magnification. The bacteria are rod-shaped with diameters of approximately 1 micron and lengths ranging from 2 to 5 microns
C. Optical scattering of bacteria
1. Device and optical setup
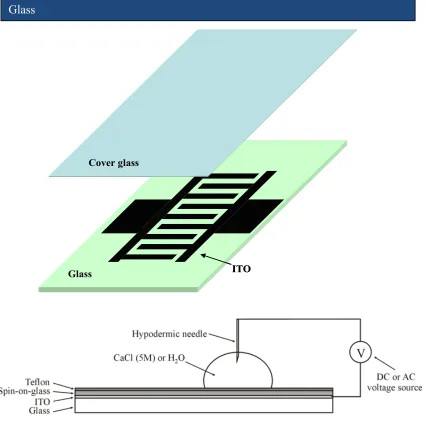
The optical setup, shown in Figure 16, consists of a 5 mW HeNe laser which illuminates a transparent specimen holder consisting of a 1-mm-thick glass plate with a conductive electrode pattern in indium tin oxide (ITO) and a thin cover glass, separated by a 20 µm spacer. The void between the glass plates holds approximately 2 µL of test specimen. The laser beam has a diameter of approximately 1.5 mm resulting in an interaction volume of approximately 150 nL. An array of photodiodes at different angles or a simple optical power detector (UDT S370) at a continuous variable angle is used to measure the optical scattering. The specimen holder is connected to a signal generator to provide an alternating voltage of ±10 V.
An alternating voltage was chosen to eliminate electrolysis in the test specimen at the electrodes. Electrolysis causes bubbles of hydrogen and oxygen gas to form at the boundary of the electrode and liquid. To avoid the creation of bubbles without decreasing the applied voltage, a frequency greater than 1 MHz was necessary. Under observation through the microscope, the asymmetric bacteria aligned to the electric field most efficiently at 10 MHz.
using a UV mask aligner and developed. Finally, the ITO is etched to create the electrode pattern.
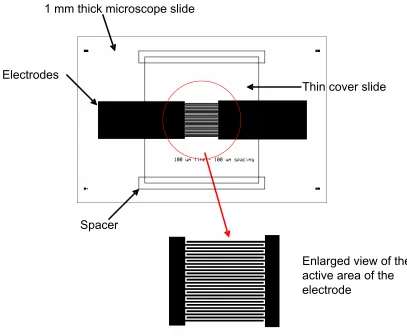
Figure 16. Schematic of the electrode pattern. The pattern is two combs facing each other. The electrodes are 100 microns wide separated by 100 microns. A vertical electric field is generated by this electrode pattern. A spacer can be used before placing a cover slide. Scotch tape measuring 50 microns in thickness were used as spacers.
1 mm thick microscope slide
Thin cover slide
Spacer
Electrodes
Enlarged view of the active area of the
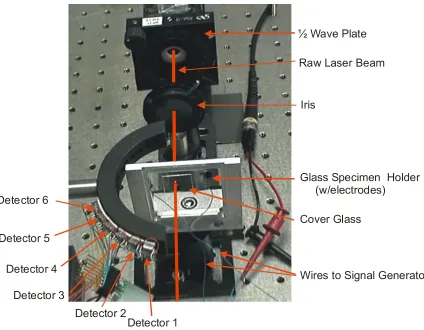
Figure 17. Diagram of the optical setup of bacteria scattering. A 633 nm laser from the top of the image is going towards the bottom of the image. The laser output is polarized and the half-wave plate is utilized to pick the proper polarization. The specimen holder is placed perpendicular to the laser beam. The detectors are placed at an angle, on the same plane as the laser beam.
Detector 1 Detector 2
Detector 3 Detector 4 Detector 5 Detector 6
Glass Specimen Holder (w/electrodes)
Cover Glass
Wires to Signal Generator ½ Wave Plate
Iris
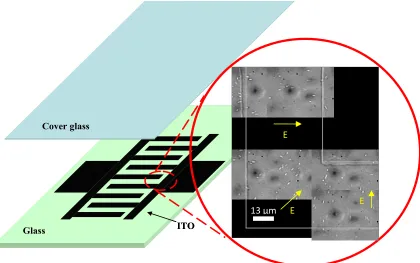
Figure 18. Schematic diagram of the specimen holder. A 1-mm-thick glass plate with a conductive electrode pattern in indium tin oxide (ITO) is separated from a thin cover glass with a spacer. The inset shows a sample of E. coli in urine aligned to the applied electric field between the electrodes.
ITO Glass
Cover glass
ITO Glass
Cover glass
E
E E
2. Aligned bacteria
To visualize the effects of the electric field on asymmetric bacteria in solution, the specimen holder is placed under a microscope. Our sample of bacteria is Escherichia coli
(E. coli K12), which are rod-shaped bacteria. When no electric field is applied, live E. coli move randomly and are aligned randomly as shown in Figure 19(a). When the electric field is applied, live E. coli align to the field as shown in Figure 19(b); we observe the shorter E. coli aligning rapidly and the longer E. coli aligning slowly. Even at the corners of the electrodes, E. coli align to the field lines, as shown in the inset of Figure 18. When the electric field is turned off, live E. coli move to orient themselves randomly. Note that dead E. coli and other symmetric particles do not move or change orientations with respect to the electric field and appear stuck to either the glass plate or cover slide.
The orientation of the bacteria need not be parallel to the image plane. The orientation of the bacteria may be in and out of the image. By stacking two glass plates with ITO as shown in Figure 20, we were able to align bacteria perpendicular to the plane of the device. Bacteria that are located just outside of the electrode boundary do not align and remain in random orientations.
Figure 19. Live E. coli bacteria under 500x magnification. (a) No electric field. The bacteria are aligned randomly. (b) Applied electric field in the horizontal direction. The bacteria are aligned to the electric field. Larger bacteria align slower than the smaller bacteria.
(b)
(a)
Figure 20. Specimen holder which aligns bacteria in and out of the plane. (a) Schematic diagram of the parallel plate specimen holder. (b) Applied electric field normal to the image plane. Note the line from the upper right to the lower left of the image. The two electrodes are stacked on top of each other and are located to the left of this boundary. Bacteria to the left of this boundary align to the electric field, normal to the image plane, and appear as points. Bacteria that are immediately to the right of this boundary orient to the fringe fields from the electrodes, from the upper left to the lower right of the image.
(b)
(a)
5 µm
ITO Glass
3. Optical scattering data of aligned bacteria
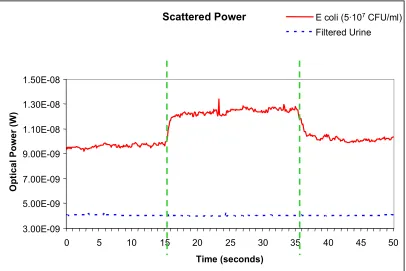
Figure 21 shows the optical scattering for samples of 5·107 colony-forming units (CFU)/mL live E. coli in urine, and no live E. coli in urine. When the electric field is turned on (between the dashed green lines), we notice that the sample of 5·107 CFU/mL live E. coli in urine has a scattered power increase of 20%. A control experiment with filtered and sterilized urine that contained dead E. coli showed no change in the amount of scattered power with an applied electric field.
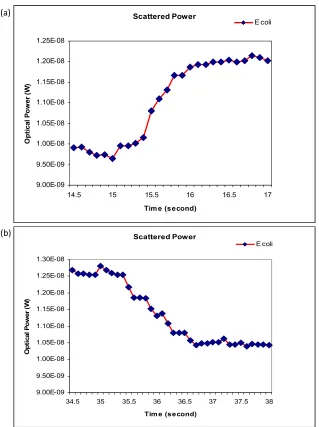
The optical scattering measurement shows different rise and fall times when the electric field is turned on and off. We noticed that bacteria of different sizes align at different speeds to the electric field. For our particular sample of 5·107 CFU/mL live E. coli, we have a rise time measurement of approximately 500 milliseconds and a fall time measurement of approximately 1.5 seconds, as shown in Figure 22. The different rise and fall times of bacteria may be due to their different sizes, dielectric constant, or polarizability. Therefore, through calibration, we may be able to distinguish the types of different bacteria in our test sample.
optical scattering measurement for detecting bacteria occurs at a concentration which is on the order of magnitude 106 CFU/mL live E. coli in urine. Additional improvements to the detection scheme would rely on pre-concentration within a microfluidic circuit [14].
Figure 21. Optical scattering measurements at an angle of approximately 33 degrees. The solid curve shows the increase in the optical scattering when the electric field is turned on (between the vertically dashed lines) for 5·107 CFU/mL live E. coli in urine. The dashed curve shows the same measurement for filtered and sterilized urine with dead E. coli.
Scattered Power 3.00E-09 5.00E-09 7.00E-09 9.00E-09 1.10E-08 1.30E-08 1.50E-08
0 5 10 15 20 25 30 35 40 45 50
Time (seconds) Op ti cal P o wer (W)
E coli (5·107CFU/ml)
Filtered Urine Scattered Power 3.00E-09 5.00E-09 7.00E-09 9.00E-09 1.10E-08 1.30E-08 1.50E-08
0 5 10 15 20 25 30 35 40 45 50
Time (seconds) Op ti cal P o wer (W)
E coli (5·107CFU/ml)
Filtered Urine Scattered Power 3.00E-09 5.00E-09 7.00E-09 9.00E-09 1.10E-08 1.30E-08 1.50E-08
0 5 10 15 20 25 30 35 40 45 50
Time (seconds) Op ti cal P o wer (W)
E coli (5·107CFU/ml)
Figure 22. Rise and fall time of the optical scattering measurement at an angle of approximately 33 degrees. (a) Rise time of the bacteria alignment to the electric field is approximately 500 milliseconds. (b) Fall time of the bacteria alignment to the electric field is approximately 1.5 seconds.
(a) (b) Scattered Power 9.00E-09 9.50E-09 1.00E-08 1.05E-08 1.10E-08 1.15E-08 1.20E-08 1.25E-08
14.5 15 15.5 16 16.5 17
Tim e (second)
Op ti ca l P o we r (W ) E coli Scattered Power 9.00E-09 9.50E-09 1.00E-08 1.05E-08 1.10E-08 1.15E-08 1.20E-08 1.25E-08 1.30E-08
34.5 35 35.5 36 36.5 37 37.5 38
Tim e (second)
Figure 23. Optical scattering with respect to bacteria concentration and angle of detector. (a) The measurement with 5·107 CFU/mL live E. coli. On average, there is approximately a 20% signal increase with the electric field on versus off. At the detector angle of 20 degrees, the signal increase is approximately 44%. (b) The measurement with 5·106 CFU/mL live E. coli. On average, there is approximately a 5% signal increase with the electric field on versus off. At the detector angle of 15 degrees, the signal increase is approximately 8%.
(a)
(b)
Scattering vs Angle (E coli @ 5·107 CFU/ml)
0 50 100 150 200
10 15 20 25 30
Angle (degree) Op ti cal P o wer ( n W ) E-Off E-On
Scattering vs Angle (E coli @ 5·106 CFU/ml)
0 50 100 150 200
10 15 20 25 30
D. Electrode patterning
1. Introduction
A critical component of many lab-on-a-chip applications is controlling particles within liquids [20, 21]. The detection scheme demonstrated in the previous section would benefit greatly from concentration and alignment of particles within liquids. For most applications, an external force is applied to accurately and reliably control particles through the microfluidic channel. Such forces have been demonstrated utilizing mechanical, electrical, thermal, and optical methods [22–29]. Electrical methods require the integration of electrodes to the microfluidic chip. If an electric field is applied between two electrodes on the same plane, a nonuniform electric field distribution is formed within the channel and the directionality and adaptability of the field is limited. Electrodes on all walls of microfluidic channels would be very beneficial in order to generate electric fields of any alignment for dielectrophoretic and electro-orientation purposes [30, 31]. This is explored in greater detail in section 3.
provides for concentration and sorting capabilities [30–31, 35] and electro-orientation allows for the alignment of asymmetric particles on a macro scale [39].
Several methods for integration of electrodes with microfluidic channels have been developed. Electrodes forming the channel were demonstrated using highly doped silicon [40]. Electrodes on the walls of an elliptical microfluidic channel were demonstrated using multi-step optical lithography involving glass wet etching and metal deposition [41]. Vertical electrodes in the sidewall of a rectangular micro- or nano-fluidic channel were demonstrated using multi-step optical lithography involving SU-8 with metal deposition and electroplating [31, 42]. Single-step optical lithographic fabrication of microfluidic channels has been demonstrated [43] and simplicity in fabrication of electrodes has been demonstrated as well [44]. In this paper, we demonstrate a novel technique for the fabrication of electrodes in all four walls of the channel without increasing the complexity of its fabrication.
2. Chip design
electrodes are sputtered on the surface in the 4 corners of the implanted area to ensure good electrical contact to the implanted layer.
We then lithographically pattern an ITO-coated glass slide (30–60 ohm/square, Sigma Aldrich) to create electrical contact with the gold-implanted region as well as provide electrodes for the open side of the microfluidic channel, as shown in Figure 26(b). Spin-on-glass (Honeywell) is coated onto specific regions of the ITO-coated glass slide to insulate the electrodes for the microfluidic channel from the gold-ion-implanted region of the PDMS. Inlet and outlet ports are punched into the PDMS with a hole-punching machine and the silicone is given the oxygen plasma treatment for 20 seconds at 50 W. Immediately afterwards, the silicone is bonded to the ITO-coated glass slide. The finished device is shown in Figure 27.
alignment of electric fields throughout the fluidic channel may require further structuring (such as arbitrary sidewall angles).
Figure 26. Schematic of the implantation of electrodes on the device. (a) The ions are implanted at an angle to create electrodes on the walls of the fluidic channel. (b) A lithographically patterned ITO-coated glass slide is bonded to the PDMS chip. Half of the electrodes on the ITO-coated glass slide connect to the PDMS electrodes.
(a)
Figure 27. Picture of the device. The finished device and close-up image. In both images, the microfluidic channel runs from left to right between the sputtered gold contacts. In the close-up image, there are implanted gold electrodes on the left and right of the image.
ITO contacts
Sputtered
gold contacts
Microfluidic channel
in the middle of the
implanted zone
3. Simulation
We can investigate the field distributions generated by three-dimensional structuring of electrodes within a fluidic channel through finite element simulations using the COMSOL software package. For a given electrode separation with only electrodes on the substrate, we note that the electric field distribution within the microfluidic channel is similar to the fringing fields of a capacitor. Depending on the height within the channel, the particle sees a significantly different magnitude of the electric field. Particles closer to the electrodes see at least a one-order-of-magnitude-higher electric field than particles closer to the top wall of the microfluidic channel (for a 50 μm channel height, this occurs when the particle’s height is at 5 μm versus 45 μm). When the electrodes are coated on the PDMS, the maximum magnitude of the electric field seen by the particle is the same and in general the field itself is more uniform throughout the height of the fluidic channel.
implantation. Figure 29(a) shows 3 different slices in the height of the simulation of the electric field when only the electrodes on the substrate are utilized in height. Figure 29(b) shows the simulation of the electric field with all the electrodes utilized. The magnitude of the electric field remains uniform to within 5% throughout the entire height of the fluidic channel.
Figure 29. Simulation of electric field within a fluidic channel. PDMS surrounds the microfluidic channel except on the right-hand side of the image where the ITO-coated glass slide is located. (a) With planar electrodes on ITO-coated glass slide substrate only. Images to the right show E. coli aligned at different z planes. The ITO/glass is at z=0 μm and the top of the fluidic channel is at z=70 μm. At z=10 μm all the bacteria are aligned. At z=60 μm, the electric field does not orient all the bacteria. Some of the bacteria are on the substrate and do not move. They can be seen moving out of focus. (b) With electrodes on the microfluidic channel as well as the ITO-coated glass slide substrate. At both z=10
μm and z=60 μm, all flowing bacteria are aligned.
(b)
Top of fluidic channel z y x glass (a) z y x
z = 60 μm z = 10 μm E
E glass
Top of fluidic channel (b) ITO/glass (+) ITO/glass (‐) Implante
d gold (float)
Implante d gold (float) ITO/glass (+) ITO/glass (‐) Implante
d gold (+)
Implante d gold (‐)
z = 60 μm z = 35 μm z = 10 μm
E
E
Figure 30. COMSOL simulation of electric field as the electric field is applied across the fluidic channel. The ITO-coated glass is the substrate on the bottom.
PDMS
electrode (‐)
PDMS
electrode (+)
ITO/substrate (float)
Figure 31. COMSOL simulation of electric field within a fluidic channel as the electric field is applied from the electrodes on the fluidic channel to the ITO-coated glass slide. PDMS is on the top, the left, and the right of the channel. The ITO-coated glass is the substrate on the bottom.
PDMS
electrode (+)
PDMS
electrode (+)
ITO/substrate (‐)
Figure 32. COMSOL simulation of the normalized negative dielectrophoresis forces experienced by a particle when the electric field is applied across the fluidic channel. PDMS is on the top, the left, and the right of the channel. ITO-coated glass is the substrate on the bottom.
PDMS
electrode (‐)
PDMS
electrode (+)
ITO/substrate (float)
4. Electro-orientation within a fluidic channel
Bacterial orientation within a microfluidic channel is possible through the electro-orientation force. This force is exerted on an asymmetric particle within a medium due to the application of an electric field. By applying an AC frequency where the particle has a dielectric permittivity higher than the medium, the particle will align along the field [33]. We can align the bacteria to any of the axial directions by simply applying the electric fields along the proper electrodes. This type of measurement is useful, for example, when an asymmetric sample of interest is located at a known position and the precise height, width and length of the particle need to be determined. Also, it is possible to flow the particle over a sensing structure in a particular orientation if one is interested in a particular viewing angle of the sample of interest, for example, the flagellum. This technique may be especially useful when probing particular entities within a biological cell, in particular, to orient microtubules [49].
Figure 33. Demonstration of bacteria orientation. The white arrows indicate the direction of the applied electric field. The SYTO 9 fluorescence-labeled bacterium is also aligned in this direction. White circles mark live bacterium which are currently in fluidic channel. (a) The electric field is applied in the horizontal direction. (b) The electric field is applied with both vertical and horizontal components. (c) The electric field is applied in and out of the image plane. Electrodes are not shown.
E
E
E
(a)(b) (c)
5 μm
5 μm 5 μm
5. Dielectrophoresis within a fluidic channel
Colloidal focusing within a microfluidic channel is possible through the dielectrophoretic force. This force is exerted on a particle within a medium due to the application of a non-uniform electric field. By utilizing an AC frequency where the particle has a dielectric permittivity lower than the medium, the particle will move towards where the fields are weakest [32, 41]. We utilize this force to move particles to the middle of the rectangular microfluidic channel. This is advantageous where a sample of interest flows over a sampling region which is much smaller than the size of the fluidic channel. This can be especially useful for sparse suspensions as the colloids will be concentrated in the middle of the region. A key advantage of this approach over fluidic flow focusing is the ability to flow colloidal solutions at a slower rate without losing any focusing capability. This may be especially useful for lab-on-a-chip application that combines larger microfluidic channels with smaller structures.
We change the conductivity of the solution from filtered urine (>1 mS/cm) to deionised water with CaCl2 salt (170 μS/cm) and apply a frequency of 1 MHz to obtain
Figure 34. Demonstration of bacteria concentration. The fluidic channel contains 4 electrodes in this picture with the bacterial solution entering from the right. An electric field can be applied on the right-hand-side electrodes from the top of the fluidic channel to the bottom of the fluidic channel. (a) The electric field is not applied. Bacteria come into the picture from the right without preference for focusing within the fluidic channel or focal plane. (b) The electric field is applied on the noted right-hand-side electrodes. Bacteria come into the picture from the right in the center of the fluidic channel at the same focal plane. Note that the electric field is not applied on the left-side electrodes. The bacteria immediately redisperse in both focal plane and within the fluidic channel as marked by the dashed lines.
(a) (b)
Figure 35. Data showing bacteria concentration with respect to applied electric field strength. As each bacteria enters the picture, the distance from the center of the fluidic channel is measured. Note that most bacteria are concentrated to within 10 μm of the center when the electric field is applied at 10 Vpp compared to a random distribution when no electric field is applied. Voltages lower than 4 Vpp resulted in a similar profile to no electric field.
0 20 40
0 4 8
Bact
er
ia (c
ount
s)
E. References
1. World Health Organization, 2003 Annual Report.
2. Conventional methods of E coli detection, image of an urine culture test and dipstick test, http://labmed.bwh.harvard.edu/microbiology/teaching/cases/bacteriology/ecoli/. 3. Conventional methods of E coli detection, image of a dipstick test,
http://www.brooksidepress.org/.
4. Iris Diagnostics iQ 200 Series Automated Urinalysis System.
5. Gunasekera TS, Attfield PV, Veal DA. A flow cytometry method for rapid detection and enumeration of total bacteria in milk. Applied and Environmental Microbiology 66, 1228–1232 (2000).
6. Sloper AN, Deacon JK, Flanagan MT. A planar indium phosphate monomode waveguide evanescent field immunosensor. Sensors and Actuators B: Chemical 1, 285–297 (1990).
7. Cullen DC, Brown RGW, Lowe CR. Detection of immune-complex formation via surface plasmon resonance on gold-coated diffraction gratings. Biosensors 3, 211– 225 (1987–1988).
8. Schneider BH, Edwards JG, Hartman NF. Hartman interferometer: versatile integrated optic sensor for label-free, real time quantification of nucleic acids, proteins, and pathogens. Clinical Chemistry 43, 1757–1763 (1997).
9. Wyatt PJ, Phillips, DT. Structure of single bacteria from light scattering. Journal of Theoretical Biology 37, 493–501 (1972).
10. Katz A, Alimova A, Xu M, Rudolph E, Shah MK, Savage HE, Rosen RB, McCormick SA, Alfano RR. Bacteria size determination by elastic light scattering. IEEE Journal of Quantum Electronics 9, 277–287 (2003).
11. Brunsting A, Mullaney PF. Differential light scattering from spherical mammalian cells. Biophysical Journal 14, 439–453 (1974).
12. Perelman LT, Backman V, Wallace M, Zonios G, Manoharan R, Nusrat A, Shields S, Seiler M, Lima C, Hamano T, Itzkan I, Van Dam J, Crawford JM, Feld MS. Observation of periodic fine structure in reflectance from biological tissue: a new technique for measuring nuclear size distribution. Physical Review Letters 80, 627– 630 (1998).
13. Finnigan JA, Jacobs DJ. Light scattering by ellipsoidal particles in solution. Journal of Physics D: Applied Physics 4, 72 (1971).
15. Bhunia AK, Lathrop A. Pathogen Detection, Food-borne (McGraw-Hill, New York, NY, 2003).
16. Homola J, Yee SS, Gauglitz G. Surface plasmon resonance sensors: review. Sens. Actuators B 54, 3–15 (1999).
17. Gauthier C, St-Pierre Y, Villemur R. Rapid antimicrobial susceptibility testing of urinary tract isolates and samples by flow cytometry. J. Med. Microbiol. 51, 192–200 (2002).
18. Roberts K, Parameswaran M, Moore M, Muller RS. A silicon microfabricated aperture for counting cells using the aperture impedance technique. Can. J. Elect. Comput. Eng. 24, 109–113 (1999).
19. Pezzlo M. Detection of urinary tract infections by rapid methods. Clin. Microbiol. Rev. 1, 268–280 (1988).
20.Whitesides GM. The origins and future of microfluidics. Nature 442, 368–373 (2006). 21. Psaltis D, Quake SR, Yang C. Developing optofluidic technology through the fusion
of microfluidics and optics. Nature 442, 381–386 (2006).
22. Unger MA, Chou HP, Thorsen T, Scherer A, Quake SR. Monolithic microfabricated valves and pumps by multilayer soft lithography. Science 288, 113–116 (2000). 23. Thorsen T, Maerkl SJ, Quake SR. Microfluidic large-scale integration. Science 298,
580–584 (2002).
24. Erickson D, Li D. Integrated microfluidic devices. Anal. Chim. Acta 507, 11–26 (2004).
25. Yamahata C, Chastellain M, Parashar VK, Petri A, Hofmann H, Gijs MAM. Plastic micropump with ferrofluidic actuation. J. Microelectromech. Syst. 14, 96–102 (2005). 26. Darhuber AA, Valentino JP, Troian SM, Wagner S. Thermocapillary actuation of
droplets on chemically patterned surfaces by programmable microheater arrays. J. Microelectromech. Syst. 12, 873–879 (2003).
27. Stone HA, Stroock AD, Ajdari A. Engineering flows in small devices. Annu. Rev. Fluid Mech. 36, 381–411 (2004).
28. Boyd DA, Adleman JR, Goodwin DG, Psaltis D. Chemical separation by bubble-assisted interphase mass transfer. Anal. Chem. 80, 2452–2456 (2008).
29. Krishnan M, Park J, Erickson D. Optothermorheological flow manipulation. Opt. Lett. 34, 1976–1978 (2009).
30. Park BY, Madou MJ. 3-D electrode designs for flow-through dielectrophoretic systems. Electrophoresis 26, 3745–3757 (2005).
32. Jones TB. Basic theory of dielectrophoresis and electrorotation. IEEE Engineering in Medicine and Biology Magazine 22, 33–42 (2003).
33. Miller RD, Jones TB. Electro-orientation of ellipsoidal erythrocytes. Biophys. J. 64, 1588–1595 (1993).
34. Gascoyne P, Mahidol C, Ruchirawat M, Satayavivad J, Watcharasit P, Becker FF. Microsample preparation by dielectrophoresis: isolation of malaria. Lab on a chip 2, 70–75 (2002).
35. Yang L, Banada PP, Chatni MR, Lim KS, Bhunia AK, Ladisch M, Bashir R. A multifunctional microfluidic system for dielectrophoretic concentration coupled with immunocapture of low numbers of Listeria monocytogenes. Lab on a chip 6, 896–905 (2006).
36. Choi JW, Pu A, Psaltis D. Optical detection of asymmetric bacteria utilizing electro orientation. Opt. Express 14, 9780–9785 (2006).
37.Jamshidi A, Pauzauskie PJ, Schuck PJ, Ohta AT, Chiou PY, Chou J, Yang P, Wu MC. Dynamic manipulation and separation of individual semiconducting and metallic nanowires. Nature Photonics 2, 86–89 (2008).
38. Choi W, Nam SW, Hwang H, Park S, Park JK. Programmable manipulation of motile cells in optoelectronic tweezers using a grayscale image. Appl. Phys. Lett. 93, 143901 (2008).
39. Lu ZX, Wood LF, Ohman DE, Collinson MM. Bio-inspired chemical reactors for growing aligned gold nanoparticle-like wires. Chem. Commun. 28, 4200–4202 (2009).
40. Iliescu C, Xu GL, Samper V, Tay FEH. Fabrication of a dielectrophoretic chip with 3D silicon electrodes. J. Micromech. Microeng. 15, 494–500 (2005).
41. Yu C, Vykoukal J, Vykoukal DM, Schwartz JA, Shi L, Gascoyne PRC. A three-dimensional dielectrophoretic particle focusing channel for microcytometry applications. J. Microelectromech. Syst. 14, 480–487 (2005).
42. Nichols KP, Eijkel JCT, Gardeniers HJGE. Nanochannels in SU-8 with floor and ceiling metal electrodes and integrated microchannels. Lab on a chip 8, 173–175 (2008).
43. Duffy C, McDonald JC, Schueller OJA, Whitesides GM. Rapid prototyping of microfluidic systems in polydimethylsiloxane. Anal. Chem. 70, 4974–4984 (1998). 44. Stark RW, Stalder MS, Stemmer A. Microfluidic etching driven by capillary forces
for rapid prototyping of gold structures. Microelectron. Eng. 67-68, 229–236 (2003). 45. Rosset S, Niklaus M, Dubois P, Shea H. Mechanical characterization of a dielectric
46. Rosset S, Niklaus M, Dubois P, Shea HR. Metal ion implantation for the fabrication of stretchable electrodes on elastomers. Advanced Functional Materials 19, 470–478 (2009).
47. Mark, JE., editor. Polymer data handbook, 2nd edition (Oxford University Press, New York, NY 2009).
48. CRC Handbook of Chemistry and Physics 89th edition (CRC Press, Boca Raton, FL 2008).
IV.Plasmonic optofluidics
A. Introduction
1. Plasmonic nanoparticles as thermal sources
Classically, plasmons are the oscillation of electrons with respect to fixed positive ions in a metal. In metals, there is damping of the oscillation of the electrons. This damping results in degeneration of input energy into thermal energy. To maximize the conversion efficiency of the input energy to the heat, it is ideal to match the input energy source to the plasmon resonance of the metal. At the resonance, the electrons can follow the electric field of the input laser source and the conversion efficient to heat is maximized.
2. Optically controlled fluidic valves
B. Biological compatibility of plasmonic optofluidic valves
1. Optofluidic pump background
The schematic diagram and creation of a vapor bubble with the optofluidic pump is shown in Figure 37 and Figure 38. The microfluidic chip is a standard microfluidic channel, 30 microns wide by 10 microns tall. The green laser is integrated into the microscope. The thermal energy transfer from the green laser to the liquid is enhanced by depositing a monolayer of gold nanoparticles at the floor of the fluidic channel. The plasmon resonance of the particles matches the green laser wavelength.
In a previous work [7], single fluidic valves were created where liquid was pumped using these optothermal particles. A key component in these fluidic pumps is the necessity of a vapor pressure change with respect to temperature for the primary liquid utilized. While water, ethanol, and various other organic solvents can be pumped using this technique, most chemicals and biological compounds will become concentrated or diluted at the interface [20, 21].
2. Chip synthesis
We utilize block copolymer lithography to deposit a monolayer of gold nanoparticles [22]. The gold nanoparticles are generated utilizing the following compounds: toluene (Sigma-Aldrich), gold chloride hydrate (Sigma (Sigma-Aldrich), and polystyrene-b-2-vinyl pyridine (PolymerSource). In a dark, nitrogen-filled environment, 5 mL toluene is mixed with 25 mg polystyrene-b-2-vinyl pyridine for 24 hours. About 8 mg gold chloride hydrate was added to the solution and mixed for 3 days. This solution was spin coated onto a glass slide at 2000 rpm. Afterwards, the gold nanoparticle coated glass slide is placed in an oxygen plasma etcher for 10 minutes at 50 W. A scanning electron microscope image of the nanoparticles on a silicon wafer indicates that particles are about 15 nm in size with a separation between each nanoparticle of about 45 nm. The absorption peak of the gold nanoparticles occurs at about 500 nm, which is the approximate wavelength of the laser (514 nm).
treatment for 20 seconds at 50 W. Immediately afterwards, the silicone is bonded to the glass slide. The dimensions of the finished device are approximately 3 cm by 2 cm.
3. Bacteria concentration
In this section, we look at the biocompatibility of these fluidic valves. Specifically, we demonstrate that optically controlled fluidic valves can be used to concentrate and detect bacteria. As demonstrated previously, only liquid is transported across the vapor bubble [7]. Therefore, bacteria and other compounds which do not experience a significant vapor pressure change with small thermal changes are not transported. They accumulate at the interface as shown in Figure 40. The 15 mW 514 nm laser beam is focused to a spot that is approximately 10 microns in size.
We probe these concentrated asymmetric bacteria by detecting the change in their scattering when they align to an electric field with a 5 mW 632 nm laser [23]. We notice that a single live asymmetric bacterium causes up to a 5% change in the scattered red laser signal when they are aligned to the electric field as opposed to when there is no field applied, due to a lack of alignment without a field. This allows for an improvement in the threshold of the detection capability of asymmetric bacteria, which is dependent on the amount of fluid that is pumped across the vapor bubble. As reported previously, the thermal gradient generated is less than 2 degrees Celsius [7] and the asymmetric bacteria remained alive within the fluidic channel throughout the several hours of the utilization of the optofluidic pump [24].
Figure 40. Bacteria concentration using the optofluidic pump. The input to the liquid with the bacteria is from the top left of the image. The bottom right of the image is connected to the output. (a) The vapor bubble is located in between, with the laser spot on the input side interface. (b) After several minutes, the bacteria is concentrated on one side of the vapor bubble interface. At this concentration of bacteria (~ 107 bacteria/mL), there are
about 3 bacteria after about 1 minute of concentration, during which the water moves about 100 microns (the channel is 30 microns wide by 10 microns tall).
4. Two bubbles in a single fluidic channel
Increasing complexity with vapor bubbles in a single fluidic channel naturally leads to increasing the number of vapor bubbles to manipulate droplets of liquids in a two-phase system surrounded by air. In this section, we explore the motion of the fluidic valves and droplets. In Figure 42, the general schematic with two vapor bubbles in a single fluidic channel is shown. The flow rate of each vapor bubble is controlled by the laser intensity and the distance from the laser spot to the liquid-air interface.
Since the size of the vapor bubble may not be changed, all the different possibilities of vapor bubble and droplet motion can be simplified into three specific actions. First, the first vapor bubble may be moved towards to the inlet. Second, the first vapor bubble may be moved towards the outlet, decreasing the droplet size. Third, the second vapor bubble may be moved towards the outlet, increasing the droplet size. Any other combination of vapor bubble motion with droplet size change may be achieved with the combination of the above mentioned actions. These scenarios are described in Figure 43.