DEVELOPMENT AND VALIDATION OF A NOVEL CLEANING
VALIDATION AND ASSAY METHOD FOR SIMULTANEOUS
ESTIMATION OF ROSUVASTATIN AND FENOFIBRATE BY
RP-HPLC
Nazareth Celina* and Bodke Anushka
Department of Pharmaceutical Chemistry, P.E.S’s Rajaram and Tarabai Bandekar College of
Pharmacy, Farmagudi, Goa, India- 403401.
ABSTRACT
A new, simple, precise, accurate and reproducible RP-HPLC method
for cleaning validation and assay for simultaneous estimation of
Rosuvastatin and Fenofibrate in tablet dosage form was developed and
validated. The chromatography was carried out on
AGILENT-ZORBAX RP-Cyano column (250mm×4.6mm,5µm) in a isocratic
mode utilizing Potassium dihydrogen phosphate buffer (pH 2.5 with
OPA): Methanol : Acetonitrile (45:33:22, v/v/v) as a mobile phase, at a
flow rate of 1.5ml/min. Detection was carried out at 252 nm. Retention
times of Rosuvastatin and Fenofibrate were 3.6 and 10.01 mins,
respectively. The Beer Lambert’s law was obeyed in the concentration
range 0.5-1.5µg/mL for both Rosuvastatin and Fenofibrate. The mean
% recoveries at 100% and LOQ level were 96.7% and 99.0% for
Rosuvastatin and 90.2% and 89.5% for Fenofibrate, respectively.
KEYWORDS: RP-HPLC, Rosuvastatin, Fenofibrate, Cleaning Validation.
INTRODUCTION
Rosuvastatin “fig 1” is a competitive inhibitor of HMG-CoA reductase. HMG-CoA
reductase, catalyses’ the conversion of HMG-CoA to mevalonate, an early rate-limiting step
in cholesterol biosynthesis. Rosuvastatin acts in the liver. The decreased hepatic cholesterol
concentration stimulates the up regulation of hepatic low density lipoprotein (LDL) receptors
which increases hepatic uptake of LDL and inhibits hepatic synthesis of very low density
lipoprotein (VLDL). The overall effect is a decrease in plasma LDL and VLDL levels.[1,5]
Volume 7, Issue 3, 1454-1465. Research Article ISSN 2277– 7105
Article Received on 21 Dec. 2017,
Revised on 11 Jan. 2018, Accepted on 31 Jan. 2018
DOI: 10.20959/wjpr20183-10949
*Corresponding Author
Nazareth Celina
Department of
Pharmaceutical Chemistry,
P.E.S’s Rajaram and Tarabai
Bandekar College of
Pharmacy, Farmagudi, Goa,
Fenofibrate “fig 2”, a fibrate, exerts its therapeutic effects through activation of peroxisome
proliferator activated receptor alpha (PPARα). This results in increased lipolysis and
elimination of triglyceride-rich particles from plasma by activating lipoprotein lipase and
reducing production of apoprotein C-III. This results in decrease in triglycerides producing an
alteration in the size and composition of LDL from small, dense particles, to large buoyant
particles. These larger particles have a greater affinity for cholesterol receptors and are
catabolized rapidly.[1,5]
N N
CH3
O OH
N C H3
S O O
CH3
[image:2.595.187.410.228.379.2]OH OH F
Fig. 1: Rosuvastatin.
Chemically Rosuvastatin [C22H28FN3O6S] is
(3R,5S,6E)-7-[4-(4-fluorophenyl)-2-(N-methylmethanesulfonamido)-6-(propan-2-yl)pyrimidin-5-yl]-3,5-dihydroxyhept-6-enoic acid
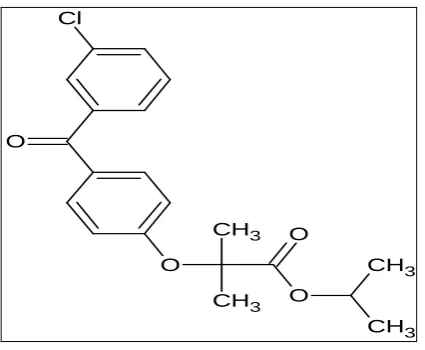
with molecular weight 481.538 and Fenofibrate [C20H21ClO4]is Isopropyl
2-[4-(4-chlorobenzoyl)phenoxy]-2-methylpropanoate. The combination of Rosuvastatin and
Fenofibrate is used to treat hyperlipidemias, mixed dyslipidemia, hypercholesteriamia and
hypertriglyceridemia.[1,5]
CH3 O
Cl
O
CH3 O
O
CH3 CH3
[image:2.595.193.406.548.723.2]Cleaning validation is done to confirm reliability of a cleaning procedure and thus refers to
generating documented evidence that an approved cleaning procedure will provide equipment
that is suitable for processing of pharmaceutical products or active pharmaceutical
ingredients (APIs). Cleaning validation is of critical importance and thus must be strictly
followed by manufacturers of pharmaceutical products and APIs.[6,7]
A review of literature indicated that many UV Spectrophotometric, RP-HPLC and LCMS
methods have been reported for the assay of Rosuvastatin and Fenofibrate either alone or in
combination.However, no cleaning validation method for the above drug combination has
been reported. Considering the importance and need of cleaning validation in pharmaceutical
manufacturing it was thought worthwhile to develop a cleaning validation method for
simultaneous determination of Rosuvastatin and Fenofibrate. The new method could further
be used for assay of tablet formulation.
MATERIALS AND METHODS
Equipment
HPLC of Agilent 1260 make with auto sampler, auto injector and UV detector of Agilent
make was used for the study. Rosuvastatin and Fenofibrate APIs were obtained as gift
samples from Vergo Pharma Research Laboratories, Verna, Goa. The tablet dosage
formulation LIPIROSE-F 10 marketed by Mankind Pharma Ltd. containing 10 mg
Rosuvastatin and 145 mg Fenofibrate was purchased from local pharmacy. All chemicals
used and solvents used were of AR/HPLC grade of Rankem/ Merck.
Chromatographic Conditions
PARAMETERS CHROMATOGRAPHIC CONDITIONS
Mobile Phase Phosphate buffer (pH 2.5): Methanol:
Acetonitrile (45:33:22, v/v/v)
Runtime 15 min
Injection Volume 20µL
Flow Rate 1.5 mL/min
COT 35°C
Column Agilent ZorbaxCYANO (250mm×4.6mm,5µm)
Wavelength 252 nm
Standard Stock Solution
i. Cleaning Validation
Standard stock solutions of Rosuvastatin and Fenofibrate (100 µg/mL) were prepared
separately in methanol. From this, mixed standard solution was prepared by taking 1 mL
from each standard stock and diluting it to 100 mL with 50% methanol with final
concentration of 1 µg/mL. The chromatographic system was subjected to system suitability.
ii. Assay
Standard stock solutions of Rosuvastatin and Fenofibrate were prepared in methanol having
concentration of 100µg/mL and 1450 µg/mL respectively. The working mixed standard
solution was prepared by diluting 5 mL from each standard stock to 50 mL with diluent II, to
get final concentration of 10µg/mL and 145 µg/mL of Rosuvastatin and Fenofibrate
respectively.
Sample Solution
The test samples were prepared by crushing 10 tablets and to this 70 ml of diluent I was
added and sonicated for about 10 mins. Volume was made up to mark with diluent I. The
solution was centrifuged for 10 mins at 5000 rpm. A volume of 5 ml of supernatant was
transferred to a 50 ml volumetric flask and diluted to mark using diluent II and mixed
thoroughly.
Placebo Solution
Placebo sample was prepared in similar way as sample solution except that placebo powder
was used in place of tablet powder.
Validation
Both the methods were validated for specificity, linearity, accuracy, precision, LOQ, LOD
and robustness as per ICH guidelines.
In case of cleaning validation method, Specificity was evaluated to determine that swabs used
showed no interference in the method. Linearity was performed from LOQ level to 150%.
Accuracy was established by performing recovery studies at 100% and LOQ level
concentration of the drugs. The precision was determined by injecting six replicates of
Rosuvastatin and Fenofibrate mixed standard solution at LOQ level. The limit of detection
Noise ratio” method. The concentration which gave a Signal to Noise ratio of about 3 for
limit of detection and about 10 for limit of quantitation was derived. The solutions were
prepared and injected and response was seen. Robustness was demonstrated by bringing
about deliberate changes in mobile phase composition, pH of Buffer in mobile phase, flow
rate and column temperature and calculating its impact on system suitability parameters.
For the assay method, specificity was performed in presence of placebo solution. Linearity
was established considering the tablet strength i.e. at 0.5 µg/mL-15µg/mL for Rosuvastatin
and 0.5 µg/ mL -215µg/mL for Fenofibrate. Accuracy was performed at three levels i.e., at
50%, 100%, 150%. Precision was established by performing repeatability studies and % RSD
was calculated.
RESULT AND DISCUSSIONS
Preliminary experiments were carried out to achieve the best chromatographic conditions for
the simultaneous determination of both the drugs. Several column types and mobile phases
along with other parameters were tried. The spectrum scans using a PDA detector showed
λmax of Rosuvastatin as 242 nm and of Fenofibrate as 287 nm. The Isosbestic point was determined and λ of 252 nm was chosen as the wavelength of analysis as seen in “fig 3”. The
optimised mobile phase composition was Phosphate buffer (pH 2.5 with OPA): Methanol:
[image:5.595.130.465.485.672.2]Acetonitrile (45:33:22, v/v/v) at a flow rate of 1.5 ml/min.
Fig. 3: Overlain spectra of Rosuvastatin and Fenofibrate.
The mixed standard solution was injected six times, and the system suitability parameters
were verified. The results are depicted in table 1. As seen, the system suitability parameters
typical chromatogram of Rosuvastatin and Fenofibrate is shown in “fig. 4”. The retention
time of Rosuvastatin and Fenofibrate was found to be 3.6 min and 10.01 min respectively
with resolution of 23.67.
Table 1: Summary of System Suitability Testing.
System Suitability parameters Observed values Acceptance
criteria
ROS FEN
% RSD (n=6) 0.655896 0.921821 NMT 2.0%
Average of Theoretical plates 7480.8 11157.33 NLT 2000
Average of Tailing factor 1.243 1.165 NMT 2.0
[image:6.595.83.509.158.409.2]Resolution 23.67 NLT 1.5
Fig. 4: A representative chromatogram of Rosuvastatin and Fenofibrate.
The Specificity of the method was established by analyzing the prepared swab solutions. The
method was found specific as swab analysis showed no interference “fig.5”. The Beer
Lambert’s range for the drugs was established by plotting calibration curves “fig. 6” and “fig.
7”. Linearity data has been summarized in table 2. As seen, the Beer Lambert’s range was
established in the concentration range of LOQ-1.5µg/ml for both Rosuvastatin and
Fenofibrate with correlation coefficient (r2) = 0.999. Accuracy was performed at LOQ and
100% level. The mean % recovery at 100% level was found to be 96.7% and 90.2% for
Rosuvastatin and Fenofibrate respectively. The mean % recovery at LOQ level was found to
be 99.0% and 89.0% for the two drugs respectively (table 3). The method was found precise
with % RSD less than 2.0%. The LOD and LOQ values were calculated based on the
Signal-to-Noise ratio. The LOD was obtained as 0.006µg/ml for Rosuvastatin and 0.015µg/ml for
Fenofibrate and the LOQ was obtained as 0.02µg/ml for Rosuvastatin and 0.05µg/ml for
Fenofibrate which showed that method is sensitive (table 4 and table 5). The method was
found robust as minor changes in chromatographic conditions, yielded insignificant changes
Fig. 5: A representative chromatogram of swab interference.
[image:7.595.142.456.445.582.2]Fig. 6: Calibration curve for Rosuvastatin.
Fig. 7: Calibration curve for Fenofibrate.
Table 2: Linearity data for Rosuvastatin and Fenofibrate.
Parameters Rosuvastatin Fenofibrate
Linearity range 0.02 µg/ml-1.63 µg/ml 0.05µg/ml-1.69 µg/ml
Slope 472739.268105 401383.061383
Intercept 7570.80000 -433.00000
Correlation Coefficient 0.999 0.999
Table 3: Accuracy at 100% level and LOQ level.
Table 4: Signal to noise ratio for Rosuvastatin and Fenofibrate.
Signal (S) Height Ratio (S/N)
Rosuvastatin 83677 610.781
Fenofibrate 27916 203.766
Noise (N) 137 --
Table 5: LOQ and LOD for Rosuvastatin and Fenofibrate.
Components
Limit of Quantitation (LOQ)
Limit of Detection (LOD) Concentration,
in µg/mL
Concentration, in µg/mL
Rosuvastatin 0.02 0.006
Fenofibrate 0.05 0.015
Table 6: Summary of results for Robustness.
Parameter Level Rosuvastatin Fenofibrate
%RSD TF %RSD TF
pH 2.5 1.1 1.3 1.2 1.2
2.7 0.8 1.3 0.9 1.3
Flowrate(ml/min) 1.3 0.6 1.4 0.8 1.4
1.7 0.3 1.2 0.6 1.2
COT (°C) 30 0.3 1.2 0.9 1.3
40 0.3 1.3 0.9 1.3
% Methanol 90% 1.3 1.3 1.3 1.3
110% 1.3 1.3 0.9 1.3
% Acetonitrile 90% 0.9 1.3 0.7 1.4
110% 0.4 1.4 0.4 1.4
The assay method developed was applied for evaluation of tablet formulation. The linearity
range for assay was found to be 0.5-15µg/ml for Rosuvastatin and 0.5-215µg/ml for
Fenofibrate with r2 = 0.999 for both the drugs as depicted in table 7. The method was found
specific as there was no interference due to excipients or mobile phase. The method was
accurate as the mean % recoveries were found within 90.0% - 110.0% at 50%, 100%, 150%
level. The % assay was found to be within the acceptance criteria of 90.0% - 110.0%.
Sample No. (Swab no)
% Recovery
100% Level LOQ Level
ROS FEN ROS FEN
1 95.7 90.0 98.6 90.0
2 96.4 92.1 98.7 89.1
3 98.1 88.4 98.7 89.3
Table 7: Linearity data for Rosuvastatin and Fenofibrate for assay method.
Parameters Rosuvastatin Fenofibrate
Linearity range 0.5µg/ml-15µg/ml 0.5µg/ml-215µg/ml
Slope 501660 388457
Intercept 40328 83842
Correlation Coefficient 0.9998 1
Linear Regression Equation 501660x+40328 388457x+83843
Table 8: Accuracy data for Rosuvastatin and Fenofibrate for assay method.
Accuracy Levels
Average % Recovery Rosuvastatin
Average % Recovery Fenofibrate
50% 99.84 99.76
100% 98.33 98.54
150% 98.89 99.63
CONCLUSION
A novel method for cleaning validation was developed. The method is simple, cost effective,
specific, accurate, precise, reproducible and robust. The target of developing a common
chromatographic method for both cleaning validation and assay of formulation has been
achieved. These methods can be used to estimate Rosuvastatin and Fenofibrate as
independent components as well as in combination in quality control procedures.
ACKNOWLEDGMENT
The authors would like to thank Vergo Pharma Research Laboratories Ltd. Verna-Goa for
providing gift samples of the drugs and facilities to carry out this research work.
CONFLICT OF INTEREST
Authors declare no conflict of interest.
ABBREVIATIONS USED
Std: Standard
ICH: International Conference on Harmonization
ROS: Rosuvastatin
FEN: Fenofibrate
REFERENCES
1. Brunton L, Chabner B, Knollman B. Goodman and Gilman’s pharmacological basis of
therapeutics. 12th ed. MC Graw Hill Companies, 2011; 849-97, 901-03.
2. Lemke TL, William DA. Foye’s principles of medicinal chemistry. 7th ed., 2013; 827-30,
832-36.
3. Sweetman SC. Martindale, The Complete Drug Reference Vol A; 38th ed. Royal
Pharmaceutical Society of Great Britain, 2014; 1381, 1488
4. Tripathi K.D. Essentials of Medical Pharmacology. 7th ed. Jaypee Brothers Publication,
2008; 614-17.
5. Rang HP, Ritter JM, Flower RJ, Henderson G. Rang and Dale’s Pharmacology, 8th ed.
Book Aid International Publishers, 2016; 289-290.
6. Satinder K, Bharat P. A review on concept of cleaning validation in pharmaceutical
industry. Int. J. Pharm., 2012; 3(7): 17-19.
7. Cleaning validation-health products regulation guide. J. Pharm. sci., 2013; 8(008): 1-11.
8. International Conference on Harmonization of Technical Requirements for Registration
of Pharmaceuticals for Human Use (ICH Harmonized Tripartite Guideline) Validation of
Analytical Procedures: Text and Methodology Q2 B. 1996.
9. Pandya CB, Channabasavaraj KP. Development and validation of RP-HPLC method for
determination of Rosuvastatin calcium in bulk and pharmaceutical dosage form. Int. J.
Pharm. Sci, 2010; 5(1): 82-86.
10.Sumalatha M, Haritha K. Analytical method development and validation for the
simultaneous estimation of Rosuvastatin and Fenofibrate in tablet dosage form by
RP-HPLC. Int. J. Pharm, 2013; 1(6): 850-56.
11.Sevda RR, Ravetkar AS, Shirote PJ. UV spectrophotometric estimation of Rosuvastatin
calcium and Fenofibrate in bulk drug and dosage form using simultaneous equation
method. Int. J. Chem. Technol, 2011; 3(2): 629-35.
12.Gupta A, Mishra P, Shah K. Simple UV spectrophotometric determination of
Rosuvastatin calcium in pure form and in pharmaceutical formulations. J. Chem, 2009;
6(1): 89-92.
13.Jadhav A, Patel B, Solanki H, Parmar S. Development and validation of derivative
spectroscopic method for the simultaneous estimation of Rosuvastatin calcium and
14.Ankireddy S, Venkateshwararao P, Sudhakar AM. Simultaneous estimation of
Rosuvastatin calcium and Fenofibrate in pharmaceutical dosage forms by using
RP-HPLC method. Int. J. Biol. Pharm Res., 2012; 3(7): 935-941.
15.Triveni J, Rambabu R, VenkateshwararaoJ, Vidhyadhara S. Development and validation
of RP-HPLC method for simultaneous estimation of Rosuvastatin calcium and
Fenofibrate in bulk and pharmaceutical dosage forms. Int. J. Res. Pharm. Chem, 2013;
3(2): 208-12.
16.Salama FM, Nassar MW. Determination of Fenofibrate and the degradation product using
simultaneous UV-derivative spectrometric method and HPLC.Am. J. Anal. Chem, 2011;
2(7): 332-43.
17.Mulgund SV, Anbazhegan S, Gabhe SY. LC–MS/MS studies for the identification and
characterization of degradation products of Fenofibrate and their degradation pathways,
Acta Chromatogr, 2015; 4(3): 97-103.
18.Bukkapatnam V, Mukthinuthalapati MA, Bandaru SP. Stability indicating liquid
chromatographic method for the simultaneous determination of Rosuvastatin and
Ezetimibe in pharmaceutical formulations. J. Adv. Pharm. Bull, 2014; 4(4): 405-11.
19.Patel BB, Shah BB, Gohil KN, Patel PM. Development and validation of
spectrophotometric method for simultaneous estimation of Rosuvastatin calcium and
aspirin in bulk and pharmaceutical dosage form. Int. J. Res. Pharm. Sci, 2012; 2(2):
115-22.
20.Choudhary N, Singh S, Rai J, Sharma S. Stability-indicating UV-Vis spectrophotometric
method for estimation of Atorvastatin calcium and Fenofibrate in tablet dosage form.
Bull. Pharm. Res, 2012; 2(3): 159-66.
21.Devika GS, .Sudhakar MJ, Rao V. A RP-HPLC developed for simultaneous estimation of
Rosuvastatin Calcium and Fenofibrate in tablet formulation. Int. J. Pharm. Pharm. Sci,
2011; 4(3): 311-14.
22.Rajeevkumar R, Anbazhagan S, Rajeevkumar P, Nimesh K. Novel simultaneous
determination of Rosuvastatin calcium and Fenofibrate in tablet formulation by derivative
spectrophotometry. Int. J. Res. Pharm. Biomed. Sci, 2012; 3(4): 1533-538.
23.Lahare RY, Phuge AN, Gite AL, Jadhav AK.A Review on UV- Spectrophotometric
Determination of Rosuvastatin Calcium in Marketed Formulation.Int. J. Appl. Biosci,
24.Trivedi HK, Patel MC. Development and validation of a stability-indicating RP-UPLC
method for determination of Rosuvastatin and related substances in pharmaceutical
dosage form. Sci. Pharma, 2012; 80(5): 393–06.
25.Badawy AM, Mostafa M. Stability indicating spectrophotometric methods for
determination of Rosuvastatin in the presence of its acid degradation products by