DEVELOPMENT AND VALIDATION OF STABILITY INDICATING
RP-LC, SHORT RUNTIME METHOD FOR THE ESTIMATION OF
ESCITALOPRAM IN ESCITALOPRAM DOSAGE FORM
Bhupendrasinh K. Vaghela*, Surendra Singh Rao
Department of chemistry, J.J.T. University, Jhunjhunu, Rajasthan, India.
ABSTRACT
Introduction and Aim: A novel stability indicating short runtime (3.5
minutes) method was developed for quantitative determination of
escitalopram in pharmaceutical dosage form. This method can able
separate all six known impurities from escitalopram main peak. There
is no reported method for the determination of Escitalopram by Ultra
performance liquid chromatography in pharmaceutical dosage forms.
This method is a relatively new technique giving new possibilities in
liquid chromatography, especially concerning decrease of time and
solvent consumption. Hence the author has made an attempt to develop
a simple, sensitive and precise method for the determination of
Escitalopram in Escitalopram oxalate tablet in pharmaceutical
formulations by reducing the retention time of the drug. Method: The method was developed
by using Waters BEH C8 (100mm x 2.1mm) 1.7µm column with mobile phase containing a
potassium dihydrogen phosphate, Acetonitrile and methanol. The flow rate was 0.4 mL/min
with column temperature of 25°C and detection wavelength at 239nm Results: In the
precision study the % RSD for the result of escitalopram was below 1.5%.The method was
linear with concentration rage of 6 µg/mL to 18 µg/mL with the correlation coefficient
greater than 0.999 and % bias at 100% level are within + 2%. The percentage recoveries were
calculated observed from 98.6% to 100.5%. Conclusion: The developed method was
validated as per ICH guidelines with respect to specificity, linearity, accuracy, precision,
ruggedness and robustness.
Keywords: Validation; Stability-indicating; Escitalopram; Assay; Degradation.
Volume 2, Issue 4, 1018-1030. Research Article ISSN 2277 – 7105
Article Received on 20 April 2013,
Revised on 07 May 2013, Accepted on 26 June 2013
*Correspondence for Author:
Bhupendrasinh K. Vaghela
Department of chemistry, J.J.T.
University, Jhunjhunu,
Rajasthan, India.
INTRODUCTION
Escitalopram is a newer antidepressant chemically described as 1-[3-(Dimethylamino)
propyl]-1-(4-fluorophenyl)-1,3-dihydro-5- isobenzofuran-carbonitrile oxalate (Fig. 1). It is
used for the treatment of panic disorder. Escitalopram oxalate is S(+) enantiomer of the
racemic bicyclic phthalene derivative of citalopram. It is an orally administered selective
serotonin reuptake inhibitor. Its empirical formula is C20H21FN20.C2H2O4, which corresponds
to a molecular weight of 414.43. Its solid oral dosage form is available as tablet. Tablets are
film-coated, round tablets containing escitalopram oxalate in strengths equivalent to 5 mg, 10
mg, and 20 mg escitalopram base.1.
In the literature survey there were few methods have been reported for determination of
Escitalopram in pharmaceutical bulk and finish dosage form by HPLC,UV and colorimetric
techniques 2-5.However, several method were reported for determination of Escitalopram in
combination with other drug with deference spectroscopic methods like UV,HPLC and
HPTLC 6-11. Method is also reported for escitalopram estimation with preservative in finished
product dosage form12. Related substance method for escitalopram process related impurities;
degradation related impurities and enantiomer estimation are also reported by using different
techniques.13-16. Preparation, characterization and dissolution studies of inclusion complexes
of Escitalopram oxalate and structural elucidation of process-related impurities in
escitalopram by LC/ESI-MS and NMR reported in few articles.17-18 Beside the reported
method, as per our current knowledge no method is reported by UPLC for shorter runtime
method in escitalopram dosage form .This paper described method is a stability indicating
method that can separate all possible degradation and process related impurity within 3.5
minute run time. The developed LC method was validated with respect to specificity,
linearity, precision, accuracy and robustness. Specificity studies were performed on the
placebo and drug products to show the stability-indicating nature of the method. These
studies were performed in accordance with established ICH guidelines 19
MATERIALS AND METHOD
Chemicals and reagents
Samples of Escitalopram and its impurities were supplied by Dr. Reddy’s laboratories
limited, Hyderabad, India. The HPLC grade acetonitrile, methanol, and analytical grade
Potassium Dihydrogen phosphate and sodium hydroxide were from Merck, Mumbai, India.
prepared by using Millipore Milli-Q Plus water purification system (Millipore, Milford, MA,
USA).
Equipment
Acquity UPLCTM (Waters, Milforde, USA) was used which consists of a binary solvent
manager, a sample manager and a photodiode array (PDA) detector. The output signals were
monitored and processed using Empower 2 software. Cintex digital water bath was used for
hydrolysis studies. Photo-stability studies were carried out in photo-stability chamber (Sanyo,
Leicestershire, UK). Thermal stability studies were performed in a dry air oven (Cintex,
Mumbai, India). The pH of the solutions was measured by a pH meter (Mettler-Toledo,
Switzerland).
Chromatographic Conditions
The method was developed by using Waters BEH C8 (100mm x 2.1mm) 1.7µm column. The
mobile phase contains a 0.01 M potassium dihydrogen phosphate (5mL triethlyamine/liter,
pH 7.0 adjusted with ortho phosphoric acid), Acetonitrile and methanol in the ratio of
60:28:12. The mobile phases were filtered through nylon 0.45 µm membrane filters and
degassed in sonicator. The flow rate was 0.4 mL/min with column temperature of 25°C and
detection wavelength at 239 nm. The injection volume was 2.00 µl.
Preparation of Diluent
0.01M potassium dihydrogen phosphate Buffer, pH adjusted to 7.0 with sodium hydroxide
solution.
Preparation of Standard Solution
A standard stock solution of Escitalopram was prepared in diluent with a concentration of
0.75 mg/mL. Working standard solution was prepared from above stock solution (stock A) by
further dilution with diluent to get final concentration of 12µg/mL of escitalopram.
Preparation of sample Solution
Mixed the content of 20 dosage forms in mortal pestle. A content equivalent to 75 mg
Escitalopram was dissolved in diluents with sonication for 30 min. This solution was
RESULTS AND DISCUSSION
Method Development and Optimization
The main objective of the chromatographic method was to separate all escitalopram
impurities from main peak Escitalopram, and to elute all compound with a shorter run time.
The blend containing 12 µg/mL Escitalopram, and about 4% of all impurities was used for
separation. An isocratic method employed using 0.01 M potassium dihydrogen phosphate
(pH6.0) and acetonitrile in the ratio of 70:30 as mobile phase, Waters BEH C8 (100mm x
2.1mm) 1.7µm column with flow rate of 0.4 mL/min on UPLC equipped with photo diode
array detector. Impurity peak was merged with Escitalopram peak. To resolve the impurity
peak from main peak pH of buffer was increased to 7.0 and found that it leads to longer
runtime with peak tailing. To reduce the run time an attempt was made and methanol was
added in the ratio of 0.01 M potassium dihydrogen orthophosphate buffer (pH 7.0),
acetonitrile and methanol, 60:28:12 .Run time has reduced but main peak tailing is very high.
Hence, 5 mL per liter tri ethylamine was added in buffer solution. On the optimization of this
mobile phase, all peaks ware well resolved, escitalopram peak tailing also satisfactory
obtained and also confirm the column lot to lot variation. Based on these experiments, the
conditions were further optimized as described below.
Waters BEH C8 (100mm x 2.1mm) 1.7µm column was used as the stationary phase. The
mobile phase contains a 0.01 M potassium dihydrogen phosphate (5mL triethlyamine/liter,
pH 7.0 adjusted with ortho phosphoric acid), Acetonitrile and methanol in the ratio of
60:28:12. The column oven temperature was maintained at 25°C and detection was
monitored at 239 nm. The flow rate was 0.4 mL/min. The injection volume was kept as 2 µL.
The developed method was determined to be specific for Escitalopram and all impurities.
METHOD VALIDATION
The proposed method was validated as per ICH guidelines19. The following validation
characteristics were addressed: specificity, accuracy, precision, linearity, range, ruggedness
and robustness.
System suitability
System suitability was checked for the conformance of suitability and reproducibility of
chromatographic system for analysis. The system suitability was evaluated on the basis of
retention time, % RSD of five replicate injection, Theoretical plate and tailing factor of
analysis from five replicate injections of the standard solution containing 12µg/mL
Escitalopram. The acceptance criteria were the % RSD for the retention times and peak area
of principal peak from 5 replicate injections of each Standard solution should be not more
than 2.0 %, the number of theoretical plates (N) for the Escitalopram peaks is NLT 3000 and
the Tailing factor (T) for the Escitalopram peaks is NMT 2.0. All critical parameters tested
are met the acceptance criteria (Table 1).
Specificity
Specificity is the ability of the method to measure the analyte response in the presence of its
potential impurities. A study was conducted to demonstrate the effective separation of
Escitalopram from its impurities. Also study was intended to ensure the effective separation
of degradation peaks of formulation ingredients at the retention time of Escitalopram and its
impurities. Separate portions of drug product and ingredients were exposed to following
stress conditions to induce degradation.
The drug product was subjected to Acid and base hydrolysis using hydrochloric acid and
Sodium hydroxide, Hydrolytic degradation performed. Oxidation study was performed with 1
% Hydrogen Peroxide solution. The photo stability study was carried out as per ICH Q1B20
where drug product was sufficiently spread on Petri plates (1 mm thick layer), exposed to
sunlight (1.2Million Lux hours) and UV light (200 watt hours / square meter). Humidity
study was performed separately by exposing the drug product to humidity at 25°C, 90% RH
for 10 days. Thermal degradation study was performed at 60°C for 12 hrs by heating drug
product. Similarly placebo samples were prepared as like as drug product by exposing
formulation matrices without drug substance. Peak purity test was carried out for the
Escitalopram peak by using PDA detector in stress samples. Placebo interference was also
evaluated by analyzing the placebo equivalent amount present in sample, prepared as per test
method and results are summarized in Table 2. No peak was detected due to placebo at the
retention time of Escitalopram and its impurities (Fig. 2).
Precision
The precision of method was verified by repeatability and intermediate precision.
Repeatability was checked by injecting six individual preparations of Escitalopram dosage
form. % RSD of Escitalopram peak area was calculated. The intermediate precision of the
method was also evaluated using different analyst and different instrument and performing
The % RSD for the result of Escitalopram in repeatability study was within 1.5% and in
intermediate precision study was within 0.2%, which confirms the good precision of the
method. The %RSD values for escitalopram are presented in Table 3.
Linearity
Linearity test solutions were prepared by diluting the stock solutions to the required
concentrations by covering the range from 50% to 150% of Escitalopram. The solutions were
prepared at five different concentration levels (50%, 75%, 100%, 125% and 150%).
Calibration curve was plotted between the responses of peak versus analyte concentrations
(Fig.3). The correlation coefficient obtained was greater than 0.999 and % bias at 100% level
are within ± 2%.The above result shows that an excellent correlation exists between peak area
and concentration of Escitalopram.
Accuracy
Accuracy of the method escitalopram were evaluated in triplicate using three level
50%,100% and 150% of target concentration. The percentage recoveries were calculated and
varied from 98.6% to 100.5%. The recovery values are presented in Table 4.
Robustness
To determine the robustness of the developed method, experimental conditions were altered
deliberately and system suitability parameters for Escitalopram standard were recorded. The
variables evaluated in the study were pH of the mobile phase buffer, flow rate and organic
composition in mobile phase. The flow rate of the mobile phase was 0.4 mL/min. To study
the effect of flow rate on system suitability parameters, flow was changed from 0.2 to 0.6
mL/min. The effect of pH of mobile phase buffer was studied at 6.8 to 7.2 instead of 7.0. The
effect of composition of mobile was studied at 90% and 110% of the method organic phase
composition. In all the deliberate varied chromatographic conditions, all analytes were
adequately resolved and complies with system suitability requirement. The system suitability
parameters evaluated are shown in Table 5.
Stability in Solution and in the Mobile Phase
The solution stability of Escitalopram was determined by keeping test solution and standard
solutions in tightly capped volumetric flasks at room temperature for 48 hrs and measured the
amount of escitalopram at every 24 hrs against freshly prepared standard solution. The
at 24 hrs interval for 48 hrs. The mobile was not changed during the study. The variability in
the estimation of Escitalopram was within ± 2% during solution stability and mobile phase
stability. The results from solution stability and mobile phase stability experiments confirms
that mobile phase was stable up to 48 hrs, and sample solution and standard solutions were
stable up to 48 hrs on bench top.
Table 1 System suitability test results
Parameters Specification Observed
values
The % RSD for the retention times of principal peak
from 5 replicate injections from standard solution < 2.0 % 0.0
The % RSD for the peak area responses of principal
peak from 5 replicate injections from standard
Solution
< 2.0 % 0.2
The number of theoretical plates (N) for the
Escitalopram peaks NLT 3000 149818
The Tailing factor (T) for the Escitalopram peak NMT 2.0 0.1
Tab. 2. Summary of forced degradation results
Stress Condition % Degradation
Purity angle
Purity threshold
Purity flag
Acid hydrolysis 0.4 0.322 0.519 No
Base hydrolysis 9.93 0.361 0.570 No
Oxidation 11.9 0.466 0.643 No
Thermal 0.3 0.331 0.544 No
Hydrolytic NIL 0.343 0.541 No
Humidity NIL 0.371 0.566 No
Photolytic
Tab. 3. Repeatability and intermediate precision test results
Sample
No.
% Escitalopram
Repeatability Intermediate precision
1 96.4 97.6
2 100.7 97.2
3 98.5 97.6
4 99.7 97.9
5 98.0 97.4
6 98.2 97.7
Mean 98.6 97.6
%RSD 1.5 0.2
Tab. 4. Recovery data
Amount spiked a % Recovery b
50% 99.0 + 0.3
100% 99.9 + 0.4
150% 99.7 + 0.4
a
Amount of escitalopram spiked w.r.t. specification level
b
Mean + %RSD for three determinations
Tab. 5. Robustness results of UPLC method
Variation in chromatographic condition
Observed system suitability parameters
%RSDa < 2.0 %RSDb < 2.0 Tailing factor peak < 2.0 theoretical plates NLT3000 Flow rate
0.2 mL/min 0.1 0.2 1.6 138108
Flow rate
0.6 mL/min 0.0 0.4 1.3 165066
Buffer pH 6.8 0.0 0.2 1.3 149221
Buffer pH 7.2 0.1 0.2 1.2 150058
composition
(Methanol)
110% organic
composition(Methanol) 0.1 0.3 1.4 150381
90% organic
composition (ACN) 0.0 0.3 1.2 147139
110% organic
composition(ACN) 0.0 0.4 1.3 148997
a
The % RSD for the retention times of principal peak from 5 replicate injections from
standard solution.
b
The % RSD for the peak area responses of principal peak from 5 replicate injections from
standard Solution
Fig-1.It shows Structure of Escitalopram
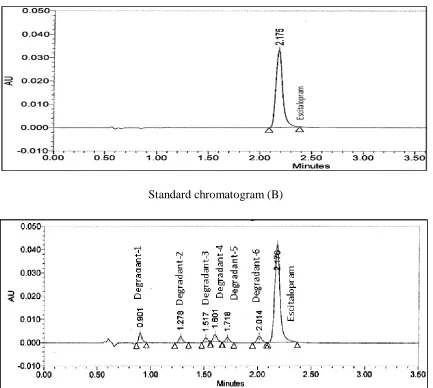
Standard chromatogram (B)
[image:10.595.82.515.68.456.2]Sample chromatogram with all impurity spiked (C)
Fig. 2. Typical chromatograms of (A) Placebo, (B) Standard chromatogram and (C)
Escitalopram test spiked with its impurities.
[image:10.595.128.468.562.722.2]CONCLUSIONS
A novel simple and efficient reverse-phase LC method was developed and validated for
quantitative analysis of Escitalopram which includes separation of potential impurities of
Escitalopram pharmaceutical dosage forms. The method found to be precise, accurate, linear,
robust and rugged during validation. Satisfactory results were obtained from the validation of
the method. The method is stability indicating and can be used for routine analysis of
production samples and to check the stability of the Escitalopram finished dosage form.
ACKNOWLEDGEMENT
The authors are thankful to the management of Dr. Reddy’s Laboratories Ltd., Hyderabad for
providing facilities to carry out this work. Cooperation from colleagues especially from Mr.
Navneet Rajput, Analytical Research & Development of Dr.Reddy’s Laboratories Ltd. is
appreciated.
REFERENCES
1. The Merck Index, an encyclopedia of chemicals, drugs and biological, Merck & Co.,Inc.,
Whitehouse Station, NJ, 2001.
2. Syam Sundar B and Suneetha A, Development and validation of liquid chromatographic
method of escitalopram oxalate in tablet dosage form, international Journal of Pharma
and Bioscience, 2011, 2(1), , 140-146.
3. Vetrichelvan T, Arul K, Sumithra M and Umadevi B, Colorimetric method for the
estimation of escitalopram oxalate in tablet dosage form, IJPS, 2010, 72(2), 269-271.
4. Samanta T, Suddasattya D, Himansu BS, Bharat Kumar D, Dibya LM and Kausik B,
RP-HPLC method for the estimation of escitalopram in bulk and in dosage forms., Int J Chem
Res, 2011, 2(2), 11-15.
5. Bharat GC and Hetal RP, Spectrophotometric Method for Determination of Escitalopram
Oxalate from Tablet Formulations, IJPQA ,2010, 2(1), 9-12.
6. Bhumika DS, Dr. Priti DT and Darshana KM., Development and Validation of
Spectrophotometric Methods for Simultaneous Estimation of Escitalopram oxalate and
Etizolam in their Combined Tablet Dosage Form, journal of pharmaceutical science and
bio scientific research(JPSBR), 2012,2(5), 195-200.
7. Chusena NB, Devala RG and Pasupuleti U, Development and validation of an RP-HPLC
bulk and its pharmaceutical formulations, International Current Pharmaceutical Journal,
2012, 1(8), 193-198.
8. Bhosale SD, and Dr. (Mrs.) Rajput SJ, RP-HPLC Method for simultaneous estimation of
Escitalopram Oxalate and Etizolam in a tablet formulation, JPBMS, 2012, 19 (5),1-4.
9. Kakde RB and Satone DD, Spectrophotometric method for simultaneous estimation of
escitalopram oxalate and clonazepam in tablet dosage form, IJPS, 2009, 71(6), 702-705.
10.Kakde RB, Satone DD, Gadapayale KK and Kakde MG, Stability-Indicating RP-HPLC
Method for the Simultaneous Determination of Escitalopram Oxalate and Clonazepam., J
Chromatogr Sci.,2013, 51(6), 490-495.
11.Nilesh D, Santosh G,Shweta S and Kailash B, Simultaneous HPTLC Determination of
Escitalopram Oxalate and Clonazepam in Combined Tablets, Chromatographia ,2008,
67(5), 487-490.
12.Krishnachaitanya K, Samson ID, Surekha ML and GowriSankar D, Determination of
Escitalopram and its preservatives in oral solution by using RP-HPLC method, Journal of
Pharmacy Research,2011,4(11), 3953-3954.
13.Dammu R, Prasad PSS and Mukkanti K, A Validated LC Method for the Determination
of related substances of 1-(4-Fluoro phenyl)-1,3-dihydro isobenzo furan-5-carbonitrile : A
key Starting material of Escitalopram. Journal of Pharmacy Research,
2012,5(12),5416-5418.
14.Dhaneshwar SR, Mahadik MV and Kulkarni MJ, Column liquid
chromatography-ultraviolet and column liquid chromatography/mass spectrometry evaluation of stress
degradation behavior of escitalopram oxalate. J AOAC Int., 2009, 92(1), 138-47.
15.Bunleu S, Pavel J and Gerhard KES, Development and validation of a capillary
electrophoresis method for the simultaneous determination of impurities of escitalopram
including the R-enantiomer, Journal of Pharmaceutical and Biomedical Analysis,2008,
46(5), 959–965.
16.Elham AT, Nahla NS and Shudong W, Micelle enhanced fluorimetric and thin layer
chromatography densitometric methods for the determination of (+/-) citalopram and its
S-enantiomer escitalopram. Analytical Chemistry Insight, 2009, 4, 1–9.
17.Nirav SP and Jayvadan KP, Preparation, characterization and dissolution studies of
inclusion complexes of Escitalopram oxalate, Journal of Pharmacy Research
18.Raman B, Sharma BA, Ghugare PD, Nandavadekar S, Singh D, Karmuse PK and Kumar
A., Structural elucidation of process-related impurities in escitalopram by LC/ESI-MS
and NMR., J Pharm Biomed Anal., 2010, 53(4),895-901.
19.ICH Q2 (R1), Validation of Analytical Procedures: Text and Methodology, 2005.
20.ICH Q1B, Stability testing: Photo stability testing of new drug substances and products,