FORMULATION AND EVALUATION OF MICROPARTICLES
FORMED BY AMPHIPHILLIC CRYSTALLIZATION TECHNIQUE:
OPTIMIZATION OF PROCESS PARAMETER
Ujwala S. Desai*, Dhaval B. Bhavsar
Department of Pharmaceutics, Progressive Education Society’s Modern College of
Pharmacy, Nigdi, Pune- 411044,Maharashtra, India.
ABSTRACT
The objective of the current work was to develop a crystallization process for the production of microparticles of aceclofenac with a controlled particle size distribution (PSD) to enhance its solubility. The strategy of increasing the in vitro dissolution has the potential to enhance the oral bioavailability when using nanosized crystalline drugs. Solvation of aceclofenac in aqueous poly(ethylene glycol) 400 (PEG 400) was investigated using UV spectroscopy and FTIR. Aceclofenac was crystallized from PEG 400 solutions by the addition of water under a variety of conditions of supersaturation and stirring speed. The crystals were filtered, dried at room temperature. A logarithmic increase in solubility of aceclofenac was observed with increasing concentration of PEG 400 in water enabling the aqueous antisolvent crystallization of aceclofenac from PEG. A central composite design, study showed the particle size to decrease with increasing supersaturation. The physicochemical properties of pure drug and microparticles were characterized by X-ray powder diffraction (XRPD), Fourier transform infrared (FTIR) spectroscopy, differential scanning calorimetric (DSC), scanning electron microscopy (SEM) as well as, measuring the particle size. The DSC and XRPD results indicated that this process did not affect the intrinsic crystalline properties of drug. Amphiphilic crystallization provided a novel method to produce microparticles of aceclofenac with a controlled size range.
KEYWORDS: Aceclofenac, microparticles, amphiphillic crystallization, particle size, solubility, dissolution rate.
Volume 3, Issue 7, 1025-1054. Research Article ISSN 2277 – 7105
Article Received on 22 July 2014,
Revised on16 August 2014, Accepted on 10 Sept 2014
*Correspondence for Author
Miss Ujwala S. Desai
Department of Pharmaceutics,
Progressive Education
Society’s Modern College of
Pharmacy, Nigdi, Pune-
1. INTRODUCTION
Particles in the size range 1–10 µm are traditionally produced by the crystallization of macrocrystals of the drug substance followed by a subsequent micronization step. Micronization is a high energy size-reduction process, typically performed in an air-jet mill, which exerts poor control over particle size, shape and size distribution ;[1] all of which influence the aerodynamic properties of particles.[2] Polymorphic transitions have also been reported to result from milling processes [3,4] and an alteration in particle surface energy has been measured following milling.[5-7] Despite its widespread use, micronization is an
undesirable production technique for APIs. The disturbances in surface crystallinity and surface energization can affect the adhesive/cohesive forces between micronized particles of APIs and other formulation components.[8] The energization of surfaces has resulted in blends lacking homogeneity.[9]
Alternative production techniques falling under the banner of ‘particle engineering’ have been developed to overcome such deficiencies of the macrocrystallization and micronization
approach for the production of Microparticles. Precipitation by antisolvent crystallization represents an attractive constructive approach for the production of APIs and may be termed antisolvent micronization. Precipitation is a rapid crystallization process characterized by high levels of solute supersaturation, generated upon the homogeneous mixing of a solution of an API with an appropriate antisolvent. Generating a molecularly homogeneous solvent composition throughout the crystallizer prior to nucleation is difficult at high supersaturation
[10]
resulting in disperse crystal nucleation and growth rates throughout the crystallizer.[1] Agglomeration and aging of precipitates may broaden the particle size distribution (PSD) yet further.[11] Control of the PSD is consequently difficult, as are reproducible generation of particles and scale up of the crystallization process.
the generation of amorphous regions during milling. Third, the use of growth inhibitors is highly specific for the molecule being crystallized and is also concentration dependent. All these factors result in further complications when developing an appropriate crystallization process. In addition, in the case of hydrophobic APIs such approaches require the use of potentially harmful organic solvents.
The use of conventional solvents in the pharmaceutical industry requires careful handling procedures during processing to avoid combustion and exposure for operators. The use of organic solvents also necessitates their thorough removal from the final product and questions can remain over the presence of residual solvents, even when using supercritical fluid techniques.[21]The use of poly(ethylene glycol) (PEG) in place of conventional solvents represents an attractive alternative since appropriate grades of the polymer display good solubility in water and in non-polar solvents. The amphiphilic polymer demonstrates notable powers of aqueous solubilization for hydrophobic drug molecules. [22] PEG has been proposed as a safe solvent because it demonstrates low flammability, low toxicity and it is
nonvolatile.[23] Thus the difficulties in using conventional organic solvents for pharmaceutical processing are obviated. An additional rationale for employing PEG as an alternative solvent is the polymer’s biodegradability [24,25]
which renders it environmentally benign, in comparison to conventional solvents. PEG is also on the Food and Drug Administration’s ‘generally regarded as safe (GRAS)’ list. Most recently low molecular weight PEGs have
been explored as a crystallization medium for macrocrystals of small molecular weight species. [26] Despite the latter observation and the use of PEG as a solvent for production of macrocrystals, the feasibility of using PEG for the production of microparticles has yet to be investigated. Propylene glycol represents an alternative non-volatile solvent for antisolvent techniques. [27] however, it was shown that similar to conventional organic solvents, macrocrystals were produced unless a crystal growth inhibitor (HPMC) was included. [28] Microfine suspensions of API crystals have been generated upon dissolution of high molecular weight PEG solid dispersions. [29] Therefore, both high and low molecular weight PEGs provide interesting novel solvent systems worthy of investigation for the antisolvent micronization of pharmaceuticals.
micronization of particles of API. In order to understand the manufacturing parameters controlling the crystal size distribution, factorial design of experiments was employed.
2. MATERIALS AND METHODS 2.1. Materials
Aceclofenac was used as a model drug and was a generous gift from Aarti Drug Distributors, Mumbai (India). HPMC E5 LV which was used as a stabilizing agent was obtained from Loba Chemie Pvt. Ltd, Mumbai. Ethanol of chromatographic grade was purchased from Finar Chemicals Ltd. All other chemicals and solvents were of reagent grade.
2.2. Determination of the equilibrium solubility of aceclofenac. [30]
PEG 400 solutions in water were prepared by weighing appropriate amounts of PEG into volumetric flasks. Water was added to the PEG to produce a series of w/w solutions (range 0–100% w/w PEG 400). The solutions were mixed using a magnetic stirrer. Each solution was transferred in turn to a glass beaker and excess aceclofenac was added. These suspensions were stirred for 5 min at 1000 rpm. The suspensions were ultrasonicated for 40 min to aid dispersion and dissolution. The suspensions were then placed in an orbital shaker and were left to equilibrate for 72 h at 250C in a temperature controlled water bath. Samples were filtered through 0.45 micron cellulose acetate filters into volumetric flasks and the concentration was detected by UV spectrophotometry.
2.3. Crystallization of aceclofenac [31]
2.3.1 Preparation of aceclofenac PEG 400 solutions
Solutions of aceclofenac were prepared by weighing the appropriate amount into a glass beaker and adding sufficient PEG 400 to achieve the required concentration (% w/w). The beakers were covered with sealing film, and the solution was subjected to ultrasonication for 5 min to aid aceclofenac dispersion and dissolution. Thereafter the solutions were mixed
using magnetic stirrer 2000 rpm for 10 min, 3000 rpm for 10 min, 1000 rpm for 5 min and finally ultrasonication for 5 min. The solutions were then filtered using a 0.45 micron
cellulose acetate filter into glass vials and sealed.
2.3.2. Crystallization by antisolvent addition
to batch, depending upon the amount of PEG solution initially weighed into the beaker. The crystals were harvested by vacuum filtration using a 0.45 micron nylon membrane filter. The wet cakes obtained were washed with water and dried in oven at 800C.
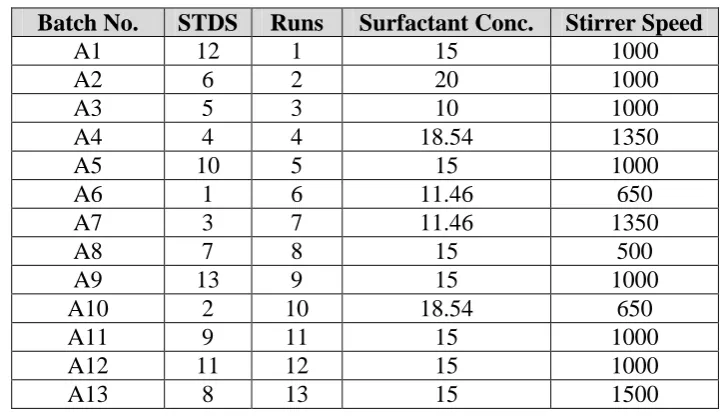
2.4.Experimental design for amphiphillic crystallization
Experimental runs (Batches) for optimization using Central composite design (CCD) are designed by considering two independent variables:
I) X1 = Surfactant Conc.
II) X2= Stirrer Speed
Details of process are given in table 1 and the response values for design are mentioned in table 2 and the actual batches obtained from the design are mentioned in table 3.
Table 1. Actual and coded values for amphiphillic crystallization
Factor Name Units Type Subtype Min Max -1 +1 Mean S.D.
A Surfactant Conc. % w/w Numeric Continuous 10 20 11.46 18.54 15 2.77
[image:5.595.115.477.508.716.2]B Stirrer Speed rpm Numeric Continuous 500 1500 645 1350 1000 277.35
Table 2. Responses for amphiphillic crystallization
Response Name Unit Obs Analysis
Y1 Particle size microns 13 Polynomial
Y2 Solubility mg/ml 13 Polynomial
Y3 Drug Content % 13 Polynomial
Y4 In vitro Drug Release % 13 Polynomial
Table 3. Experimental Runs obtained in CCD for amphiphillic crystallization Batch No. STDS Runs Surfactant Conc. Stirrer Speed
A1 12 1 15 1000
A2 6 2 20 1000
A3 5 3 10 1000
A4 4 4 18.54 1350
A5 10 5 15 1000
A6 1 6 11.46 650
A7 3 7 11.46 1350
A8 7 8 15 500
A9 13 9 15 1000
A10 2 10 18.54 650
A11 9 11 15 1000
A12 11 12 15 1000
2.4.1. Percentage yield:[32]
The percentage yield of the experiment was determined by using the formula given as:
2.4.2. Drug content[33]
Drug content was analyzed by taking 10 mg of Aceclofenac drug sample and dissolved in 100 ml of Phosphate Buffer pH 7.5. Each of these solutions was further diluted with phosphate buffer pH 7.5. Absorbance was measured on UV-visible spectrophotometer at 275nm. Drug content was determined by using the formula
2.4.3. Particle size:[34]
The average particle size of aceclofenac was measured by the method of laser light diffraction using Malvern Mastersizer Micro Ver. 2.19 (Malvern Instruments Ltd, UK). Prior to measurements, about 50 mg of each sample were dispersed with 100 ml of hexane. The particle size distributions were estimated by setting the intensity of the scattered light at wavelength of 750 nm and the scattering angle (θ) of 900
.
2.4.4. Saturation solubility
Saturation solubility of aceclofenac was determined in distilled water. Excess of drug 200 mg was added in each cap vial containing 5 ml distilled water. Each vial was sonicated for 15 min so that excess amount of drug gets dissolved up to super saturation and some drug is kept in suspended form. The vials were kept in orbital shaker for 48 hrs for stirring. The selected quantity of sample was centrifuged at 7500 rpm for 15 min so that excess amount of supernatant obtained. The drug in supernatant was analyzed by making proper dilution with
selected ratio of solvent by UV-Spectrophotometer at 275 nm to calculate the solubility of drug.
2.4.5. Fourier transform infrared spectroscopy[35]
Infrared spectrum of aceclofenac was determined on Fourier Transform Infrared Process efficiency =
Practical yield of drug (gm)
Wt. of drug taken (gm)
correction was done using dried potassium bromide. The samples to be analysed and KBr were previously dried in oven for 30 min and mixed thoroughly with potassium bromide in 1:25 (sample: KBr) ratio in a glass mortar. These samples were then placed in a sample holder and scans were obtained at a resolution of 2 cm-1 from 4000 to 400 cm-1.
2.4.6. Zeta Potential
Formulation (0.5 mL) was diluted to 50ml with distilled water in glass beaker with constant stirring. Zeta-potential of the resulting suspension was determined using the Zetasizer (model: Nano ZS, Malvern Instruments, Westborough, MA, USA). Electrophoretic mobility (μm/s) was measured using small volume disposable zeta cell and converted to zeta potential
by in-built software using Helmholtz–Smoluchowski equation. All determinations were made in triplicate.
2.4.7. Flow properties of product: [36]
The obtained powder sample by crystallization processing was further evaluated for its flow properties like angle of repose, bulk density, tapped density, hausner’s ratio, compressibility
index. These were the important properties which need to be studied before formulation into dosage form. Reports of these studies were given in results.
2.4.8. Polydispersity index
The PDI determination was done using photon correlation spectroscopy with in-built Zetasizer (model: Nano ZS, Malvern Instruments, Westborough, MA, USA) at 633 nm.
2.4.9. Differential Scanning Calorimetry (DSC):[37]
DSC measurements were performed on a differential scanning calorimeter equipped with an intra-cooler (DSC Mettler STAR SW 9.20, Switzerland). Inert atmosphere was maintained by purging nitrogen gas at a flow rate of 50 ml/min. All accurately weighed samples (about 5-10 mg of samples) were placed in a sealed aluminum pan, and the samples were heated under nitrogen gas flow (20 ml/min) at a scanning rate of 10 0C per min from 40 to 240 0C. An empty aluminum pan was used as reference.
2.4.10. Powder X-Ray Diffraction Study (XRD): [13, 21]
X-ray diffraction patterns of the processed powdered samples were recorded using Philips PW3710 Analytical XRD B. V. X-ray diffractometer using Cu K 2α rays with a voltage of 40 kV and a current of 25 mA. Samples were scanned for 2θ from 5 to 500. Diffraction pattern
2.4.11. Scanning Electron Microscopy (SEM): [12,38]
Morphological characteristics of processed aceclofenac powders were analysed by a Scanning Electron Microscope (JEOL, JSM-6360A, Japan). Powdersamples were dispersed on a carbon tab previously stuck to an aluminum stub. Samples were coated with gold-palladium (layer thickness 250Å) using a sputter coater.
2.4.12. Optical microscopy
Optical microscopy of the drug sample was carried out by using Motic Digital Microscope. slight quantity of the powder sample was spread on the glass slide by using fine haired brush. This slide was focused under various magnification lenses and pictures were captured.
2.4.13. In vitro drug release study:[39]
In vitro drug release study was carried out according to the guidelines given in USP 30- NF24. Test was performed by using USP apparatus II (Basket type). The volume of medium used was 900ml of Distilled water. The temperature was maintained at 37± 20c. The RPM of the study was kept at 50. 5ml aliquots were withdrawn at time interval of 5 min and the study was carried until the drug showed almost complete release from the capsule. According to the USP standards not less than 75% (Q) of the labeled amount of aceclofenac should get released (USP30).
3. RESULTS AND DISCUSSION
3.1. Solubilization of aceclofenac by PEG 400
The Saturation solubility of aceclofenac in different conc. of PEG 400 was found to be as follows
Table 4. Solubility of drug at different concentrations of PEG 400
PEG Conc. (% w/w) 0 20 40 60 80 100
Saturation Solubility (µg/ml) 18 107.32 616.59 1819.76 8317.62 12589.27
To investigate the suitability of PEG 400 as a crystallizing solvent for the antisolvent
micronization of aceclofenac it was necessary to establish the solubilization capacity of aqueous PEG for aceclofenac. A logarithmic increase in the solubility of aceclofenac with
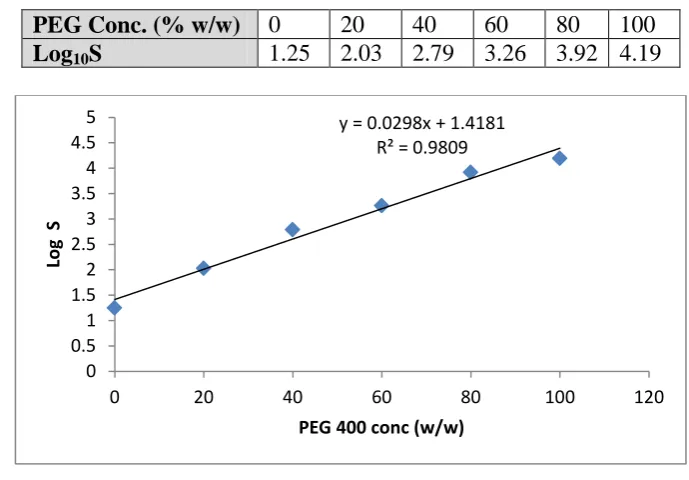
Table 5. Log of solubility of drug at different concentrations of PEG 400
PEG Conc. (% w/w) 0 20 40 60 80 100
Log10S 1.25 2.03 2.79 3.26 3.92 4.19
Figure 1. Graph of Log10 S as the function of PEG 400 (%w/w)
The regression equation for the solubility in the cosolvent system was Log10S = 0.029 PEG conc +1.418
The applicability of employing PEG as a solvent for the antisolvent micronization of hydrophobic compounds was shown by the ability to produce particles with a median diameter in the low micron size range. The generation of solution supersaturation is the driving force for solute precipitation in antisolvent micronization processes. Establishing the feasibility of controlled precipitation requires a thorough knowledge of the equilibrium solubility of the crystallizing substance as a function of antisolvent concentration. Only if a significant difference exists between the solubility of the substance in the solvent and
antisolvent can a precipitation process be effective [23]. PEG 400 solubilized aceclofenac with a typical log-linear increase in solubility as PEG concentration increased. There is an approximately 1000-fold difference between the solubility of aceclofenac in pure PEG 400 and in pure water. The deviation from log-linearity at high fractions of cosolvent is common and is usually observed in non-ideal solutions where specific solvation interactions exist (e.g. H bonding). Solutions of PEG in water show extensive interactions in the form of intermolecular H-bonds which break down the structure of water and hence facilitate an increase in solubility of hydrophobic compounds such as aceclofenac [24].
y = 0.0298x + 1.4181 R² = 0.9809
0 0.5 1 1.5 2 2.5 3 3.5 4 4.5 5
0 20 40 60 80 100 120
Log
S
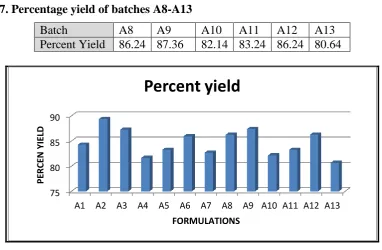
3.2. Percentage yield
The percent yield was calculated from the theoretical and practical yield. Since spray drying was not employed to obtain the microparticles in dried form, the percent yield increased. The percent yield was found to be in the range of 80-90%. The results of percent yield are given in table 6 and 7.
Table 6. Percentage yield of batches A1-A7
Batch A1 A2 A3 A4 A5 A6 A7
[image:10.595.105.488.258.508.2]Percent Yield 84.26 89.36 87.24 81.64 83.24 85.92 82.67
Table 7. Percentage yield of batches A8-A13
Batch A8 A9 A10 A11 A12 A13
Percent Yield 86.24 87.36 82.14 83.24 86.24 80.64
Figure 2. Percent yield of batches A1-A20
3.3. Drug content
Drug content in the microparticle batches (A1-A13) was analysed by UV spectrophotometer at 272 nm. The results of drug content are given in table 8 and 9.
Table 8. Drug content of batches A1-A7
Table 9. Drug content of batches A8-A13
75 80 85 90
A1 A2 A3 A4 A5 A6 A7 A8 A9 A10 A11 A12 A13
PE
R
CE
N
YI
ELD
FORMULATIONS
Percent yield
Batch A1 A2 A3 A4 A5 A6 A7
Drug Content (%) 73.54 76.32 78.24 79.24 71.1 72.54 76.21
Batch A8 A9 A10 A11 A12 A13
Figure 3. Drug content of batches A1-A13
Drug content in batch A3, A4, A10 was found to be highest. Batch A5 and A8 showed lowest % drug content in microparticles. This may be due to the stabilizer concentration and amphiphile concentration. Thus higher the stabilizer and amphiphile concentration, it shows highest encapsulation of drug and hence the drug content was found to be maximum.
3.4. Saturation solubility
Saturation Solubility of the microparticle batches (A1-A13) were analysed by UV spectrophotometer at 272 nm. The results of saturation solubility are given in table 10 and 11.
Table 10. Solubility of batches A1-A7
Batch A1 A2 A3 A4 A5 A6 A7
[image:11.595.92.498.488.750.2]Saturation Solubility (mg/ml) 0.234 0.256 0.165 0.273 0.227 0.181 0.209
Table 11. Solubility of batches A8-A13
Batch A8 A9 A10 A11 A12 A13
Saturation Solubility (mg/ml) 0.158 0.193 0.218 0.185 0.178 0.243
Figure 4. Saturation solubility of batches A1-A13
60
80
A1
A3
A5
A7
A9
A11
A13
DRU
G C
ON
TEN
T
FORMULATIONS
Drug content
0
0.5
A1
A3
A5
A7
A9
A11
A13
Solu
bi
lit
y
(m
g
/m
l)
FORMULATIONS
The values of solubility showed that there was significant change in solubility of aceclofenac after processing by amphiphillic crystallization. Initially unprocessed aceclofenac showed saturation solubility of 0.15 mg/ml in distilled water and later it was increased significantly ranging between 0.158 to 0.273 mg/ml as illustrated in fig. 4. Results indicate that the solubility has increased by 1.5 times than the original. When the process was carried out at higher amphiphile concentration and at greater rpm, product obtained showed the greater solubility in comparison with that of lower values. A4 showed the maximum solubility in water while batches A3 and A8 showed the minimum solubility amongst all other batches.
The increased solubility corresponds to decrease in particle size, increased exposed surface area to the solvent, thus increased interaction of solute and solvent.
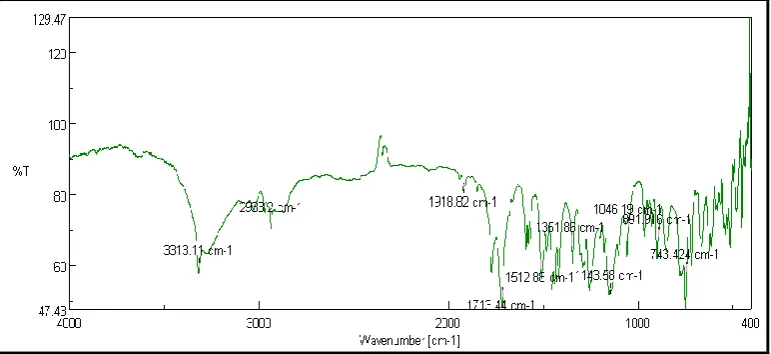
3.5. FTIR
Microparticles produced by amphiphillic crystallization were studied by FT-IR spectrum. It has been observed that all the characteristic peaks were retained but the intensity has been reduced in graphs of FTIR spectra, confirming compatibility of aceclofenac with all
[image:12.595.106.492.432.609.2]excipients. These results indicate that there is no chemical or structural alteration in drug (Figure 5).
Figure 5. FTIR spectra of Amphiphillic Crystallization formulation
3.6. Particle size
3.6.1. Particle size determination
Table 12. Particle size of batches A1-A7
Batch A1 A2 A3 A4 A5 A6 A7
Table 13. Particle size of batches A8-A13
Batch A8 A9 A10 A11 A12 A13
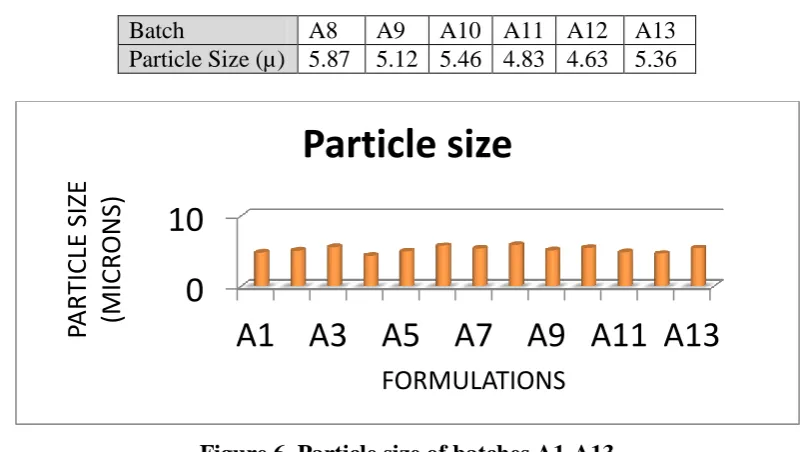
Particle Size (µ) 5.87 5.12 5.46 4.83 4.63 5.36
Figure 6. Particle size of batches A1-A13
The average particle diameter of the aceclofenac after complete processing of the drug is shown in table 12 and 13. The average particle size of aceclofenac when processed by amphiphillic crystallization technique is considerably smaller than the unprocessed
aceclofenac. The unprocessed aceclofenac showed particle diameter average upto 200 m
while after processing it shows particle diameter ranging from 4.5-6 m which is suitable for
the many of the formulations like powder for inhalation. At the lowest amphiphile concentration, the average particle size was around 6μm, which can be explained as supersaturation was not attained since solubility was way to less. The particle size reduced with the increasing amphiphile concentration. In accordance with classical nucleation theory, when supersaturation was increased, the median particle diameter decreased. A higher supersaturation leads to a large number of smaller crystals when supersaturation is consumed by nucleation events rather than crystal growth. Stirring also affects the balance of micro- and mesomixing processes. An increased stirrer speed increases the rate of micromixing enabling subsequent nucleation and the median particle size to be decreased. However, increased agitation minimizes local supersaturation (and lowers nucleation rates) by facilitating
turbulent mesomixing. Crystal growth involves an element of volume-diffusion control where solute molecules must diffuse through a diffusion barrier around nascent crystals. Increasing the stirring speed facilitates diffusion by decreasing the thickness of the stagnant boundary
layer, hence affecting the balance between nucleation and crystal growth. Both of these reasons explain the curvature observed in the response surface of the median diameter as a function of stirrer speed. [23]
0
10
A1 A3 A5 A7 A9 A11 A13
PA
RTI
CLE SIZ
E
(MI
CR
ON
S)
FORMULATIONS
3.6.2. Particle size distribution
Figure 7. Particle size distribution of batches A4
The mean diameter was found to be 4.815 micrometer. The particle size distribution was found to be narrow and sharp. The particle size distribution was found to be narrow which is indicated by the sharp peak. Thus all the particles were found to be uniform in size. The reason behind uniform particle size distribution may be due to increased supersaturation which leads to increased nucleation and inhibition of crystal growth.
3.7. Zeta potential determination
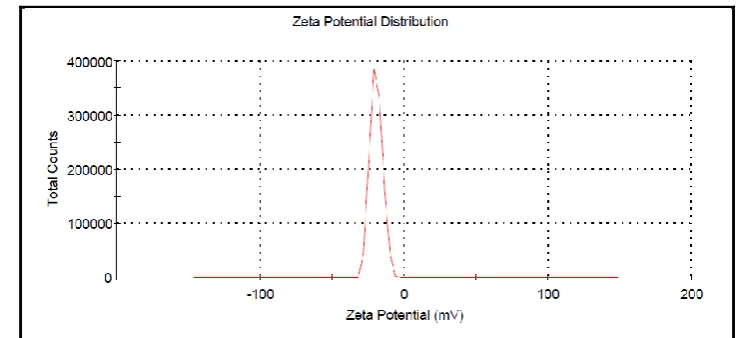
Figure 8. Zeta potential of Amphiphillic Crystallization formulation
The figure 8 represents the zeta potential of processed drug. The average zeta potential was found to be -28.9mV. This value indicates that the formulation has medium stability.
3.8. Polydispersity index
[image:14.595.109.481.421.590.2]3.9. Flow properties
Table 14. Flow properties of batches A1-A13 Optimized
Batch No.
Angle of repose (0)
Bulk density (gm/cm3)
Tapped Density (gm/cm3)
Carr’s index
Hausner’s ratio
A1 30.29±0.694 0.382±0.003 0.42±0.002 21.81±1.00 1.27±0.01
A2 32.21±0.467 0.36±0.003 0.466±0.002 22.73±0.34 1.29±0.02
A3 32.52±0.34 0.325±0.002 0.436±0.003 25.45±0.68 1.33±0.01
A4 31.34±0.53 0.323±0.002 0.425±0.003 23.76±1.06 1.31±0.02
A5 33.3±0.269 0.334±0.003 0.436±0.002 23.3±0.36 1.3±0.01
A6 32.68±0.409 0.313±0.003 0.417±0.002 24.86±0.86 1.32±0.01
A7 32.48±0.261 0.325±0.002 0.423±0.002 23.11±0.91 1.29±0.01
A8 33.18±0.36 0.354±0.002 0.461±0.002 23.12±0.79 1.29±0.01
A9 31.3±0.445 0.344±0.002 0.454±0.002 24.03±0.69 1.31±0.01
A10 30.72±0.657 0.333±0.002 0.453±0.002 26.47±0.88 1.35±0.01
A11 33.14±0.381 0.325±0.003 0.428±0.002 24.01±1.16 1.31±0.01
A12 32.27±0.56 0.336±0.002 0.434±0.003 22.54±0.70 1.28±0.01
A13 31.06±0.318 0.333±0.003 0.443±0.002 24.64±1.10 1.32±0.02
Microparticles of the aceclofenac were evaluated for its flow properties like Bulk density, Tapped density, Angle of repose, Compressibility properties and Hausner’s ratio [26]
The results of this analysis were shown in table 14.These reports shows that the formed particles have the flow properties within the passable range, and which is best suitable in both tablet as well as powder for inhalation formulations [31,32,33]. This may be probably due to formation of spherical particles by amphiphillic crystallization. Since the powder shows uniform distribution, the flow properties of drug are modified. [15]
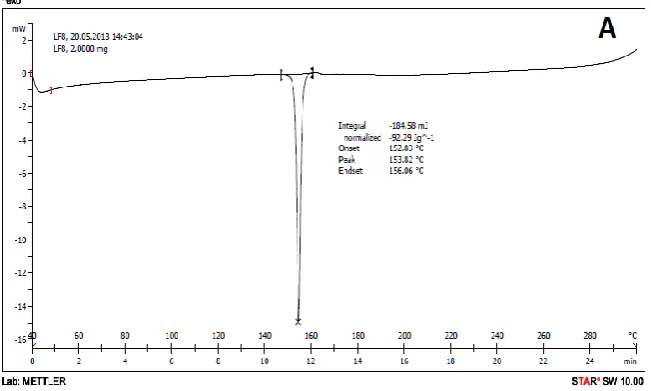
Figure 9. DSC of (A) Pure drug (B) Amphiphillic Crystallization formulation
The DSC measurements were carried out to further investigate the properties of the crystals and their DSC thermograms were shown in Figure 9. The thermograms of crude aceclofenac showed a single endothermic peak at 152°C (ΔH = -92.29 J/g) ascribed to drug melting. Microparticles exhibited a melting point of 143.09°C (ΔH = -45.65 J/g), indicating that the intrinsic crystalline properties had been retained. The decrease in melting ÄH can be understood first by the fact that, at a fast nucleation rate, the drug solute lacks sufficient time to be incorporated into the growing crystal lattice to form perfect crystals which leads to lower lattice energy. Second, the lower melting point can be attributed to the reduction in crystal size [12]. The decreased crystallinity of aceclofenac confirmed by DSC results might contribute to the increase of solubility, dissolution, and bioavailability.
Figure 10. XRD Graph of A) Drug B) amphiphillic crystallized Formulation
X-ray diffraction patterns of figure 10 revealed that pure drug was in crystalline state as it showed sharp distinct peaks notably at 2θ diffraction angles of 17.53, 18.53, 19.44, 22.27,
24.5, 25. 94, 32.210 with 838,1450, 904,1868,1604,5471,1175 intensities for Aceclofenac respectively. The reflections (specific peaks) corresponding to the drug were found in the formulation diffractogram with reduced intensity as 532, 919, 821, 1853, 787, 2973, 704 respectively as compared to drug alone. The reduction in intensity and number of typical
diffraction peaks in formulation diffractogram suggests reduction in crystalline nature of drug and may be converted partially from crystalline to amorphous form [26].
3.12. SEM
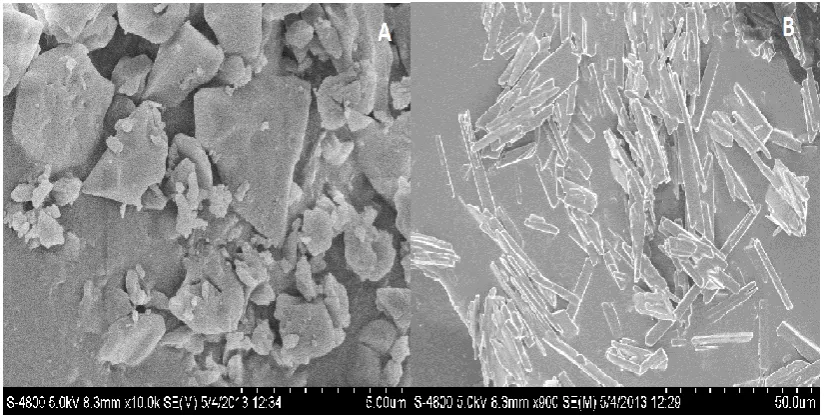
[image:17.595.90.509.511.720.2]Figure 11 A and 11 B represents surface morphology of unprocessed and processed drug respectively. The aceclofenac microcrystals were homogeneous acicular crystals but had a significantly smaller size and thickness. Examination of scanning electron micrographs of the particles indicated that the growth of all crystals produced by antisolvent micronization was limited to one dimensions, since needle-like crystals were produced. The crystals produced by antisolvent crystallization were thinner and more flaky than the micronized material used as the starting material [23,39]. After the amphiphillic crystallization, the micro-size aceclofenac crystal exhibited more regular short-claviform or columnar shapes and a more
narrow size distribution, compared to the crude drug crystals.
[image:18.595.86.499.282.469.2]3.13. Optical microscopy
Figure 12. Motic microscopic images of amphiphillic crystallization formulation
Figure 12 shows the optical microscopic (Motic Microscope) images of the aceclofenac after processing by amphiphillic crystallization. The image shows a very sharp distribution of drug particles after processing; there appears some clusters of the particles due to generation of static charges arises due to micronization. All A1-A13 batches show very fine and narrow distribution of the particles.
3.14. In vitro drug release profile
Table 15. Dissolution profile of batches A1-A5
Time(min) A1 A2 A3 A4 A5
0 0.000 0.000 0.000 0.000 0.000
5 10.39 11.82 12.64 13.46 15.26
10 45.12 39.27 43.87 49.37 47.65
15 53.55 46.31 50.32 57.48 55.33
25 67.26 67.34 63.22 68.24 69.37
30 71.23 71.33 70.60 74.16 72.15
45 77.34 76.58 79.36 80.34 79.26
60 80.93 79.34 82.62 85.64 83.64
Table 16. Dissolution profile of batches A6-A10
Time(min) A6 A7 A8 A9 A10
0 0.00 0.00 0.00 0.00 0.00
5 15.09 14.27 15.39 12.34 13.08
10 48.97 46.23 42.61 37.18 43.81
15 55.32 51.34 50.81 43.36 54.67
20 60.33 59.23 58.39 56.28 61.03
25 69.13 66.77 67.75 65.24 68.24
30 77.15 72.62 71.79 70.12 75.69
45 84.52 79.36 76.37 77.67 80.64
60 87.36 81.64 78.88 79.33 84.36
Table 17. Dissolution profile of batches A11—A13
Time(min) A11 A12 A13 Marketed
Formulation
0 0.000 0.000 0.000 0.000
5 15.67 14.35 13.63 8.27
10 39.57 38.26 42.18 26.84
15 48.64 46.37 50.67 39.28
20 60.83 58.27 59.37 46.63
25 64.29 63.48 67.14 56.37
30 70.68 69.11 76.28 65.28
45 78.95 78.24 80.67 71.02
[image:19.595.116.479.307.728.2]60 82.10 81.63 85.37 72.30
Figure 13. Dissolution profile of amphiphillic crystallization formulation A1-A7
0 10 20 30 40 50 60 70 80 90 100
0 20 40 60 80
% Dr u g R e le ase Time (min)
Dissolution Profile 0f A1-A7
Figure 14. Dissolution profile of Amphiphillic Crystallization formulation A8-A13
The in vitro dissolution profile of the drug (Aceclofenac) was carried as per the USP I (Basket type) apparatus (Electrolab-TDL-08L) specifications and the results of the in vitro
dissolution study are shown in table 15 to 17. All the batches A1-A13 showed better release profile than the pure unprocessed drug. The batches A1-A13 shows upto 75% of drug release within 30 min of study. Batches A6, A10 and A13 exhibited rapid release of drug. Batches A4, A6, A10 and A13 show maximum drug release. All the batches A1-A13 shows the release kinetics by first order drug release. It showed the r2 value upto 0.9620 and ‘K’ value was within 12.8536. These results have passed the USP specifications for the aceclofenac [26]. The Batches with greater solubility shows the rapid dissolution of drug. As the particle size of the processed aceclofenac is lesser, drug shows higher solubility which results into rapid release of the drug. Aceclofenac shows complete release of the drug from formulation but its
onset of action is late. After processing, onset was found to be quicker which may reduce dose requirement [28]. Graphs of the drug release from capsules were given in the Figure 13 and 14 which proves the release rate and its kinetics of drug release. This rapid release may be due to micronization of drug particles and increased solubility of drug, which ultimately enhances the dissolution of drug. Solubility depends on generated porosity, increased water uptake capacity of drug and decreased particle size, which rapidly dissolves drug in medium.
0 10 20 30 40 50 60 70 80 90
0 20 40 60 80
%
Dr
u
g R
e
le
ase
Time (min)
Dissolution Profile of A8-A13
A8
A9
A10
A11
A12
A13
Unprocessed drug
3.15. Statistical treatment: Analysis of data using Design Expert 3.15.1. Regression results of measured responses
Table 18. Regression Results of measured responses Responses S.D. R Squared Adjusted R
Squared
Adequate
Precision Model
Particle Size 0.23 0.8398 0.7254 7.744 Quadratic
Solubility 0.022 0.7376 0.6851 11.306 Linear
Drug Content 1.64 0.7857 0.6327 7.533 Quadratic
Drug Release 2.18 0.3417 0.2819 6.092 Linear
The "Pred R-Squared" must be equal or nearer to "Adj R-Squared". "Adeq Precision" measures the signal to noise ratio. A ratio greater than 4 is desirable. Here we can see that R squared values for all the responses are in reasonable agreement with Adjusted R- Squared value & the ratio of "Adeq Precision" is greater than 4 in all cases. Thus the respective models selected for the respective respone can be used to navigate the design space.
3.15.2. Effect on particle size
[image:21.595.62.538.425.557.2]ANOVA for Response Surface Reduced Cubic Model
Table 19. ANOVA for response surface reduced cubic model for particle size
Source Sum of
Square
Degree of freedom
Mean Sum
of Square F value
p- value Prob> F
Model 2.00 5 0.40 7.34 0.0105 significant
A- Surfactant Conc. 0.45 1 0.45 8.3 0.0236
B- Stirrer speed 0.63 1 0.63 11.49 0.0116
AB 0.12 1 0.12 2.24 0.1779
A2 0.2 1 0.2 3.63 0.0986
B2 0.68 1 0.68 12.54 0.0095
Lack of fit 0.25 3 0.084 2.55 0.1936 Not significant
The Model F-value of 7.34 implies the model is significant. There is only a 1.05% chance
that a "Model F-Value" this large could occur due to noise.
Values of "Prob > F" less than 0.0500 indicate model terms are significant. In this case A, B,
Figure 15. Effect of Stirrer speed and surfactant concentration on particle size
Final Equation in Terms of Coded Factors
Particle size = +4.86 -0.24 * A -0.28 * B -0.17 * A * B +0.17 * A2 +0.31 * B2
Final Equation in Terms of Actual Factors
Particle size = +10.11001 -0.33234 * surfactant conc -3.71240E-003 * stirrer speed
-1.40000E-004 * surfactant conc * stirrer speed +0.013500 * surfactant conc
2+2.51000E-006 * stirrer speed2
In accordance with classical nucleation theory, supersaturation increases with increase in surfactant concentration, the median particle diameter decreases. A higher supersaturation
response surface of the median diameter as a function of stirrer speed [29]. The optimum stirrer speed was found to be 1350 rpm.
3.15.3. Effect on solubility
[image:23.595.59.541.201.303.2]3.15.3.1. ANOVA for Response Surface Linear Model
Table 20. ANOVA for response surface linear model for solubility
Source Sum of
Square
Degree of freedom
Mean Sum of Square
F value
p- value Prob> F
Model 0.013 2 6.647E-003 14.03 0.0012 significant
A-Surfactant Conc. 6.59E-003 1 6.59E-003 13.94 0.0039
B- Stirrer speed 6.699E-003 1 6.699E-003 14.16 0.0037
Lack of fit 2.144E-003 4 3.573E-004 0.53 0.7540
Not significant
The Model F-value of 14.05 implies the model is significant. There is only a 0.12% chance that a "Model F-Value" this large could occur due to noise. Values of "Prob > F" less than 0.0500 indicate model terms are significant. In this case A, B are significant model terms. Values greater than 0.1000 indicate the model terms are not significant. The "Lack of Fit F-value" of 0.55 implies the Lack of Fit is not significant relative to the pure error. There is a 75.40% chance that a "Lack of Fit F-value" this large could occur due to noise. Non-significant lack of fit is good -- we want the model to fit.
Figure 16. Effect of Stirrer speed and surfactant concentration on solubility
Final Equation in Terms of Coded Factors
[image:23.595.91.501.480.645.2]Final Equation in Terms of Actual Factors
Solubility = +4.03404E-003 +8.12089E-003 * surfactant conc +8.18449E-005 * stirrer speed
In accordance with classical nucleation theory, supersaturation increases with increase in surfactant concentration, the median particle diameter decreases. A higher supersaturation leads to a large number of smaller crystals when supersaturation is consumed by nucleation events rather than crystal growth. Thus with increase in surfactant concentration, the particle size was decreased which further resulted in increased solubility due to high surface area. The optimum surfactant concentration was found to be 18.54% w/w.
Stirring also affects the balance of micro- and mesomixing processes. An increased stirrer speed increases the rate of micromixing enabling subsequent nucleation and the median particle size to be decreased. However, increased agitation minimizes local supersaturation (and lowers nucleation rates) by facilitating turbulent mesomixing. Crystal growth involves an element of volume-diffusion control where solute molecules must diffuse through a diffusion barrier around nascent crystals. Increasing the stirring speed facilitates diffusion by decreasing the thickness of the stagnant boundary layer, hence affecting the balance between nucleation and crystal growth [05]. Thus with increase in stirrer speed, particle size decreased and thus solubility increased. The optimum stirrer speed was found to be 1350 rpm.
3.15.4. Effect of drug content
[image:24.595.71.526.545.699.2]3.15.4.1. ANOVA for Response Surface Quadrtaic Model
Table 21. ANOVA for response surface quadrtaic model for drug content
Source Sum of
Square
Degree of freedom
Mean Sum
of Square F value
p- value Prob> F
Model 68.89 5 13.78 5.13 0.0269 significant
A-Surfactant Conc. 15.67 1 15.67 5.84 0.0463
B- Stirrer speed 15.28 1 15.28 5.69 0.0485
AB 5.29 1 5.29 1.97 0.2031
A2 31.69 1 31.69 11.81 0.0109
B2 0.057 1 0.057 0.021 0.888
Lack of fit 4.23 3 1.41 0.39 0.7692
Not significant
The Model F-value of 5.13 implies the model is significant. There is only a 2.69% chance
Values of "Prob > F" less than 0.0500 indicate model terms are significant. In this case A, B,
[image:25.595.90.504.200.372.2]A2 are significant model terms. Values greater than 0.1000 indicate the model terms are not significant. The "Lack of Fit F-value" of 0.39 implies the Lack of Fit is not significant relative to the pure error. There is a 76.92% chance that a "Lack of Fit F-value" this large could occur due to noise. Non-significant lack of fit is good -- we want the model to fit.
Figure 17. Effect of Stirrer speed and surfactant concentration on drug content
Final Equation in Terms of Coded Factors:
Drug content = +73.45 +1.40 * A +1.38 * B -1.15 * A * B +2.13 * A2 -0.091 * B2
Final Equation in Terms of Actual Factors
Drug content = +87.49836 +3.80637 * surfactant conc +0.019161 * stirrer speed -
9.20000E-004 * surfactant conc * stirrer speed +0.17074 * surfactant conc 2 -
7.26000E-007 * stirrer speed2
From the equation it was found that with increase in surfactant concentration, the drug content increased. The most probable reason behind this is supersaturation, which leads to increased drug concentration dissolved in the solvent. With increase in stirrer speed, due to micromixing phenomenon, the drug content was increased.
3.15.5. Effect on drug release
Table 22. ANOVA for response surface reduced linear model for drug release
Source Sum of
Square
Degree of freedom
Mean Sum of Square
F value p- value Prob> F
Model 27.19 1 27.19 5.71 0.0359 significant
B- Stabilizer Conc. 27.19 1 27.19 5.71 0.0359
Lack of fit 42.39 7 6.06 2.43 0.2048
Not significant
The Model F-value of 5.71 implies the model is significant. There is only a 3.59% chance
that a "Model F-Value" this large could occur due to noise.
Values of "Prob > F" less than 0.0500 indicate model terms are significant. In this case B are significant model terms. Values greater than 0.1000 indicate the model terms are not significant. The "Lack of Fit F-value" of 2.43 implies the Lack of Fit is not significant relative to the pure error. There is a 20.48% chance that a "Lack of Fit F-value" this large could occur due to noise. Non-significant lack of fit is good -- we want the model to fit.
Figure 18. Effect of Stirrer speed and surfactant concentration on drug release
Final Equation in Terms of Coded Factors:
Drug release = +81.75 +1.84 * B
Final Equation in Terms of Actual Factors
Drug release = +76.53878 +5.21429E-003 * stirrer speed
[image:26.595.91.503.355.534.2]size was decreased [23]. According to Noyes Whitney equation, with decrease in particle size, there is an increase in solubility which further leads to increased dissolution profile. The optimum surfactant concentration was found to be 18.54% w/w.
Stirring also affects the balance of micro- and mesomixing processes. An increased stirrer speed increases the rate of micromixing enabling subsequent nucleation and the median particle size to be decreased. However, increased agitation minimizes local supersaturation (and lowers nucleation rates) by facilitating turbulent mesomixing [28]. The decreased particle size leads to increased solubility and thus improved drug release. The optimum stirrer speed was found to be 1350 rpm.
4. CONCLUSION
PEG has been shown to be eminently suitable as a crystallization medium for the antisolvent crystallization of aceclofenac. A sufficient degree of solubilization for aceclofenac in water enabled the production of microparticles according to a novel and environmentally benign production method of amphiphilic crystallization. Crucially, the PSD was shown to depend on the hydrodynamic conditions prevailing in the crystallizer and did not require the use of traditional crystallization inhibitors. In this study the factors controlling the microcrystallization of aceclofenac by amphiphilic crystallization have been identified. Future work will focus on determining the suitability of the AmphiCrys process for other drug substances.
REFERENCES
1. Chan HK, Chew NYK. Novel alternative methods for the delivery of drugs for the treatment of asthma. Adv. Drug Deliv. Rev, 2003; 55:793–805.
2. Musante CJ, Schroeter JD, Rosati JA, Crowder TM, Hickey AJ, Martonen TB, Factors affecting the deposition of inhaled porous drug particles. J. Pharm. Sci. 2002; 91: 1590–
1600.
3. Bauer-Brandl A, Polymorphic transitions of cimetidine during manufacture of solid
dosage forms. Int. J. Pharm, 1996; 140: 195–206.
4. Brittain HG, Effects of mechanical processing on phase composition,J. Pharm. Sci. 2002; 91: 1573–1580.
5. Heng JYY, Thielmann F, Williams DR, The effects of milling on the surface properties
6. York P, Ticehurst MD, Osborn JC, Roberts RJ, Rowe RC,Characterisation of the surface energetics of milled DL-propranolol hydrochloride using inverse gas chromatography and molecular modelling, Int. J. Pharm. 1998; 174: 179–186.
7. Tong HHY, Shekunov BY, York P, Chow AHL, Influence of polymorphism on the surface energetics of salmeterol xinafoate crystallized from supercritical fluids, Pharm. Res. 2002;19: 640–648.
8. Cline D, Dalby R, Predicting the quality of powders for inhalation from surface energy and area, Pharm. Res. 2002; 19: 1274–1277.
9. Davies M, Brindley A, Chen XY, Marlow M, Doughty SW, Shrubb I, Roberts CJ, Characterization of drug particle surface energetics and Young’s modulus by atomic force
microscopy and inverse gas chromatography, Pharm. Res.2005; 22: 1158–1166.
10. Mackin L, Sartnurak S,Thomas I, Moore S, The impact of low levels of amorphous material (<5%) on the blending characteristics of a direct compression formulation, Int. J. Pharm. 2002;231: 213–226.
11.Haberkorn HH, Franke D, Frechen T,Goesele W, Rieger J, Early stages of particle formation in precipitation reactions – quinacridone and boehmite as generic examples, J. Colloid Interface Sci. 2003; 259: 112–126.
12. Mersmann A, Crystallization and precipitation, Chem. Eng. Proc. 1999; 38: 345–353. 13.Rogers TL, Gillespie IB, Hitt JE, Fransen KL, Crowl CA, Tucker C, Kupperblatt GB,
Becker JN, Wilson DL, Todd C, Elder EJ, Development and characterization of a scalable controlled precipitation process to enhance the dissolution of poorly water soluble drugs, Pharm. Res. 2004; 21: 2048–2057.
14. Rasenack N, Steckel H, Muller BW, Micronization of anti-inflammatory drugs for pulmonary delivery by a controlled crystallization process, J. Pharm. Sci. 2003;92: 35–44.
15.Rasenack N, Steckel H, Muller BW, Preparation of microcrystals by in situ
micronization, Powder Technol. 2004; 143: 291–296.
16.Steckel H, Rasenack N, Villax P, Muller BW, In vitro characterization of jet-milled and in-situ-micronized fluticasone-17-propionate,Int. J. Pharm. 2003; 258: 65–75.
17.Elamin AA, Ahlneck C, Alderborn G, Nystrom C, Increased metastable solubility of milled griseofulvin, depending on the formation of a disordered surface structure, Int. J. Pharm. 1994; 111: 159–170.
18. Rodriguez-Hornedo N, Murphy D, Significance of controlling crystallization
19.Kaerger JS, Price R, Processing of spherical crystalline particles via a novel solution atomization and crystallization by sonication (SAXS) technique, Pharm. Res. 2004; 21: 372–381.
20. Chow AHL, Tong HHY, Chattopadhyay P, Shekunov BY, Particle engineering for pulmonary drug delivery, Pharm. Res.2007;24: 411–437.
21.Thiering R, Dehghani F,Foster NR, Current issues relating to anti-solvent micronisation techniques and their extension to industrial scales, J. Supercrit. Fluids 2001; 21: 159–177.
22.Rytting E, Lentz KA, Chen XQ, Qian F, Venkatesh S, Aqueous and cosolvent solubility
data for drug-like organic compounds, AAPS J. 2005; 7: E78–E105.
23. Chen J,Spear SK, Huddleston JG, Rogers RD, Polyethylene glycol and solutions of polyethylene glycol as green reaction media,Green Chem. 2005;7: 64–82.
24.Huang YL, Li QB, Deng X, Lu YH, Liao XK, Hong MY, Wang Y, Aerobic and
anaerobic biodegradation of polyethylene glycols using sludge microbes, Process Biochem. 2005;40: 207–211.
25.Moldovan Z, gado Luque MV, Salaverri EO, Suarez A, Andreozzi R, Insola A, Martinez
JL, Determination of polyethylene glycols in water by reversed-phase high-performance liquid chromatography, J. Chromatogr. A 1996; 723: 243–249.
26.Wang X, Ponder CS, Kirwan DJ, Low molecular weight poly(ethylene glycol) as an environmentally benign solvent for pharmaceutical crystallization and precipitation, Crys. Growth Des.2005; 5: 85–92.
27. Davis AF, Hadgraft J, Effect of supersaturation on membrane transport: 1.
Hydrocortisone acetate, Int. J. Pharm. 1991; 71: 1–8.
28.Raghavan SL, Schuessel K, Davis A, Hadgraft J, Formation and stabilisation of triclosan colloidal suspensions using supersaturated systems, Int. J. Pharm. 2003;231: 153–158. 29.Sjokvist E, Nystrom C, Physicochemical aspects of drug release. VI.Drug dissolution rate
from solid particulate dispersions and the importance of carrier and drug particle
properties, Int. J. Pharm. 1988; 47:51–66.
30.Mosharraf M, Nystrom C, The effect of particle size and shape on the surface specific
dissolution rate of micronized practically insoluble drugs. Int. J. Pharm. 1995; 122: 35-47.
31.Blagden N, Matas MD, Gavan PT, York P, Crystal engineering of active pharmaceutical
ingredients to improve solubility and dissolution rates, Adv. Drug Deliv. Rev. 2007,59; 617–630.
32.Koshy P, Pacharane S, Chaudhary A, Jadhav K, Kadam V, Drug particle engineering of
33.Yu QW, Chew JW, Chow PS ,Tan RBH, Recent advances in crystallization control :An Industrial Perspective, Chem. Eng. Res. Des.2007;85 (A7) :893–905.
34.Murnane D, Marriott C, Martin GP, Comparison of salmeterol xinafoate microparticle production by conventional and novel antisolvent crystallization, Eur. J. Pharm. Biopharm..2008;69: 94–105.
35.Faiyaz S, Wafa R, Sheikh S, Solubility and Dissolution Improvement of Aceclofenac using Different Nanocarriers, JBB.2009;1(2) :39-43.
36.Shivalingam AB, Reddy YV, Rao S, Rajesh. K, Sunitha N, Formulation and Evaluation
of Aceclofenac Solid Dispersions for Dissolution Rate Enhancement,
IJPSDR.2010;2(2):146-150
37. Rao KS, Udgirkar DB, Mule DD, Enhancement of dissolution rate and bioavailability of Aceclofenac by Complexation with cyclodextrin, RJPBCS. 2010; 1(4):142-151
38. Chowdary KPR, Enturi V, Sandhya A, Formulation Development of Aceclofenac Tablets
Employing Starch Phosphate -A New Modified Starch, IJPSR. 2011;2(3): 124-129. 39.Gupta S, Saini L, Effect of lyophilization and polymer compositions on solubility of