www.wjpr.net Vol 3, Issue 9, 2014. 998
IMPURITY METHOD DEVELOPMENT AND VALIDATION OF
TAMSULOSIN HYDROCHLORIDE BY USING RP-HPLC
M. Santhi Priya*1, K.Shanta kumari1, M. Bhanu Prasad2, G.Priyanka1, T.Sirisha1
1
Department of Pharmaceutical Analysis, Nirmala College of Pharmacy, Atmakuru, Mangalagiri-522503, Guntur, India.
2
Head, Quality Unit, Pellets Pharma pvt Ltd., Pashamylaram, Patancheru (M), Medak (dist),
AP-502307.
ABSTRACT
A simple, precise, rapid, specific and accurate reverse phase high performance liquid chromatographic method was developed for the estimation of Tamsulosin HCl and its related substances (impurity H and impurity I) in Tamsulosin HCl sustained release pellets. Chromatographic separation was performed on kromasil C-18 (250mmx4.6mm, 5µm) column, with mobile phase comprising of a mixture of buffer and acetonitrile (pH2.0, adjusted with conc.NaOH) in the ratio of 65:35v/v, at a flow rate of 1ml/min. The detection was carried out at 225 nm. The retention times of tamsulosin, impurity H and impurity I, were found to be 7.269, 24.902, and 48.239min respectively with a run time of 60min. As per ICH guidelines the method was validated for linearity, accuracy, precision, specificity, limit of detection and limit of quantitation, robustness and ruggedness. Linearity of tamsulosin HCl, impurity H and impurity I were found in the range of 0.0192-0.0512, 0.02-0.12 & 0.0192-0.0512µg/mL and correlation coefficient were 0.9998, 0.9993, and 0.9995 respectively. The results clearly demonstrated that the developed method was simple, precise, rapid, selective, accurate and reproducible for the estimation of impurity H and impurity I in tamsulosin HCl.
KEYWORDS: RP‐HPLC. Tamsulosin HCl, Impurities, Validation.
INTRODUCTION
Drug profile: Tamsulosin HCL is described chemically as (R) ‐ 5‐ (2‐ (2‐ethoxyphenoxy)
Volume 3, Issue 9, 998-1005. Research Article ISSN 2277– 7105
Article Received on 04 September 2014,
Revised on 29 Sept 2014, Accepted on 23 Oct 2014
*Correspondence for
Author
Dr. M. Santhi Priya
Department of
www.wjpr.net Vol 3, Issue 9, 2014. 999 ethy l aminopropyl)‐2 methoxy benzene sulphonamide. It is a selective α1 receptor antagonist.
Impurity Profile: The present study was planned to estimate related substances in the pellets
by developing and validating RP-HPLC method. In this paper, we describe a simple and rapid HPLC method for determination of synthetic impurities of TAM in SR Pellets by using a reverse phase C18 column with mobile phase comprising of a mixture of buffer and acetonitrile (pH2.0, adjusted with conc.NaOH) in the ratio of 65:35v/v, at a flow rate of 1ml/min. The detection was carried out at 225 nm.
MATERIAL AND METHODS
Materials and Reagents: All reagents were of analytical grade, HPLC grade acetonitrile, perchloric acid obtained from Merck specialities, India were used.High purity Milli-Q water purification system TAM and its impurities were purchased from cadila Health care Ltd, India.
Instruments: The HPLC system (Shimadzu LC-2010 CHT) used consists of a pump, auto
sampler and U.V detector. The output signal was monitored and processed using LC-solutions software.
Chromatographic conditions: The mobile phase contains buffer pH 2.0 acetonitrile: water
65: 35%v/v. Before delivering into the system it was filtered through 0.45μm PTFE filter and degassed using a vacuum. The analysis was carried out under gradient condition using a flow rate of 1ml/min at 40ºC temperature. Chromatogram was recorded at 225nm using U.V. detector.
Method Development and Optimization: Solvent selectivity (solvent type), solvent
strength, (volume fraction of organic solvent (s) in the mobile phase), detection wavelength and flow rate were varied to determine the chromatographic conditions giving the best estimation. The mobile phase conditions were optimized, so there was no interference with the Tamsulosin Hcl peak from excipient peaks. UV visible spectra in the range 200-400 nm were acquired from a solution of the drug in the mobile phase.
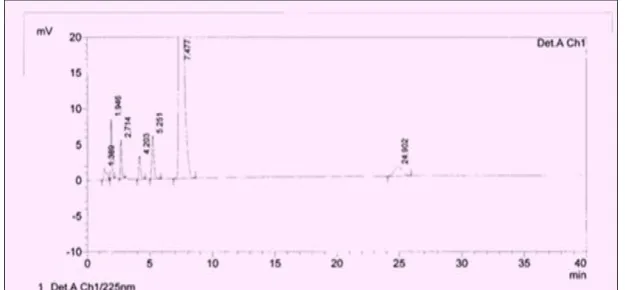
Chromatography: Sharp peaks were obtained for Tamsulosin Hydrochloride and its
www.wjpr.net Vol 3, Issue 9, 2014. 1000 Were 7.269, 24.902, and 48.239min and the overall chromatographic condition is 60 min. Method Validation: The proposed method was validated as per ICH guidelines
Analytical Procedure
Preparation of Standard Solution
Dissolved an accurately weighed quantity of 10mg of tamsulosinHCl working standard (In-House) and transfer carefully into a 100ml volumetric flask. Add few ml of mobile phase and sonicated for 5min. adjust the volume to the mark with mobile phase filter through whatmann filter paper. Dilute 2ml of the filtrate to 10ml with mobile phase. The concentration of the resulting solution was 20.0µg/ml.
Preparation of Impurity Standard H Solution
Dissolved an accurately weighed quantity of 3.5mg of impurity standard H directly into a10ml volumetric flask and adjust to the mark with mobile phase.
Preparation of Impurity Standard I Solution
Dissolved an accurately weighed quantity of 3.6mg of impurity standard I directly into a10ml volumetric flask and adjust to the mark with mobile phase.
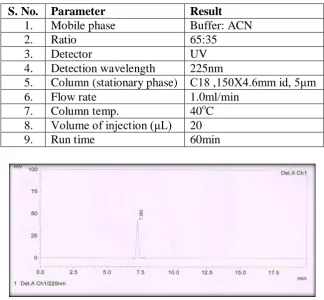
Table 1 Optimized chromatographic condition.
S. No. Parameter Result
1. Mobile phase Buffer: ACN
2. Ratio 65:35
3. Detector UV
4. Detection wavelength 225nm
5. Column (stationary phase) C18 ,150X4.6mm id, 5μm 6. Flow rate 1.0ml/min
7. Column temp. 40oC 8. Volume of injection (μL) 20
9. Run time 60min
[image:3.595.135.460.448.748.2]
www.wjpr.net Vol 3, Issue 9, 2014. 1001 Fig.2.Optimized chromatogram of impurityH
Fig.3.Optimized chromatogram of impurity I
Table.2. Optimized RRTS for impurities.
Impurity standard RT(min) RRT
H 24.902 3.42
I 48.239 6.63
Linearity
Calibration graph (concentration versus peak area) were constructed at different concentration for TAM (0.019‐ 0.051μg/ml),impurity H(0.0203-0.1218μg/ml) impurity I(0.0195-0.0525) Three independent determinations were carried out of each concentration and good linearity was found Table 3-4 gives linear equation, range and correlation coefficient for all compounds.
Table. 3. Linear regression data for TAM and its impurities
Compound Con(μg/ml) Linearregression Correlationcoefficient
[image:4.595.142.455.72.217.2]www.wjpr.net Vol 3, Issue 9, 2014. 1002 Fig.4.STD linearity Plo
Fig.5.Impurity H linearity Plot
Fig.5.ImpurityIlinearityPlot
Accuracy: Standard mixtures containing known amounts of TAM, impurity H&I were
www.wjpr.net Vol 3, Issue 9, 2014. 1003 Recovery study for impurity H.
S. No 25% 50% 75%
AREA %RECOVERY AREA %RECOVERY AREA %RECOVERY
1 1124 107.53 2022 96.72 3064 97.70
2 1079 103.22 2059 98.48 3157 100.67
3 1128 107.91 2124 101.59 3069 97.86
AVG 1110.33 106.22 2068.33 98.93 3096.67 98.75
SD 27.21 51.64 52.31
% RSD 2.45 2.50 1.69
S.No 100% 125% 150%
AREA %RECOVERY AREA %RECOVERY AREA %RECOVERY
1 4132 98.82 5149 98.51 6125 97.66
2 4289 102.57 5164 98.80 6275 100.05
3 4238 101.36 5217 99.81 6195 98.77
AVG 4219.67 100.92 5176.67 99.04 6198.33 98.82
SD 80.09 35.73 75.06
% RSD 1.89 0.69 1.21
Recovery study for impurity I
S. No 60% 80% 100%
AREA %RECOVERY AREA %RECOVERY AREA %RECOVERY
1 1019 101.48 1338 97.32 1657 98.10
2 1002 99.79 1387 100.88 1684 99.70
3 1068 106.36 1386 100.81 1676 99.22
AVG 1029.6 102.54 1370.3 99.67 1672.3 99.01
SD 34.27 28.01 13.87
% RSD 3.33 2.04 0.83
S.No 120% 140% 160%
AREA %RECOVERY AREA %RECOVERY AREA %RECOVERY
1 2029 98.51 2328 100.24 2453 92.86
2 1944 94.38 2311 99.51 2616 99.03
3 1976 95.93 2120 91.28 2582 97.74
AVG 1983 96.27 2253 97.01 2550.33 96.54
SD 42.93 115.49 85.99
% RSD 2.16 5.13 3.37
Precision: Precision is a method and concentration specific, which in practice can be varied
and the result for precision is standard deviation is 1.620241 Impurity profiling: (Spike study) Impurity profiling is a description of the identified and unidentified impurities in API and can be confirmed by spike study which means theaccuracy is validated by analyzing a synthetic mixture of components, which contain known amount of drug substance.
CONCLUSION
www.wjpr.net Vol 3, Issue 9, 2014. 1004 quantitative analysis of drugs and pharmaceuticals. The method was validated and found to be simple, sensitive, accurate and precise. It was proved to be convenient and effective method for development and validation.
ACKNOWLEDGMENT
The authors are thankful to Nirmala College of Pharmacy, Atmakuru, Mangalagiri Guntur, IndiaPellets Pharma pvt Ltd., Pashamylaram, Patancheru (M), Medak (dist), Hyderabad for providing the necessary facilities to carry out the research work.
REFERENCES
1. Mandava V. Basavasewara Rao, Bhumireddy Chennakesava Reddy, Tumati Srinivas Rao and Jamini Ranjan Mohanty, “Determination of Tamsulosine Hydrochloride 0.2%
andTolterodine Tartrate 0.2% Combination Pellets By RP HPLC Method”, Research Journal of Pharmaceutical, Biological and Chemical Sciences, 2010; 1(1):136-140.
2. Siva Rama Krishna G.V, Janardhan M and Rasool SK, “Development and Validation of Stability-Indicating RPHPLC Method for Estimation of Tamsulosin HCl Pellets”, International Journal of Pharmaceutical Invention, 2012; 2(7): 51-60.
3. Thomas sudha and Jitendra dhomane, “A Validated RPHPLC Method For The Determination Of Impurities In Tamsulosin HCl” ,International Journal of Chemistry Research, 2011; 2(4):29-33
4. S. Vijaya saradhi, SK. Meherjaha, Y. Prithvi Prasad, P. Baby sirisha and C. Bala sekaran, “RP-HPLC Method For The Estimation of Tamsulosin In Bulk and Capsules”,
International Journal of Pharmacy and Pharmaceutical Sciences,2013; 5(2):342-345. 5. Nanda RK, Gaikwad J and Prakash A, “Estimation of Tamsulosin and Tolterodine in Its
Pharmaceutical Dosage Form by Spectrophotometric Method” International Journal of Pharmtech Research, 2009; 1(3): 420-423
6. S. B. Bari, A. R. Bakhshi, P. S. Jain, and S. J. Surana Development and Validation of Stability-Indicating HPTLC Determination of Tamsulosin in Bulk and Pharmaceutical Dosage Form Chromatography Research International 20 December 2010.
7. D.B.PATEL*, N.J. PATEL Validated stability indicating HPTLC method for the
determination of Tamsulosin hydrochloride in pharmaceutical dosage forms International Journal of Chem Tech Research Jan-Mar. 2010; 2(1): 646-652.
8. Chandorkar JG et al, Chandorkar J1, Kotwal V, Dhande N, Gurav S, Pande V, Yadav P.
www.wjpr.net Vol 3, Issue 9, 2014. 1005 its impurity. Pub med, 2008; 21(3):307-10.