FORMULATION AND OPTIMIZATION OF DELAYED RELEASE
TABLET CONTAINING DOXYCYCLINE HYCLATE
Ritesh R. Dode*1 and Chetan M. Jain1
Government College of Pharmacy, Kathora Naka, Amravati.
ABSTRACT
Doxycycline hyclate act by broad spectrum antibacterial agent
belonging to chemical class of tetracycline derivative. In this research
paper various enteric coating polymers are used in formulation to
attained delayed release of drug. Tablet formulation was prepared by
using various excipients and delayed release polymers and their
evaluation test are performed. Nine formulation trial batches were
prepared by using Minitab 18 32 full factorial design. In that three
formulation level (High, Medium and Low) of delayed release polymer
as a factor and dissolution and drug content as an response were taken.
From all nine batches batch F3 were selected as an optimized batch because of %Cumulative
drug release and drug content were found satisfactory. Batch F3 gives results of % CDR
(95.16%) and % drug content (101.25 %) having the concentration of 21.63 mg and 64.88 mg
of HPMC K100M and Ethyl cellulose respectively and hence batch F3 was selected as an
optimized batch.
INTRODUCTION
Each tablet made up of one or more active substances and usually obtained by compressing
uniform volumes of particles. The particle containing one or more active substances with or
without excipients such as diluents, binders, disintegrating agents, glidants, lubricants,
substances capable of modifying the behavior of the preparation in the digestive tract,
coloring matter authorized by the competent authority and flavoring substances.[1] To achieve
the better therapeutic effect drugs needs to be reach at right place at right time. These kind of
result obtained for certain drugs by simple solution or by conventional dosage form but for
other drugs some modifications for release the drug in the body.[2] Modified release are the
dosage form which release the drug at chosen location in at right time to achieve the
Volume 8, Issue 12, 1048-1071. Research Article ISSN 2277– 7105
Article Received on 15 Sept. 2019,
Revised on 06 Oct. 2019, Accepted on 27 Oct. 2019
DOI: 10.20959/wjpr201912-16062
*Corresponding Author Ritesh R. Dode
Government College of
Pharmacy, Kathora Naka,
therapeutic effect which never achieved by the conventional dosage form. Modified release
dosage forms are categorized into two types, one is delayed-release dosage form which does
not immediately release the drug after administration and another one is extended-release
dosage form. ER formulations can be referred to as dosage forms that allow at least a two
fold reduction in the dosing frequency compared to a conventional dosage form.[3] In
delay-release dosage form the drug is purposefully delayed before it reaches to intestine because of
several reasons such as degradation of drug in Gastric pH, to minimize irritation to
stomach.[4] Delayed release dosage form are formulated by using various enteric coated
polymers or delayed release polymers either by incorporated into formulation or by enteric
coating. In this research paper various enteric coating polymers are used in formulation to
attained delayed release of drug.
MATERIALS AND METHODS
Doxycycline Hyclate provided by Athena drug delivery solution Pvt. Ltd., HPMC K100M,
Ethyl cellulose, HPMC phthalate, Microcrystalline Cellulose, Magnesium stearate, PVP K
30M, Aerosil.
EXPERIMENTAL WORK Identification of drug
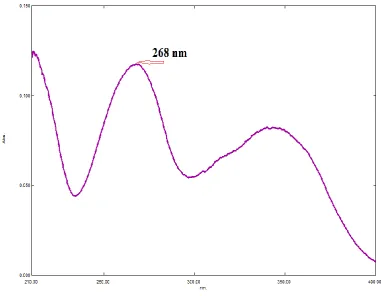
Absorption maxima determination:
The solution of Doxycycline hyclate in the concentration of 10mg/ml was prepared using
water. It was scanned over the wavelength range of 200-400 nm using double beam U.V.
spectrophotometer with water as blank.
Melting point determination
Melting point was determined by open capillary method.
Preparation of calibration curve of standard plot Doxycycline hyclate
Doxycycline hyclate was accurately weighted (10mg) and dissolved in 10 ml of phosphate
buffer 6.8 and 1.2 to produce a primary stock solution of 1mg/ml (1000ug/ml). The 1ml of
primary stock solution was suitably diluted with 100ml of distilled water to produce working
stock solution in concentration of 10ug/ml. From the above solution withdraw 1ml, 2ml, 3ml,
4ml and 5ml solution in volumetric flask with continues dilution to make final volume of 10
ug/ml respectively. Absorbance of the solution was recorded at 268 nm using double beam
UV spectrophotometer with water as a blank.
Formulation of delay release tablets for trial batches
The tablets were formulated by using direct compression technique. The compositions of
tablet formulation were given in table no.1. All ingredients were mixed in geometrical order
as mentioned in formula tablet by passing through sieve #24 except only magnesium stearate
passed through sieve #60 sieve. After trituration mixture was blended and then directly
compressed using capsule shaped punches.
Table 1: Formulation Table of All Preliminary Batches. Batch No.
F1 F2 F3 F4 F5 F6 F7 F8 F9
Ingredients
API 50 50 50 50 50 50 50 50 50
HPMC K100 M 21.62 21.62 21.62 43.25 43.25 43.25 64.88 64.88 64.88 Ethyl cellulose 21.62 43.25 64.88 21.62 43.25 64.88 21.62 43.25 64.88
HPMC Phthalate 10 10 10 10 10 10 10 10 10
MCC 34.26 72.63 51 72.63 51 29.57 51 29.37 7.74
Aerosil 1.5 1.5 1.5 1.5 1.5 1.5 1.5 1.5 1.5
Mg Stearate 1.0 1.0 1.0 1.0 1.0 1.0 1.0 1.0 1.0
PVP K 30 12 12 12 12 12 12 12 12 12
Evaluation of preliminary (trial) batches Thickness
Thickness and diameter were measured using vernier caliper.
Hardness
The hardness of tablet of each formulation was measured by monsanto hardness tester. The
hardness was measured in terms of kg/cm2.
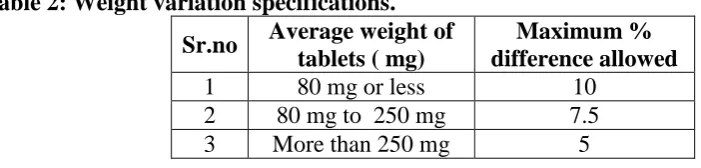
Weight variation
Randomly 20 tablets were selected after compression and average weight was determined.
None of the tablets deviated from the average weight by more than + 7.5%. The weight
values were expressed in milligrams. This is an important parameter in process quality
control test to be checked frequently. Corrections were made during the compression of
tablets. Any variation in weight of tablets (for any reason) leads to either under medication in
Table 2: Weight variation specifications. Sr.no Average weight of
tablets ( mg)
Maximum % difference allowed
1 80 mg or less 10
2 80 mg to 250 mg 7.5
3 More than 250 mg 5
Friability test
Friability is the measure of tablet strength. Roche type friabilator was used for testing the
friability using the following procedure. Twenty tablets were weighed accurately and placed
in the tumbling apparatus that revolves at 25 rpm dropping the tablets through a distance of
six inches with each revolution. After 4 min the tablets were weighed and the percentage loss
in tablet weight was determined.
Initial weight of tablets – Final wt of tablets Friability % =
Initial weight of tablets
Content uniformity
The content uniformity test is used to ensure that every tablet contains the amount of drug
substance intended with little variation among tablets within a batch due to awareness of
physiological availability. The content uniformity test has been involved in the monograph of
all coated and uncoated tablets and all capsules intended for oral administration where the
range of size of the dosage form available include 50 mg or smaller size.
In vitro dissolution studies
The release rate of doxycycline hyclate delay release tablet was determined using USP
dissolution testing apparatus type II (paddle type). 900 ml of the dissolution medium (6.8 pH
phosphate buffer) was taken in covered vessel and the temperature was maintained at 37° +
0.5°. The speed of paddle was set at 100 rpm. Sampling was done at regular intervals. For
each sample 10 ml of the dissolution medium was withdrawn and same amount was replaced.
The sample was filtered and diluted with 6.8 phosphate buffer and then analyzed in UV
spectrophotometer. The absorbance was measured at 268 nm and % drug release was
calculated.
Drug content
10 tablets were weighed and powdered. Powder equivalent to50mg of doxycycline hyclate
was weighed and dissolved in 6.8 pH phosphate buffer. Different concentrations of drug were
Optimization of formulation with QbD paradigram Selection of optimized batch from above trial batches
For the optimization of formulation by qbd principle it is very important to take preliminary
batches and select optimized batch from normal evaluation test of formulation so as to it is
easy to finalize the ratio of polymers which may give better results than other ratio. Using
this final ratio in factorial design paradigm we can obtain perfect design of experiment and to
make control strategy for obtaining formulation which is more effective as possible.
Formulations were prepared by changing ratio of polymers to optimize formulation. The
hydroxyl propyl methyl cellulose k100M and ethyl cellulose concentration was maintained
from 21.62 to 64.88mg (ranges are selected from 9 trial batches).
32 Factorial design
A factorial design is used to evaluate two or more factors simultaneously. The treatments are
the combinations of levels of the factors. The advantages of factorial design over one factor at
a time experiment are that they are more efficient and they allow interactions to be detected.
Intervention studies with 2 or more categorical explanatory variables leading to a numerical
outcome variable are called as “Factorial design” Based on preliminary trails a 2 factor 3
levels full factorial design (32) by using minitab 17 was employed to design delay release
doxycycline hyclate tablet. This design was suitable for exploring quadratic response surfaces
[image:5.595.157.438.514.678.2]and analysis of variance study.
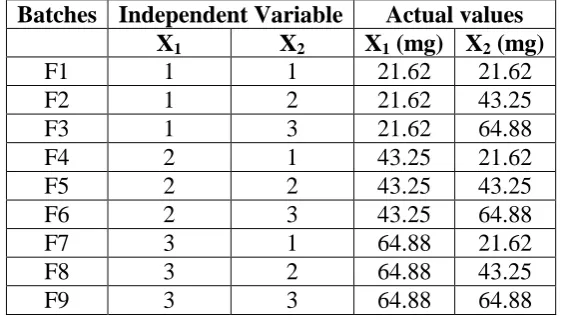
Table 3: Actual Values of Factorial Design.
Batches Independent Variable Actual values X1 X2 X1 (mg) X2 (mg)
F1 1 1 21.62 21.62
F2 1 2 21.62 43.25
F3 1 3 21.62 64.88
F4 2 1 43.25 21.62
F5 2 2 43.25 43.25
F6 2 3 43.25 64.88
F7 3 1 64.88 21.62
F8 3 2 64.88 43.25
F9 3 3 64.88 64.88
Table 4: Levels of Variables in 32 Factorial Design.
Sr. No Variable levels Low Medium High
Each factor was evaluated at three levels and experimental trials were performed. All the nine
formulations were subjected to evaluation for physical, mechanical and performance
properties. For the purpose of factorial design % cumulative drug release and content drug
were considered as dependent variables.
RESULT AND DISCUSSION Identification of drug
Determination of UV Absorption Maxima
The absorption maxima of Doxycycline hyclate (10ug/ml) in water was found to be at 268
[image:6.595.106.488.283.579.2]nm.
Figure 1: Determination of UV Absorption Maxima (λmax).
Melting Point
The melting point of Doxycycline hyclate was found to be 207.330C.
Table 5: Melting Point of Doxycycline Hyclate.
Sr.No Melting point (0C) Average (0C)
1. 206
207.33
2. 207
Preparation of calibration curve of standard plot Doxycycline hyclate
Doxycycline hyclate was accurately weighted (10mg) and dissolved in 10 ml phosphate
buffer pH 6.8 & pH 1.2 to produce a primary stock solution of 1mg/ml (1000ug/ml). The 1ml
of primary stock solution was suitably diluted with 100ml of distilled water to produce
working stock solution in concentration of 10ug/ml. From the above WSS withdraw 1ml,
2ml, 3ml, 4ml and 5ml solution in volumetric flask with continues dilution to make final
volume of 10ml for each withdrawing WSS so as to final concentration achieves was 1ug /ml
to 5ug/ml respectively. Absorbance of solution was recorded at 268 nm using double beam
spectrophotometer with water as blank. The plot of absorbance versus concentration was
plotted.
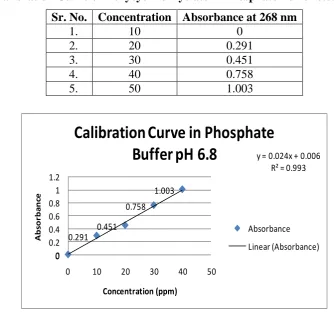
Table 1: Calibration Curve of Doxycycline Hyclate in Phosphate Buffer 6.8. Sr. No. Concentration Absorbance at 268 nm
1. 10 0
2. 20 0.291
3. 30 0.451
4. 40 0.758
5. 50 1.003
0
0.291 0.451 0.758
1.003
y = 0.024x + 0.006 R² = 0.993
0 0.2 0.4 0.6 0.8 1 1.2
0 10 20 30 40 50
A b so rb a n ce Concentration (ppm)
Calibration Curve in Phosphate
Buffer pH 6.8
Absorbance
[image:7.595.123.458.304.617.2]Linear (Absorbance)
Figure 2: Calibration Curve in Phosphate Buffer PH 6.8.
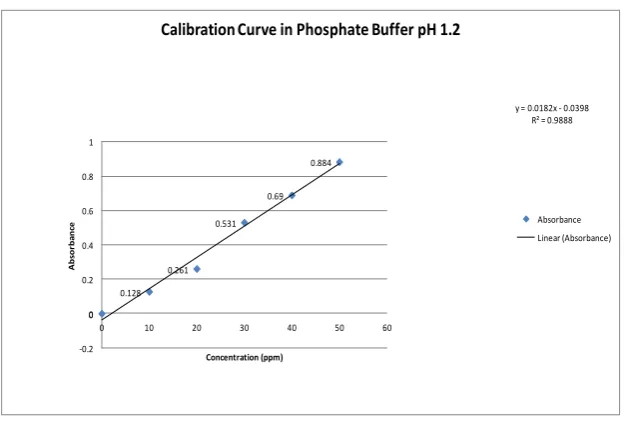
Table 7: Calibration Curve of Doxycycline Hyclate in Phosphate Buffer 1.2. Sr. No. Concentration Absorbance at 268 nm
1. 10 0.128
2. 20 0.261
3. 30 0.531
4. 40 0.69
0 0.128 0.261 0.531 0.69 0.884
y = 0.0182x - 0.0398 R² = 0.9888
-0.2 0 0.2 0.4 0.6 0.8 1
0 10 20 30 40 50 60
A bs or ba nc e Concentration (ppm)
Calibration Curve in Phosphate Buffer pH 1.2
[image:8.595.142.456.69.282.2]Absorbance Linear (Absorbance)
Figure 3: Calibration Curve in Phosphate Buffer PH 1.2.
Table 2: Physicochemical Parameter Study of all Preliminary Trial Batches.
Batches Bulk Density Tapped Density Compressibility Index Hoasner’s
Ratio Porosity
Angle of Repose
F1 2.25 3 21 1.33 25 45
F2 2.5 2.8 12.5 1.12 75 45
F3 0.26 0.32 19.1 1.23 69 36.69
F4 0.26 0.34 24 1.3 97 41.34
F5 0.26 0.33 20 1.26 68.8 38.65
F6 0.26 0.34 22.82 1.3 88.04 37.23
F7 0.24 0.30 21.21 1.25 77.77 36.5
F8 0.20 0.30 33.25 1.5 58.41 40.69
F9 0.23 0.30 21.42 1.3 68.36 40.69
From the powder characteristics i.e. angle of repose, compressibility index and hausner’s
ratio it was concluded that the powder possesses Very poor, good and Cohesive flow
characteristics.
Table 3: Post Evaluation Test of all Preliminary Trial Batches.
Batches Weight variation
Friability test
Hardness
test Thickness
% Drug Content
F1 211.5 0.14 3.4 4.33 102.22
F2 212.5 0.23 4.5 4.32 96.42
F3 210.9 0.23 4.1 4.27 101.25
F4 210.9 0.43 4.2 4.35 104.15
F5 209.8 0.19 3.2 4.29 100.28
F6 211.8 0.47 3.4 4.32 97.39
F7 209.8 0.33 3.6 4.28 99.32
F8 210 0.19 3.5 4.30 100.2
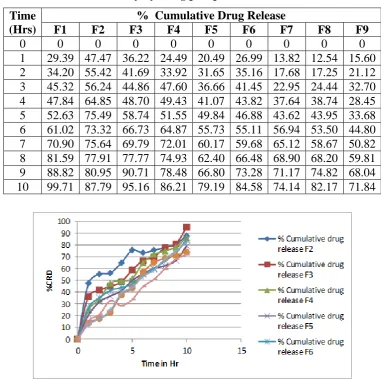
Table 4: In vitro dissolution study by using phosphate buffer 6.8. Time
(Hrs)
% Cumulative Drug Release
F1 F2 F3 F4 F5 F6 F7 F8 F9
0 0 0 0 0 0 0 0 0 0
1 29.39 47.47 36.22 24.49 20.49 26.99 13.82 12.54 15.60 2 34.20 55.42 41.69 33.92 31.65 35.16 17.68 17.25 21.12 3 45.32 56.24 44.86 47.60 36.66 41.45 22.95 24.44 32.70 4 47.84 64.85 48.70 49.43 41.07 43.82 37.64 38.74 28.45 5 52.63 75.49 58.74 51.55 49.84 46.88 43.62 43.95 33.68 6 61.02 73.32 66.73 64.87 55.73 55.11 56.94 53.50 44.80 7 70.90 75.64 69.79 72.01 60.17 59.68 65.12 58.67 50.82 8 81.59 77.91 77.77 74.93 62.40 66.48 68.90 68.20 59.81 9 88.82 80.95 90.71 78.48 66.80 73.28 71.17 74.82 68.04 10 99.71 87.79 95.16 86.21 79.19 84.58 74.14 82.17 71.84
Figure 4 In Vitro Dissolution Study Graph of All preliminary trial batches.
ANOVA
General Factorial Regression: Drug Content versus HPMC... l Cellulose.
Factor Information
Table 11: Factor Information.
Factor Level Values
HPMC K100M 3 21.62,43.25, 64.88 Ethyl Cellulose 3 21.62,43.25, 64.88
Analysis of Variance
Analysis of variance (ANOVA) (Table 23) indicated that the assumed regression model was
significant and valid for each considered response. Main effects are having significant impact
hence reduced model was taken into consideration for ANOVA analysis. Comparison of
main effects the main compression force is having a significant impact on all response
variables. Difference between adjust ss and adjust Ms value.
Table 12: Analysis of Variance.
Source DF Adj SS Adj MS F-Value P-Value
Model 8 659.96 82.49 * *
Linear 4 523.63 130.91 * *
HPMC K 100M 2 501.76 250.88 * *
Ethyl Cellulose 2 21.87 10.94 * *
2-Way Interactions 4 136.32 34.08 * *
HPMC K 100M*Ethyl Cellulose 4 136.32 34.08 * *
Error 0 * *
Total 8 659.96
Table 13: One –Way ANOVA of % CDR, Drug Content Method.
Null hypothesis All means are equal Alternative hypothesis Not all means are equal Significance level α = 0.05
Equal variances were assumed for the analysis.
Means
Factor N Mean StDev 95% CI
%CDR 9 99.968 2.415 (95.272, 104.664) Drug Content 9 84.53 9.08 (79.84, 89.23) Pooled StDev = 6.64563
Multiple Response Prediction
Variable Setting
F3 batch is
optimized one HPMC K100M
21.62 Ethyl
cellulose
64.88
Response Fit SE Fit 95% CI 95% PI
% CDR 95.16 * (*,*) (*,*)
1 2 0 7 80 0 9 1 100 2 3 3 K 100M C M P H C l y h t E ellulose
t n e t rug Con D
urface Plot of HPMC K 100M vs Ethyl Cellulose, Drug Content S
Figure 2: Surface Plot of HPMC K 100M Vs Ethyl Cellulose, Drug Content
96 9 9 0 1 2 1 2 1 5 0 1 2 3 3 M 0 0 1 K C M P H e s o l u ll e C l y h t E R D C %
urface Plot of HPMC K 100M vs Ethyl Cellulose, %CDR S
Figure 6: Surface Plot of HPMC K 100M Vs Ethyl Cellulose, % CDR.
1 2 3 96 3 99 2
1 20
1 1 50
HPMCK100M
%CDR EthylCellulose
SurfacePlotofHPMCK100MvsEthy lCellulose ,%CDR
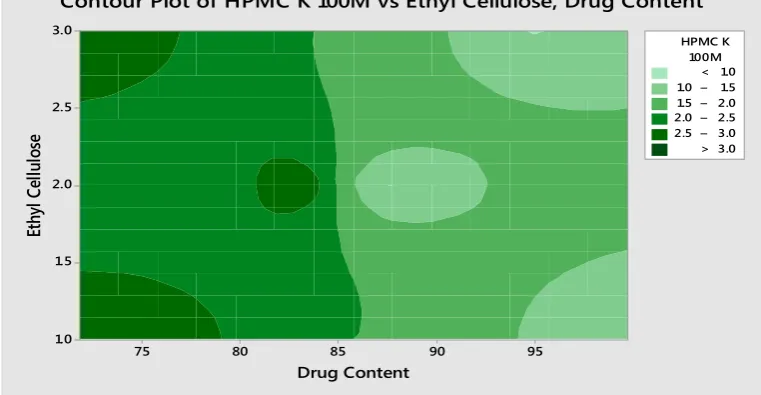
Counter plot and Response Surface Plot
The two dimensional plot obtained by contour plots are superimposed for simultaneous
optimization of the independent variables (figure 5.06). The desired values for the HPMC
K100M Vs Ethyl cellulose in %CDR were set to obtain the predicted values from the set
coded values. From the predicted values obtained by overlay of contour plots of both the
responses, the actual values were calculated and experimental trials were performed for
ensuring the proper validation of the process.
%CDR Et hy l C el lu lo se 104 103 102 101 100 99 98 97 3.0 2.5 2.0 1.5 1.0 > – – – – < 1.0
[image:12.595.108.485.232.443.2]1.0 1.5 1.5 2.0 2.0 2.5 2.5 3.0 3.0 100M HPMC K Contour Plot of HPMC K 100M vs Ethyl Cellulose, %CDR
Figure 8: Contour Plot of HPMC K 100M Vs Ethyl Cellulose, % CDR.
Drug Content Et hy l C el lu lo se 95 90 85 80 75 3.0 2.5 2.0 1.5 1.0 > – – – – < 1.0
1.0 1.5 1.5 2.0 2.0 2.5 2.5 3.0 3.0 100M HPMC K Contour Plot of HPMC K 100M vs Ethyl Cellulose, Drug Content
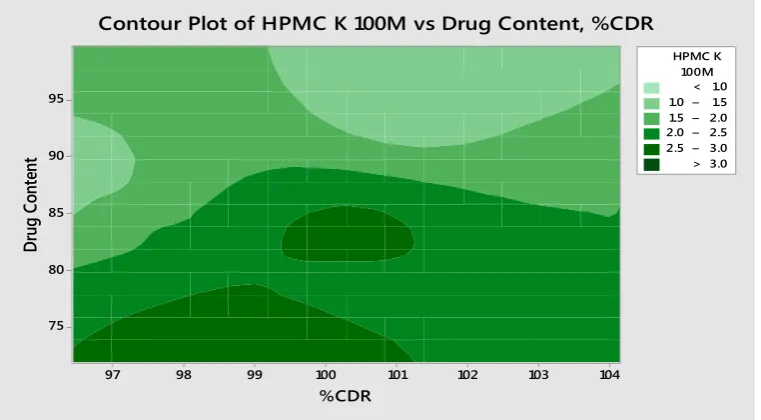
[image:12.595.106.487.501.698.2]%CDR Dr ug C on te nt 104 103 102 101 100 99 98 97 95 90 85 80 75 > – – – – < 1.0
[image:13.595.109.490.75.285.2]1.0 1.5 1.5 2.0 2.0 2.5 2.5 3.0 3.0 100M HPMC K Contour Plot of HPMC K 100M vs Drug Content, %CDR
Figure 10: Contour Plot of HPMC K 100M Vs Drug Content, % CDR.
%CDR Dr ug C on te nt 104 103 102 101 100 99 98 97 95 90 85 80 75 > – – – – < 1.0
1.0 1.5 1.5 2.0 2.0 2.5 2.5 3.0 3.0 Cellulose Ethyl
[image:13.595.110.489.323.550.2]Contour Plot of Ethyl Cellulose vs Drug Content, %CDR
Figure 11: Contour Plot of Ethyl Cellulose Vs Drug Content, %CDR
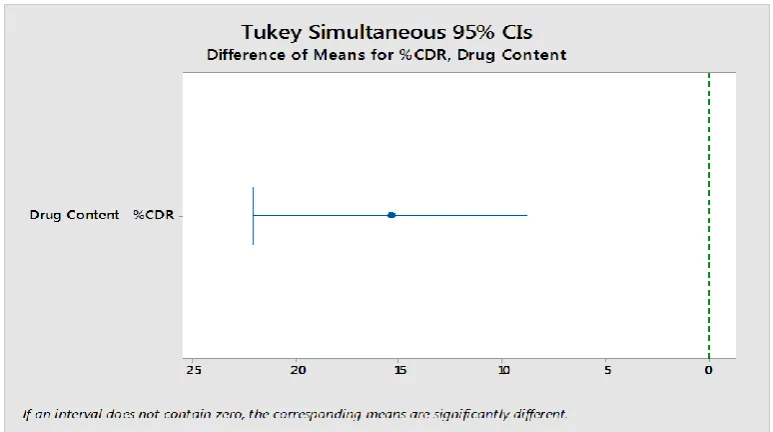
Tukey Pairwise Comparisons
Grouping Information Using the Tukey Method and 95% Confidence
Table 14: Tukey Pairwise Comparisons.
Factor N Mean Grouping
%CDR 9 99.968 A
Drug Content 9 84.53 B Means that do not share a letter are significantly different.
Figure 12: Tukey Simultaneous 95% Cls Difference of Means For %CDR, Drug Content.
Fisher Pairwise Comparison
Grouping Information Using the Fisher LSD Method and 95% Confidence
Table 15: Fisher Pairwise Comparison.
Factor N Mean Grouping
%CDR 9 99.968 A
Drug Content 9 84.53 B Means that do not share a letter are significantly different.
[image:14.595.104.491.70.286.2]Fisher Individual 95% CIs
Figure 13: Fisher Individual 95% ClsDifference of Means For %CDR, Drug Content.
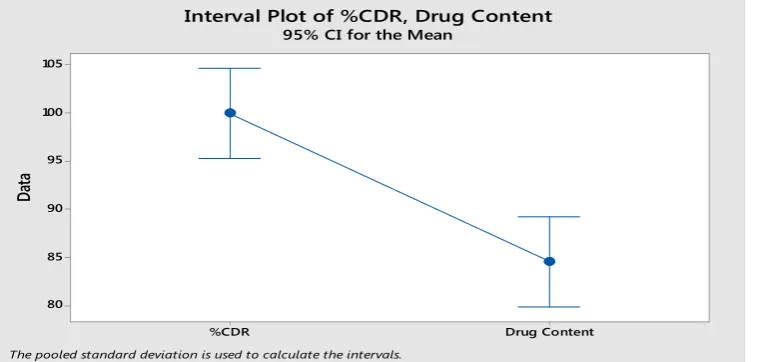
[image:14.595.108.490.525.721.2]Drug Content %CDR
105
100
95
90
85
80
Da
ta
Interval Plot of %CDR, Drug Content
95% CI for the Mean
[image:15.595.113.494.77.258.2]The pooled standard deviation is used to calculate the intervals.
Figure 14: Interval Plot of % CDR, Drug Content 95% Cls For the Mean.
Boxplot of %CDR, Drug Content
Drug Content %CDR
105
100
95
90
85
80
75
70
Da
ta
[image:15.595.108.490.323.510.2]Boxplot of %CDR, Drug Content
Figure 15: Box plot of % CDR, Drug Content.
[image:15.595.115.487.555.745.2]Residual Plots for %CDR, Drug Content
Figure 17: Residual Plots For % CDR, Drug Content.
[image:16.595.112.488.434.714.2]Selection of Optimized Batch by Dissolution study Table 5: Dissolution Study of optimized batch (F3).
Time (Hr) % Cumulative drug release
0 0
1 36.22
2 41.69
3 44.86
4 48.70
5 58.74
6 66.73
7 69.79
8 77.77
9 80.71
10 95.16
% Drug Content 101.25
Figure 19: % CDR of Finally Optimized Delay Release Doxycycline Hyclate Tablet Batch.
[image:17.595.166.442.597.734.2]IR spectrum of Drug with different Excipients
Figure 21: FTIR graph of MCC + Drug.
Figure 23: FTIR Graph of Magnesium Stearate.
Figure 25: FTIR Graph of Ethyl Cellulose + Drug.
[image:20.595.121.480.449.745.2]Figure 27: FTIR Graph of Aerosil + Drug.
[image:21.595.109.486.425.739.2]SUMMARY
Doxycycline hyclate act by broad spectrum antibacterial agent belonging to chemical class of
tetracycline derivative and use in treatment of various bacterial infection like UTI, respiratory
track infection, malaria, acne vulgaris etc. The Preformulation studies of drug and excipients
like identification test which include melting point, preparation of calibration curve by using
pH 1.2 and pH 6.8 and measurement of λ max were performed. Tablet formulation were
prepared by using various excipients and delayed release polymers and their evaluation test
are performed. Nine formulation trial batches were prepared by using Minitab 18 32 full
factorial design. In that three formulation level (High, Medium and Low) of delayed release
polymer as a factor and dissolution and drug content as an response were taken. From all nine
batches batch F3 were selected as an optimized batch because of %Cumulative drug release
and drug content were found satisfactory.
CONCLUSION
In the present study Doxycycline hyclate delayed-release tablet were prepared using HPMC
K100M and Ethyl cellulose as delayed release polymer. From the result obtained from nine
trail batches it is concluded that prepared formulation shows optimum in-vitro dissolution at
the end of 10 hours and % drug content. Formulation trial batches were prepared by using
minitab 18 32 full factorial design. In that ratio of ethyl cellulose and HPMC K100M as
delayed release polymer were selected as low, medium and high concentration and total nine
formulation batches were obtained. From all nine batches (F1 to F9), batch F3 gives
satisfactory results of % CDR(95.16%) and % drug content (101.25%) having the
concentration of 21.63 mg and 64.88 mg of HPMC K100M and Ethyl cellulose respectively
and hence batch F3 was selected as an optimized batch.
REFERENCES
1. Banker, G.S. and Anderson, N.R., Tablets in: The theory and practice of industrial
pharmacy, Lachman L, Liberman HA, Kanig JL. Varghese publishing house, 314: 324.
2. Malinowski, H.J. and Marroum, P.J., 1999. Encyclopedia of Controlled Drug Delivery,
Food and Drug Administration Requirements for Controlled Release Products/HJ
Malinowski, PJ Marroum//John Wiley & Sons, New York, 1-2: 381-395.
3. Aulton, M.E., 2002. Pharmaceutics: The Science of Dosage Form Design.: Churchill
4. Loyd. V. Allen, Ansel’s Pharmaceutical Dosage Form and Drug Delivery System,
Published by Wolters Kluwer (India), 11th edition, 236-237.
5. ICH Q8 (R2) Guideline for industry, Pharmaceutical development, www.ich.org, 2009.
6. Guidance for quality by design as an alternative approach to process validation.
7. Jayagopal, Balaji, and Murugesh Shivashankar. "Analytical Quality by Design–A
Legitimate Paradigm for Pharmaceutical Analytical Method Development and
Validation." Mechanics, Materials Science & Engineering Journal, 2017; 9.
8. Sangshetti, Jaiprakash N., et al. "Quality by design approach: regulatory need." Arabian
Journal of Chemistry, 2017; 10: S3412-S3425.
9. Bikash Kumar Nayak, Parizad Elchidana, Mudit Dixit and Pratap Kumar Sahu. QbD
Approach: Tablet Compression Process Optimization Using Design of Experiments,
May–June, 2016; 45-53.
10.Peraman, Ramalingam, Kalva Bhadraya, and Yiragamreddy Padmanabha Reddy.
"Analytical quality by design: a tool for regulatory flexibility and robust
analytics." International journal of analytical chemistry, 2015; 2015.
11.Chavda, Vivek P., and M. M. Soniwala. "Formulation development and evaluation of
delayed release enteric coated Paracetamol tablets." Pharma Tutor, 2015; 3.12: 35-39.
12.Kumar, Vemuri Pavan, and N. Vishal Gupta. "A Review on quality by design approach
(QBD) for Pharmaceuticals." International Journal of Drug Development and Research,
2015.
13.Chaudhari, Rakesh A., et al. "International Journal of Pharmacy."
14.Jadhav, Jyotsna Balasaheb, Nitin Namdeo Girawale, and Rakesh Ashok Chaudhari.
"INTERNATIONAL JOURNAL OF PURE & APPLIED BIOSCIENCE." Int. J. Pure
App. Biosci, 2014; 2.5: 214-223.
15.Nadeem, Mohd, and M. Suresh Babu. "PHARMACEUTICAL SCIENCES." Quality
Assurance, 3.4: 5.
16.Chowdary, K. P., K. Ravi Shankar, and P. Suneel Kumar. "Recent research on QbD
approach in formulation development: A review." Int. J. Chem. Sci. & Tech., 2014; 4.1:
282-92.
17.Jain, Shashank. "Quality by design (QBD): a comprehensive understanding of
implementation and challenges in pharmaceuticals development." Int. J. Pharm. Pharm.
Sci., 2014; 6: 29-35.
18.Lawrence, X. Yu, et al. "Understanding pharmaceutical quality by design." The AAPS
19.Kogawa, Ana Carolina, and HR Nunes Salgado. "Doxycycline hyclate: a review of
properties, applications and analytical methods." Int J Life Sci Pharma Res., 2012; 2.4:
11-25.
20.Damodharan, N., V. Manimaran, and B. Sravanthi. "Formulation development and
evaluation of delayed release doxycycline tablets." International Journal of Pharmacy
and Pharmaceutical Sciences, 2010; 2.1: 116-119.
21.Chavda, Vivek P., and M. M. Soniwala. "Formulation development and evaluation of