www.wjpr.net Vol 8, Issue 7, 2019. 1243
FORMULATION AND EVALUATION OF FAST DISSOLVING
TABLETS OF NISLODIPINE USING DIFFERENT
SUPERDISINTEGRANTS
B. P. Parameshwara*1, Md. Rajdar2, Dr. Mekkanti Manasa Rekha3, Dr. Rinku Mathappan4 and K. Rekha5
1
Lecturer, Department of Pharmaceutics, Gautham College of Pharmacy, R.T Nagar,
Bangalore, Karnataka, India.
2
Student (Master of Pharmacy), Department of Pharmaceutics, Gautham College of
Pharmacy, R.T Nagar, Bangalore, Karnataka, India.
3
Assistant Professor, Department of Pharmacy Practice, Gautham College of Pharmacy, R.T
Nagar, Bangalore, Karnataka, India.
4
Principal Department of Pharmacognosy, Gautham College of Pharmacy, R.T Nagar,
Bangalore, Karnataka, India.
5
Lecturer, Department of Pharmaceutics, Gautham College of Pharmacy, R.T Nagar,
Bangalore, Karnataka, India.
ABSTRACT
Hypertension (HTN) is one of the most important risks for
Cardiovascular Disease, Stroke, Myocardial Infarction and end stage of
Renal Disease. Nisoldipine is a 1,4-dihydropyridine calcium channel
blocker. It acts primarily on vascular smooth muscle cells by
stabilizing voltage gated L- type calcium channels in their inactive
conformation. By inhibiting the influx of Calcium in smooth muscle
cells. The fast dissolving drug delivery system was chosen as the route
of administration with an aim of overcoming the above mentioned
difficulties. Dysphagia in Hypertension (HTN) patients is most
commonly of infectious etiology. It is the medical term for the
symptoms of difficulty in swallowing. Considering above clinical
manifestation associated with HTN, a fast dissolving drug delivery of the proposed drug can
prove to be beneficial in treating such conditions effectively. Pre formulation studies have
confirmed purity of drug, lipophilicity and compatibility of drug with excipients used in the
Volume 8, Issue 7, 1243-1271. Research Article ISSN 2277– 7105
Article Received on 26 March 2019,
Revised on 16 April 2019, Accepted on 06 May 2019,
DOI: 10.20959/wjpr20197-14986
*Corresponding Author
B. P. Parameshwara
formulation of mouth dissolving tablets. Pre-compression studies have confirmed stability of
formulation blends for compression. Superdisintegrants viz. natural and synthetic were
screened to obtain quick disintegration time. Formulation F18 containing mango peel powder
at concentration 6% was found to have disintegration time of 18.12±0.13sec, wetting
time35.19±0.58 sec. In-vitro studies of F18 indicated 98.916% of drug release in 45 min.
Optimized formulation was found to be stable after 3 months accelerated stability studies.
Hence with the proposed method, elegant MDTs of drug could be successfully formulated
that would help improve the patient compliance.
KEYWORDS: Hypertension, Nisoldipine, Dysphagia, Mdts.
INTRODUCTION
Hypertension (HTN) is one of the most important risks for cardiovascular disease, stroke,
myocardial infarction and end stage of renal disease. The risk of cardiovascular morbidity
and mortality is directly correlated with blood pressure. The primary HTN occurs when the
condition has no known cause. It cannot be cured but it can be controlled. More than 90% of
individuals suffer from primary HTN and 10% of the patients suffer from secondary HTN.
Nisoldipine is a 1,4-dihydropyridine calcium channel blocker. It acts primarily on vascular
smooth muscle cells by stabilizing voltage gated L- type calcium channels in their inactive
conformation. By inhibiting the influx of calcium in smooth muscle cells. The fast dissolving
drug delivery system was chosen as the route of administration with an aim of overcoming
the above mentioned difficulties. Dysphagia in Hypertension (HTN) patients is most
commonly of infectious etiology. It is the medical term for the symptoms of difficulty in
swallowing. Considering above clinical manifestation associated with HTN, a fast dissolving
drug delivery of the proposed drug can prove to be beneficial in treating such conditions
effectively. Pre formulation studies have confirmed purity of drug, lipophilicity and
compatibility of drug with excipients used in the formulation of mouth dissolving tablets.
AIM: To Develop Effective Mode of Drug Delivery System to Anti-Hypertensive Drugs.
OBJECTIVES
To enhance patient compliance and adherence to therapy
To formulate fast dissolving tablet of Nisoldipine using superdisintegrants in different
concentration by direct compression method.
To carry out in-vitro evaluation of the optimized formulation.
To carryout short term stability studies of optimized formulation.
MATERIALS AND METHODS USED
Table 1: List of Chemicals used and their Sources.
Sl.No. CHEMICALS SOURCE
1 Nisoldipine Tablets
2 Mango Peel Powder Sigma Aldrich Chemicals
3 Peritol 200- SD RoquettePharma
4 Sacchrine S D Fine Chemical Ltd
5 Talc S D Fine Chemical Ltd
6 Vanilla Himedia
7 SLS S D Fine Chemical Ltd
8 Aerosil Titan Biotech Ltd. Bhiwadi
9 Distilled Water Indian Chemical Company
10 Methanol S D Fine Chemical Ltd
11 NaOH S D Fine Chemical Ltd
12 Potassuim Dihydrogenortho phosphate Thomas Baker
13 n-Octanol Thomas Baaker
Table 2: List of Instruments and Equipments used.
Sl. No. INSTRUMENTS SOURCE
1 Weighing balance Shimadzu ELB 300
2 UV 1700 Spectrophotometer Shimadzu, Japan
3 pH meter MicroproGradmate
4 FTIR Shimadzu 8700 Shimadzu, Japan
5 Sonicator Enertech Electronics Pvt Ltd
6 Orbital Shaker Scigenics Biotech Pvt Ltd
7 Tablet Punching Machnine Rimek Mini-Press- 11 SF
8 Hardness Tester Monsanto tester
9 Friability Electrolab
10 Dissolution Apparatus Electrolab 11 Disintegration Apparatus Electrolab
EXPERIMENTAL METHODOLOGY
Experimental methodology can be divided into three sections as:
Preformulations studies
Formulation Development
Evaluation
PREFORMULATION STUDIES
The powdered sample was intimately mixed with dry powdered potassium bromide. The
mixture was then compressed into transparent disc under high pressure using special dies.
The disc was placed in IR spectrophotometer using sample holder and spectrum was recorded
from 4000 to 500 cm-1.
Estimation of Nisoldipine by UV method-Estimation of Nisoldipine by UV-Spectrophotometric method: A Shimadzu UV-1700 double beam UV-Visible spectrophotometer with software of UV-probe was used for all measurements. The absorption
spectra were recorded over the wavelength range of 400 - 200 nm, against a solvent blank, in
quartz cuvettes with a width of 1cm. For all solutions, the spectra were obtained over 400 -
200 nm range in triplicate. The linearity of the calibration curves and the adherence of the
method to Beer’s law are validated by the high value of the correlation coefficient.
Preparation of standard stock solution: About 100 mg of Nisoldipine (pure) was accurately weighed and dissolved in 30 mL ethanol. The solution was sonicated for 30
minutes. The solution was filtered through Whatman filter paper, volume of the filtrate made
up to 100 mL with ethanol (1 mg/mL). 10 mL of the stock solution was diluted to 100mL
with ethanol. Aliquots of 0.4 -2.0 mL of the diluted solution was further diluted to 10 mL
with ethanol and the absorbance was measured at 237 nm using ethanol as blank and area
under curve was measured between 232- 237 nm.
λmax of pure Nisoldipine: For the selection of analytical wavelength 10 μg/mL solution of Nisoldipine was prepared by appropriate dilution of standard stock and scanned using UV
spectrophotometer.in the spectrum mode from 200nmto 400nm.
Standard Calibration curve: From the standard stock solution, 1ml was taken into a 10mL volumetric flask and made up to 10mL with distilled water to get concentration of 100
μg/mL. From the above working standard solution aliquots of 0.2, 0.4, 0.6, 0.8, 1.0 1.2, 1.4,
1.6, 1.8 and 2.0mL were taken into different 10mL volumetric flasks and diluted up to mark
with distilled water to get the concentration from 2–20μg/mL and the calibration curve was
prepared in concentration range of 2- 20 μg/mL.
Intra - day variability: Precision studies were carried out to ascertain the reproducibility of proposed method. Intra –day precision study was carried out by preparing drug solution of
Nisoldipine in each replicate was calculated. The standard deviation was calculated from the
concentration of Nisoldipine. The result reported as percent relative standard deviation (%
RSD). For a good reproducibility % RSD should be ≤ 3.
Inter - day variability: Inter-day studies were carried out by preparing drug solution of same concentration and measured the absorbance for three different days to determine inter-day
precision. The results were reported as % RSD. For a good reproducibility % RSD should be
≤ 3.
Partition Coefficient: Partition Coefficient was determined in n-octanol-water using flask shake method. Equal volumes of n-octanol and water (10 mL) were taken in separating
funnel and shaken for 1 hour. To this known amount of Nisoldipine was added. The funnel
was equilibrated for 2 hrs at constant temperature with intermittent shaking at regular
intervals. Then, the aqueous and n-octanol layers were allowed to separate. From the aqueous
layer 1 mL solution was pipetted and assayed by UV at appropriate wavelength after dilution
with methanol. Organic layer was evaporated to dryness in a china dish and the residue was
diluted up to 10 mL with methanol and was analyzed spectrophotometrically against the
blank.
The partition co-efficient is calculated using the following equation:
In-vitro Permeation Studies of Nisoldipine: Permeation studies of the pure drug was carried out using cellophane membrane (soaked in 0.1M HCl for 10 hr). The modified Franz
diffusion cell assembly was used. Throughout the study the whole assembly was kept at 37°C
±2°C. The medium in the donor compartment was drug solution dissolved in pH 6.8
phosphate buffer solution, and the medium used in acceptor compartment was pH 7.8 buffer
solution, which was continuously stirring by placing on a magnetic stirrer. The samples were
withdrawn at predetermined, regular time intervals and an equal amount of fresh medium was
replaced. Amount of drug in the withdrawn samples was determined spectrophotometrically.
Permeability co-efficient is defined as the volume of an incompressible fluid that flows in
unit time through a unit cube of a porous substance across which a unit pressure difference is
maintained. Permeability Co-efficient is calculated by Potts-guy equation:
Solubility studies of pure Drug in Different Solvents: Solubility measurements were performed using method reported by Higuchi and Connors. An excess amount of Nisoldipine
was added to each of 25 ml of water, pH 1.2, pH 6.8 and pH 7.4 buffer respectively in Schott
Durran bottles. The bottles were placed in holder and shaken for 24hrs at room temperature in
water bath shaker. The samples were filtered through Whatmann filter paper No.1. The
filtrate was suitably diluted and analyzed spectrophotometrically against blank at appropriate
wavelength.
Drug-Excipients compatibility study: Assessment of possible incompatibilities between an active drug substance and different excipients forms an important part of the preformulation
stage during the development of dosage form.
FT-IR Compatibility studies: The study of pure drug and physical mixture of drug and excipients IR spectrum were carried out using Shimadzu FTIR-8700 spectrophotometer.
Potassium bromide disc method was employed and spectrum was recorded from 4000 to 500
cm-1
FORMULATION OF MTDs
Formulation of Mouth dissolving Tablets (MDTs) Of Nisoldipineby Using Synthetic Superdisintegrants: Before the formulation of tablets, the best synthetic super disintegrant among sodium starch glycolate (SSG), Kyron T-314 and croscarmellose sodium (CCS) at
different concentration was screened out. After selecting a suitable super disintegrant using
perlitol-200 SD as a diluent, which will provide soothing effect as well as comply with
MDT’s properties.
Table 3: Formulation of MDTs using synthetic Super disintegrants.
SI.No.
SCREENING STAGE
INGREDIEN-TS FORMULATION CODE
F1 F2 F3 F4 F5 F6 F7 F8 F9
1 Nisoldipine (mg) 8.5 8.5 8.5 8.5 8.5 8.5 8.5 8.5 8.5
2 Crosscarmellose (mg) 6 8 10
3 Sodium starch Glycolate (mg) 6 8 10
4 Kyron T-314(mg) 6 8 10
5 Aerosil (mg) 5 5 5 5 5 5 5 5 5
6 SLS (mg) 2 2 2 2 2 2 2 2 2
7 Perlitol-200 SD (mg) 175.8 172.8 170.8 173.8 172.8 170.8 174.8 172.8 170.8
8 Talc (mg) 0.2 0.2 0.2 0.2 0.2 0.2 0.2 0.2 0.2
9 Saccharin (mg) 2 2 2 2 2 2 2 2 2
Formulation of Mouth Dissolving Tablet (MDTs) Of Nisoldipineby Using Natural super disintegrants: Before the formulation of tablets, the best natural super disintegrants among mango powder, banana powder, and guar gum at different concentration was screened out.
After selecting a suitable super disintegrants using Perlitil-200SD as a diluent, which will
provide soothing effect as well as comply with MDT’s properties. The best natural super
disintegrants were then used to prepare final formulation.
Table 4: Formulation of MDTs using natural Superdisintegrants.
SI. No.
SCREENING STAGE
INGREDIENTS FORMULATION CODE
F10 F11 F12 F13 F14 F15 F16 F17 F18
1 Nisoldipine (mg) 8.5 8.5 8.5 8.5 8.5 8.5 8.5 8.5 8.5
2 Guar gum (mg) 4 8 12
3 Banana powder (mg) 4 8 12
4 Mango peel pectin (mg) 4 8 12
5 Aerosil (mg) 5 5 5 5 5 5 5 5 5
6 SLS (mg) 2 2 2 2 2 2 2 2 2
7 Perlitol-200 SD 175.8 171.8 167.8 175.8 171.8 167.8 175.8 171.8 167.8
8 Talc (mg) 0.2 0.2 0.2 0.2 0.2 0.2 0.2 0.2 0.2
9 Saccharin (mg) 2 2 2 2 2 2 2 2 2
10 Vanilla (mg) 1 1 1 1 1 1 1 1 1
PRE-COMPRESSION EVALUATION
Bulk density (ρb) and tapped density: It is the ratio of total mass of powder and the bulk volume of powder. It was determined by the commonly used method, where accurately
weighed quantity of the blended mixture (10gm) was carefully poured into the graduated
cylinder and the bulk volume was recorded with and without tapping. The untapped (Du) and
tapped bulk densities (Dt) were calculated from the following formula, weight of blended
mixture/ untapped volume and weight / tapped volume, respectively. It is expressed in gm/ml.
Carr’s index (I) or Percentage compressibility: An important measure that can be obtained from bulk density is the determination of percent compressibility or Carr’s index, which is
defined as: , Where, Dt is the tapped bulk density of the powder and Du is the untapped bulk density of the powder. In theory, a blended mixture having an ‘I’ value of less
than 25% is defined to have more free flowing property and good compressibility.
settled bulk density of the powder, and Dtis the tapped density of the powder. The Hausner
ratio is used as an indication of the flowability of a powder. A Hausner ratio greater than 1.25
is considered to be an indication of poor flowability.
Angle of Repose: It may be defined as the maximum angle possible between the surface of the pile of the powder and horizontal plane. Fixed funnel method was used. A funnel was
fixed with its tip at a given height h above a flat horizontal surface to which a graph paper
was placed. The granules were carefully poured through a funnel till the apex of the conical
pile just touches the tip of the funnel. Value of θ are rarely less than 20° and values up to 40°
indicates good flow potential. The angle of repose was then calculated using the formula.
Where, θ= Angle of Repose, h= Height of Pile (cm), r = Radius of the base of the pile (cm).
TABLET COMPRESSION: Following the evaluation of the powder blend, the powder was compressed using a Rimek Tablet punching machine. The drug-excipients mixture was then
punched using 8 mm single-punch machine to produce convex-faced tablets weighing 200
mg each. The composition of different batches and optimization stages with formulation
codes from F1 to F18 is shown in the Table-11 and Table-12. Compressed tablets were
further subjected to post compression evaluation.
POST COMPRESSION EVALUATION
Hardness test: The Monsanto hardness tester was used which consists of a barrel containing a compressible spring held between two plungers. The lower plunger is placed in contact with
the tablet, and zero reading is taken. The upper plunger is then forced against a spring by
turning threaded bolt until the tablet breaks. As the spring is compressed, a pointer rides
along a gauge in the barrel to indicate the force. The force of break is recorded and zero force
reading is deducted from it.
Friability: Tablets were tested for friability using Electrolab (EF2) Friabilator. Twenty tablets were weighed initially and transferred to the friabilator. The instrument was set to 25
rpm for 100 rotations. The resulting tablets were reweighed and percentage loss was
calculated using the formula:
Method: Wetting time of tablet was determined using a simple procedure. A piece of double folded tissue paper was placed in a petri dish containing 6 mL of water. The tablet was placed
on the paper and the time for complete wetting of upper surface of the tablet was measured in
seconds.
In-vitro Disintegration test: The in vitro disintegration time was determined using Electro lab- USP Disintegration apparatus. The limit for disintegration should not be more than 60
seconds at 37°C.
Method: Six tablets were placed individually in each tube of disintegration test apparatus and discs were placed on it. The disintegration time was determined in simulated salivary fluid
(pH 6.8) with temperature maintained constant at 37°C ± 1°C.
Drug content: Three tablets were weighed and powdered. Powder equivalent to 10 mg of Nisoldipine was dissolved in 25ml of 0.1 N HCl filtered and the filtrate was suitably diluted
with methanol. The samples were analyzed by UV at appropriate wavelength.
In-vitro dissolution studies
Dissolution medium : Simulated gastric fluid (pH1.2)
Dissolution volume : 900mL
Dissolution apparatus Type : Type II (paddle method)
RPM : 75 RPM
Temperature : 37°C ± 0.5°C
Samples withdrawn : 5ml
Dissolution was carried out for 1hr. Initially samples were withdrawn at 2 min interval for
first 10 minutes. Further the samples were withdrawn at 15th, 20th, 25th, 30th, and 45th
minute. At each interval 5mL of samples were withdrawn and filtered through Whatman filter
paper No. 1, the initial volume of dissolution medium was maintained by adding 5mL of
fresh dissolution medium. From the 5mL withdrawn sample, 1mL was taken and volume was
made up to 10mL with 6.8 pH phosphate buffer and analyzed using by UV-Visible
spectrophotometer. From absorbance values, percent drug dissolved at various time intervals
was determined.
test if not more than two tablets are outside the percentage limit and none of the tablet differs
by more than two times the percentage limit. The weight variation tolerance for uncoated
tablets differs depending on average weight of the tablets.
Drug Release Kinetic Studies: In order to analyse the drug release mechanism, in-vitro
release data for the optimized formulation F18 were fitted into zero order, first order, Higuchi
matrix, Hixson-Crowell cube root law and Kormeyers-Peppas model.
Stability studies: Stability of a drug can be defined as the time from the date of manufacture and the packaging of the formulation, until its chemical or biological activity is not less than
a predetermined level of labelled potency and its physical characteristics have not changed
appreciably or deleteriously. The purpose of stability testing is to provide evidence on how
the quality of a drug substance or drug product varies with time under the influence of a
variety of environmental factors such as temperature, humidity and light, enabling
recommended storage conditions, re-test periods and shelf lives.
Method: The final formulation (tablets) were filled in screw capped, labeled bottles and stored for 3 months at 40°C ± 2°C/75% RH ± 5% RH. The tablets were evaluated for any
changes in the physical characteristic, friability, in-vitro drug release studies and drug
content.
RESULTS
PREFORMULTION STUDY OF MODEL DRUG
[image:10.595.132.460.568.749.2]Description: The drug was yellow, crystalline and odourless powder.
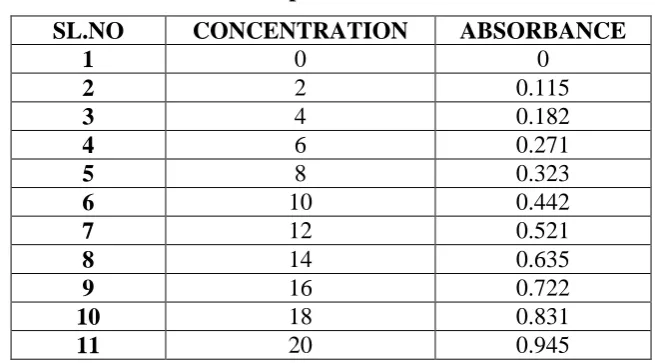
Table No 5: Standard calibration curve plot data of in Ethanol.
SL.NO CONCENTRATION ABSORBANCE
1 0 0
2 2 0.115
3 4 0.182
4 6 0.271
5 8 0.323
6 10 0.442
7 12 0.521
8 14 0.635
9 16 0.722
10 18 0.831
Fig No 1: Standard curve of drug in Ethanol.
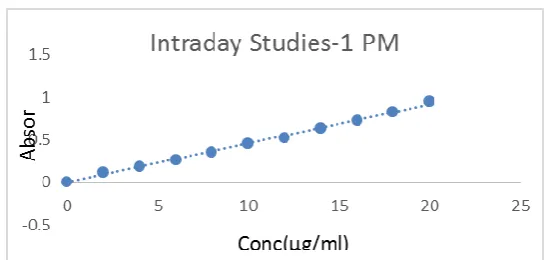
Table No 6: Intra-Day Variability of Nisoldipine. Absorbance
Sl.No Conc Abs-1(10am) Abs-2(1Pm) Abs-3(4Pm) Avg %SD
1 0 0 0 0 0 0
2 2 0.107 0.117 0.123 0.1157 0.0081
3 4 0.172 0.189 0.197 0.1860 0.0128
4 6 0.248 0.267 0.282 0.2657 0.0170
5 8 0.348 0.354 0.345 0.3490 0.0046
6 10 0.441 0.458 0.469 0.4560 0.0141
7 12 0.528 0.523 0.532 0.5277 0.0045
8 14 0.625 0.637 0.648 0.6367 0.0115
9 16 0.71 0.722 0.736 0.7227 0.0130
10 18 0.822 0.831 0.843 0.8320 0.0105
11 20 0.923 0.954 0.961 0.9460 0.0202
Fig no 3: Intra-day variability studies of Nisoldipine (Reading 2).
Fig no 4: Intra-day variability studies of Nisoldipine (Reading 3).
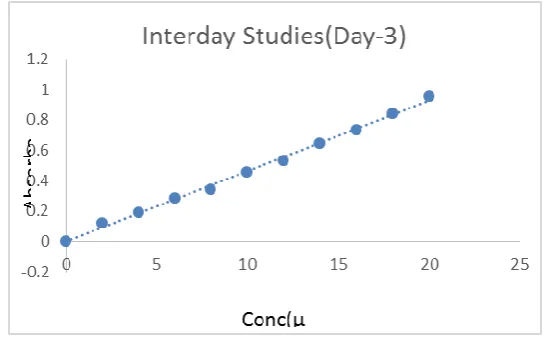
Table No 7: Inter-Day Variability of Nisoldipine. Absorbance
Sl.no Conc Abs(Day-1) Abs(Day-2) Abs(Day-3) Avg %SD
1 0 0 0 0 0 0
2 2 0.102 0.115 0.119 0.1120 0.0089
3 4 0.161 0.182 0.187 0.1767 0.0138
4 6 0.234 0.271 0.286 0.2637 0.0268
5 8 0.323 0.323 0.338 0.3280 0.0087
6 10 0.421 0.442 0.456 0.4397 0.0176
7 12 0.517 0.521 0.532 0.5233 0.0078
8 14 0.614 0.635 0.643 0.6307 0.0150
9 16 0.702 0.722 0.732 0.7187 0.0153
10 18 0.817 0.83 0.842 0.8297 0.0125
Fig 5: Inter-day variability studies of Nisoldipine (Day 1).
Fig 6: Inter-day variability studies of Nisoldipine (Day 2).
Fig no 7: Inter-day variability studies of Nisoldipine (Day 3).
[image:13.595.160.437.477.647.2]In-Vitro PermeationStudies of Nisoldipine
Table 8: In-vitro permeation studies data of Nisoldipine.
Time (hrs) %CPR %CPR %CPR AVG±SD
0 0 0 0 0
1 3.261 3.262 3.261 3.261±0.000577
2 9.880 9.880 9.870 9.877±0.005774
3 15.174 15.174 15.175 15.174±0.000577
4 20.085 20.585 20.085 20.251±0.288675
5 25.589 25.589 25.689 25.622±0.057735
6 40.965 40.965 40.665 40.765±0.173205
7 55.396 55.396 55.410 55.400±0.008033
8 69.742 69.742 69.741 69.742±0.000577
9 81.004 81.004 81.204 81.071±0.11547
24 98.957 98.957 98.896 98.196±0.035143
Fig no 8: Permeability Study of Nisoldipine.
Permeability coefficient: The permeability co-efficient of pure Nisoldipine was found to be -3.1, calculated by Potts-guy equation: Log Kp = -2.7+0.71×log K o/w -0.0061×mol.wt.
Where, Log K o/w = 0.342, Mol. wt= 441.36g/mol.
Log Kp = -2.7+0.71×0.342-0.0061×441.36
Solubility: Drug was soluble in ethanol. The solubility of the drug was also examined in various buffers. The results are shown in Table. 10.
Table No 9: Solubility of Drug.
Sl. No. Solvent Solubility (mg/ml)
1. Purified water 5.5
2. pH 1.2 buffer 37.9
3. pH 3.0 Acetate buffer 9.7
4. pH 4.5 Acetate buffer 6.0
5. pH 6.8 phosphate buffer 13.0
6. pH 7.2 phosphate buffer 20.2
Fig No 9: Solubility of Drug Sample.
Fourier Transform Infrared Spectroscopy (FT-IR) study for model drug: The IR spectrum of model CCB drug and confirms the presence of the characteristic functional
[image:15.595.136.463.495.610.2]groups was in good agreement with the literature findings.
Table No 10: FT-IR spectrum data.
Functional groups IR Absorption Band (cm -1
) (observed)
N-H Stretching 3350 cm-1
C-H Stretching(Aromatic) 2800 cm-1
C-H Stretching(Aliphatic) 3250 cm-1
NO2 Stretching 1531 cm-1
C=C Stretching(Aromatic) 1493 cm-1
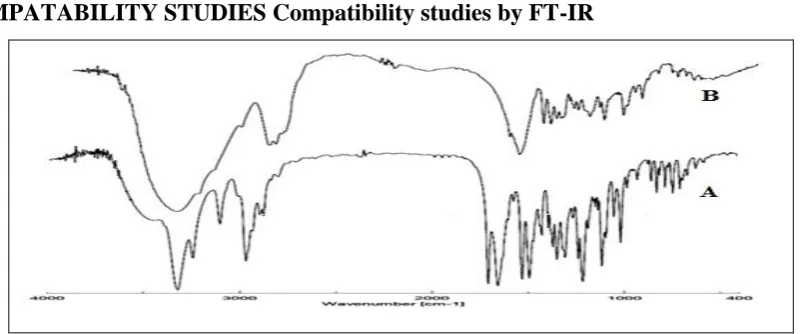
COMPATABILITY STUDIES Compatibility studies by FT-IR
Fig No 10: FTIR Spectrum of API (A) and API + Excipients (B).
FORMULATION OF MTD
Formulation of Mouth dissolving Tablets (MDTs) Of Nisoldipine by using different
Synthetic and natural Superdisintegrants is done. All the raw materials were passed through a
#40sieve prior to mixing. Drug and the superdisintegrants(Sodium Starch
Glycolate/Croscarmellose Sodium/ Kyron T-314), saccharin, (1%) vanilla flavour and
Pearlitol SD 200 (as much as required) were blended. The powder blend was lubricated with
0.1% Talc and 1% SLS. The powder blend was mixed properly and subjected for
pre-compression evaluation parameters.
PRE-COMPRESSION EVALUATION
Table no 11: Evaluation of the powder blend of MDTs of Nisoldipine with Synthetic superdisintegrants.
SI no.
Evaluated
parameters F1 F2 F3 F4 F5 F6 F7 F8 F9
1 Untapped density* (g/mL) ± S.D
0.544± 0.001 0.537± 0.001 0.536± 0.001 0.468± 0.001 0.468± 0.002 0.463± 0.001 0.462± 0.001 0.412± 0.002 0.408± 0.001
2 Tapped density* (g/mL) ± S.D
0.576± 0.004 0.566± 0.005 0.568± 0.005 0.530± 0.004 0.529± 0.004 0.530± 0.006 0.440± 0.007 0.439± 0.006 0.437± 0.006
3 % Compressibility* ± S.D 12.76± 0.419 12.36± 0.426 11.25± 0.526 12.18± 0.450 12.67± 0.425 12.63± 0.550 11.65± 0.236 12.89± 0.289 11.99± 0.415
4 Hausner’s ratio*±S.D 1.136± 0.01 1.145± 0.04 1.114± 0.06 1.144± 0.07 1.145± 0.02 1.069± 0.02 1.083± 0.05 1.062± 0.03 1.058± 0.06
[image:16.595.4.596.521.681.2]Screening of Natural Superdisintegrants
Table no 12: Evaluation of the powder blend of MDTs of Nisoldipine with natural superdisintegrants.
SI no.
Evaluated
parameters F10 F11 F12 F13 F14 F15 F16 F17 F18
1 Untapped density* (g/mL) ± S.D
0.545± 0.001 0.527± 0.001 0.586± 0.001 0.463± 0.001 0.462± 0.002 0.423± 0.001 0.452± 0.001 0.452± 0.002 0.438± 0.001
2 Tapped density* (g/mL) ± S.D
0.676± 0.004 0.666± 0.005 0.518± 0.005 0.520± 0.004 0.529± 0.004 0.510± 0.006 0.540± 0.007 0.459± 0.006 0.447± 0.006
3 % Compressibility*± S.D 12.86± 0.419 12.26± 0.426 11.15± 0.526 12.38± 0.450 12.57± 0.425 12.53± 0.550 11.25± 0.236 12.39± 0.289 12.99± 0.415
4 Hausner’s ratio*±S.D 1.126±
0.01 1.545± 0.04 1.154± 0.06 1.144± 0.07 1.145± 0.02 1.059± 0.02 1.013± 0.05 1.002± 0.03 1.018± 0.06
5 Angle of Repose* ±SD 26.21±
0.278 26.06± 0.287 25.23± 0.184 25.59± 0.148 27.46± 0.294 26.49± 0.318 27.52± 0.298 26.90± 0.283 27.45± 0.243 TABLET COMPRESSION
The optimization of superdisintegrants is done by direct compressiontechnique in order to
study the effect of the different concentrations of synthetic superdisintegrants (Sodium Starch
Glycolate, KyronT-314, and Croscarmellose Sodium) and natural superdisintegrants (Mango
peel powder, Banana powder, Guar gum) on thedisintegration time, wetting time, and percent
of friability.
[image:17.595.21.572.134.305.2]POST COMPRESSION EVALUATION
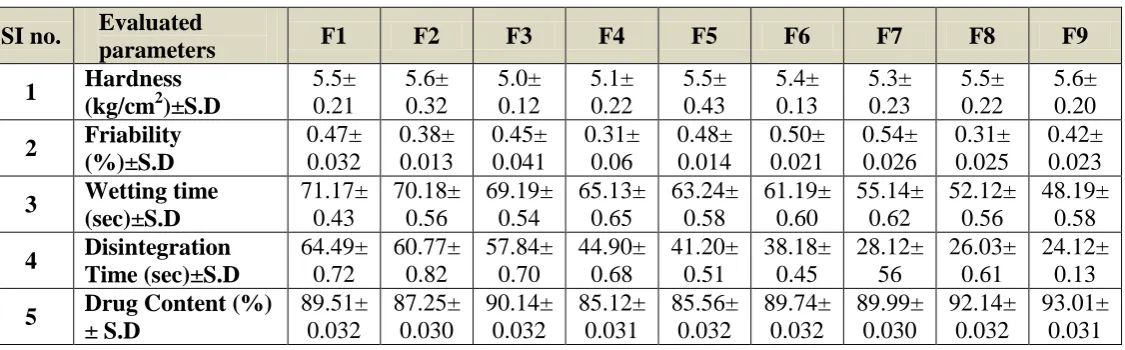
Table 13: Evaluation of the MDTs of Nisoldipine with Synthetic superdisintegrants.
SI no. Evaluated
parameters F1 F2 F3 F4 F5 F6 F7 F8 F9
1 Hardness (kg/cm2)±S.D
5.5± 0.21 5.6± 0.32 5.0± 0.12 5.1± 0.22 5.5± 0.43 5.4± 0.13 5.3± 0.23 5.5± 0.22 5.6± 0.20
2 Friability (%)±S.D 0.47± 0.032 0.38± 0.013 0.45± 0.041 0.31± 0.06 0.48± 0.014 0.50± 0.021 0.54± 0.026 0.31± 0.025 0.42± 0.023
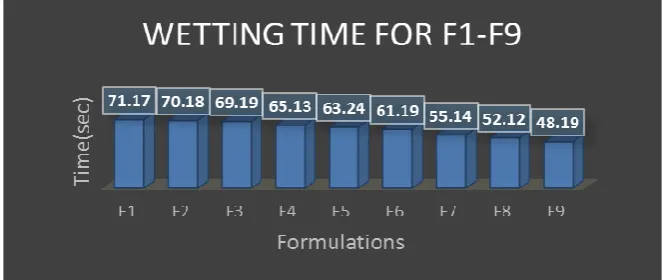
3 Wetting time (sec)±S.D 71.17± 0.43 70.18± 0.56 69.19± 0.54 65.13± 0.65 63.24± 0.58 61.19± 0.60 55.14± 0.62 52.12± 0.56 48.19± 0.58
4 Disintegration Time (sec)±S.D 64.49± 0.72 60.77± 0.82 57.84± 0.70 44.90± 0.68 41.20± 0.51 38.18± 0.45 28.12± 56 26.03± 0.61 24.12± 0.13
[image:17.595.20.583.493.668.2]FIG no 11: Graphical representation of wetting time for F1-F9.
FIG no 12: Graphical representation of disintegration time for F1-F9.
Table 14: Evaluation of the MDTs of Nisoldipine with natural superdisintegrants. SI
no.
Evaluated
parameters F10 F11 F12 F13 F14 F15 F16 F17 F18
1 Hardness (kg/cm2)±S.D
5.5± 0.21 5.6± 0.32 5.5± 0.12 5.1± 0.22 5.5± 0.43 5.4± 0.13 4.3± 0.23 4.5± 0.22 4.6± 0.20
2 Friability (%)±S.D 0.46± 0.032 0.48± 0.013 0.55± 0.041 0.31± 0.06 0.48± 0.014 0.50± 0.021 0.44± 0.026 0.31± 0.025 0.42± 0.023
3 Wetting time (sec)±S.D 74.14± 0.43 73.18± 0.56 71.19± 0.54 75.13± 0.65 71.24± 0.58 68.19± 0.60 38.14± 0.62 36.12± 0.56 35.19± 0.58
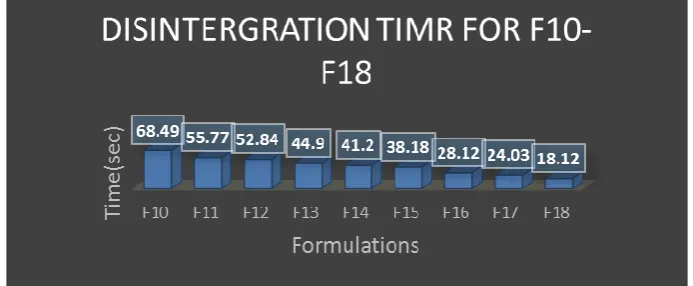
4 Disintegration Time (sec)±S.D 68.49± 0.72 55.77± 0.82 52.84± 0.70 44.90± 0.68 41.20± 0.51 38.18± 0.45 28.12± 56 24.03± 0.61 18.12± 0.13
[image:18.595.16.582.459.632.2]FIG 13: Graphical representation of wetting time for F10-F18.
FIG no 14: Graphical representation of disintegration time for F10-F8.
In-vitro Drug Release Studies
Table 15: In-vitro Drug Release of the MDTs of Nisoldipine with Synthetic superdisintegrants.
TIME(min) F1 F2 F3 F4 F5 F6 F7 F8 F9
0 0 0 0 0 0 0 0 0 0
[image:19.595.77.522.546.723.2]Table 16: In-vitro Drug Release of the MDTs of Nisoldipine with natural superdisintegrants.
TIME(min) F10 F11 F12 F13 F14 F15 F16 F17 F18
0 0 0 0 0 0 0 0 0 0
2 48.96 47.47 47.07 30.76 31.96 35.76 40.99 40.13 43.05
4 59.36 58.73 58.03 45.77 44.76 54.12 59.16 58.13 60.898
6 67.59 66.49 66.19 48.18 47.18 63.58 71.45 70.16 76.881
8 67.49 67.99 66.01 51.14 53.18 65.12 77.16 79.16 84.902
10 75.18 76.18 75.86 56.73 57.23 66.58 86.12 88.19 90.892
15 80.91 81.67 80.17 58.17 58.99 69.13 89.66 90.17 92.921
20 82.75 83.17 82.73 61.93 63.47 70.16 90.16 91.18 96.882
25 85.71 84.79 84.18 65.73 66.76 71.64 91.01 92.66 98.86
30 87.71 87.49 85.73 67.14 69.76 72.05 92.11 94.67 98.912
[image:20.595.18.576.115.567.2]45 88.12 89.01 89.89 70.18 71.73 73.66 92.86 95.64 98.916
FIG no 15: In-vitro release study of F1-F9.
[image:20.595.99.498.548.745.2]FIG no 17: In-vitro release study for F18.
FIG no 18: In-vitro release study for F18.
Weight Variation: 20 tablets
Table no 17: Evaluation of weight variation of 20 tablet.
SI No. Weight of Tablet
(mg) (A) Mean (Y) (A-Y) % Deviation
1 201
201.05
0.05 0.024
2 202 0.95 0.472
3 200 1.05 0.522
4 203 1.95 0.969
5 203 1.95 0.969
6 200 1.05 0.522
7 201 0.05 0.024
8 200 1.05 0.522
9 200 1.05 0.522
10 202 0.95 0.472
12 201 0.05 0.024
13 200 1.05 0.522
14 203 1.95 0.969
15 203 1.95 0.969
16 200 1.95 0.522
17 201 1.05 0.024
18 203 0.05 0.969
19 203 1.95 0.969
20 200 1.05 0.522
DRUG RELEASE KINETICS DATA ANALYSIS
The percentage release data of optimized formulation F18 is subjected to mathematical
[image:22.595.103.497.70.203.2]modeling.
FIG 19: Zero order model for F18.
[image:22.595.131.464.289.480.2]FIG no 21: Higuchi model for F18.
FIGno 22: Korsmeyer Peppas Model.
[image:23.595.109.491.465.715.2]Table 18: Drug Release kinetics.
R2 value Zero order
First order
Higuchi model
Hixon crowell
Korsmeyer peppas model
Best fit model
F18 0.4694 0.2239 0.852 0.7407 0.5584 Higuchi
model
Short Term Stability Studies Table 19: Short term stability.
Sl.no Formulation F18 0 month ± SD 1 Month ± SD
1 Physical Appearance
White to off- white, Oval shape tablet.
White to off- white, Oval shape tablet.
2 Drug Content (%) 95.65 ±0.031 95.59±0.031
3 CPR (%) at 20 min. 96.882 ±0.0020 96.882 ±0.0020 4 CPR (%) 45 min. 98.916 ±0.0058 98.916 ±0.0058
DISCUSSION AND CONCLUSION
FAST DISSOLVING DRUG DELIVERY SYSTEMS: These dosage forms have achieved a prominent acceptance as an important novel method for administering commonly used
drugs. Recent market studies indicate that more than half of the patient population prefers
ODTs to other dosage forms and most consumers would request their doctors for prescription
of ODTs (70%), purchase ODTs (70%), or prefer ODTs over regular tablets or liquids
(>80%) pointing towards the increasing demand of ODT’s over the conventional forms.
These responses to a great extent can be attributed to known ODT advantages such as
convenient dosing, ease of administration, pleasant taste and mouth feel and the availability
of several flavors. In addition, several business needs are driving ODT technology
development which primarily focuses on the commercialization of new products such as the
need for expansion of the product lines, improved life-cycle management, extended patent
life and marketing edge over the prevalent competitors.
SELECTION OF DRUG: Nisoldipine is a 1,4- dihydropyridine calcium channel blocker. Commercially it is available in the form of oral tablets, controlled release, Nanoaerosol, Solid
dispersions. This work aimed to formulate Nisoldipine as Fast dissolving tabletsoral tablets to
improve the patient compliance. The Fast dissolving tablets property could help in the
management of hypertension.
PREFORMULATION STUDIES: Pre formulation studies of pure Nisoldipine were carried out by performing various parameters viz. determining the solubility profile, plotting standard
Identification of drug by FT-IR: FTIR studies of pure drug, and pure drug-excipients physical mixture were carried out to see possible interaction and degradation. The IR
spectrum of model CCB drug confirms the presence of the characteristic functional groups
and was in good agreement with the literature findings. (Fig:-) 3350 cm-1 N-H Stretching,
2800 cm-1 C-H Stretching(Aromatic), 3250 cm-1 C-H Stretching(Aliphatic), 1531 cm-1
NO2 Stretching, 1493 cm-1 C=C Stretching(Aromatic). The spectrum of the pure drug shows strong absorption band at 3350cm-1 due to the stretching of the N–H group of dihydropyridine (DHP) moiety. The bands between 2800 and 3250 cm-1can be due to the stretching of aromatic and aliphatic C–H bond. The two strong absorption bands at 1655 and
1706 cm-1 can be attributed to the carbonyl groups of the two side chain in the structure of DHP. The NO2 stretching produced two bands, one at 1531 cm-1and the other at 1348 cm-1. The band at 1493 cm-1 is for aromatic C=C bond. The two bands at 1215 and 1116 cm-1 are due to C–O stretching. The FTIR spectrum of the excipient revealed the main absorption
bands of the drug. The recorded spectrum indicated no significant interaction between the
drug and excipients.
Estimation of Nisoldipine by UV method-Absorption maxima of Nisoldipine: Nisoldipine absorption maxima was determined by preparing any concentration in ethanol and Ph 1.2
HCL buffer and analyzing the solution Spectrophotometrically using (ShimadzuUV-1700
double beam spectrophotometer) at 232-237 nm range. Absorption maxima was found to be:
237 nm which consents with that literature review.
Standard Calibration curve for Nisoldipine: Calibration of Nisoldipine was developed by UV spectrophotometry in ethanol and pH 1.2 HCL buffer which was used as the solvent for
dissolving the drug. Appropriate dilutions were carried out with the buffer and absorbance
was measured at λmax of237 nm to get the Beer Lambert’s range of 2- 20µg/ml. The regression coefficient value was found to be 0.9983. The regression values of Intra-day and
Inter-day variability studies negligible difference hence revealed that the drug did not
undergo any reaction or degradation.
Intra - day variability: The regression values of Intra-day variability studies and % RSD value less than 3 revealed that the drug did not undergo any reaction or degradation within a
Inter - day variability: The regression values of Inter-day variability studies and % RSD value less than 3 confirmed that the drug did not undergo any reaction or degradation within
three days.
Partition Coefficient: The partition coefficient of Nisoldipine conducted by Shake- Flask method gave a value of k= 2.2indicating its lipophilic behaviour.
In-Vitro Permeation Studies of Nisoldipine: Permeation studies of pure drug were conducted for 24 hours across activated cellophane membrane. At the end of the 24th hour
98.19 % of the drug diffused through the cellophane membrane suggesting high permeability
of the drug. The permeability co-efficient of pure drug determined by applying Potts-Guy
equation was found to be -3.372, which suggests high permeability of the drug through lipid
membranes.
Solubility Studies of pure Drug in Different Solvents: From the solubility profile of Nisoldipine in various media (Table-) it was found that the drug was freely soluble in ethanol
and pH1.2 HCL buffer. The solubility of the drug was also examined in various buffers.
Hence the drug has more soluble in polar solvent that the non-polar solvents.
Drug Excipient Compatibility Studies-FT-IR Compatibility studies: Results of IR spectrum of the pure drug Nisoldipine and powder mixture of pure drug and excipients are
represented in FIG and FIG respectively. The Nisoldipine has indicating presence of all
specific absorption peaks suggesting that the all functionalities are also present in the powder
mixture. Hence, it is concluded that, drug present in Free State in powder mixture and not in
the form of reaction product. Thus,. FT-IR spectrum of pure NISOLDIPINE and physical
mixture of drug with excipients did not show any major peak change hence no interactions
between drug and excipients confirming compatibility.
FORMULATION OF MTD: The formulation of Mouth dissolving Tablets (MDTs) Of Nisoldipine by using Synthetic and natural Superdisintegrants is done. The powder blend for
each formulation was mixed properly and subjected for Pre-compression evaluation
parameters.
PRE-COMPRESSION EVALUATION-Evaluation of the powder blends: The Tableting excipients were mixed thoroughly to obtain a powder blend which was then passed through
for flow properties like the bulk density and tapped density, Carr’s index, Hausner’s ratio and
angle of repose. The Tapped density of synthetic and natural super disintegrants powder
blends was in between 0.437-0.576gm/mL and 0.676-0.447gm/mL respectively, whereas the
untapped density was in the range of 0.408-0.544gm/mL and 0.545-0.438gm/mL. The
compressibility values varied from 11.99%- 12.76%% and 12.86%-12-99%. The Hausner’s
ratio values of the formulations were in between 1.058-1.136 and 1.126-1.018. The angle of
repose values of the formulations varied from 26°01’ to 27°35’ and 26°21’ to 27°45’. From
these values, it was evident that these powder blends had good flow properties and can
subjected for direct compression.
TABLET COMPRESSION: The formulation of ODTs was achieved by direct compression method. Different synthetic superdisintegrants (Kyron T-314, Sodium starch glycolate and
crosscarmellose sodium) in different concentration of3%, 4%, and 5% and natural
superdisintegrants(Guar gum, Banana powder, Mango peel powder) in different
concentration of 2%, 4%, and 6% were screened for their effects on weight variation,
hardness, friability, wetting time and in-vitro disintegration studies. The most suitable
synthetic superdisintegrants was found to be Kyron T-314 and natural superdisintegrants was
found to be mango peel powder due to its excellent swelling nature, resulting in rapid
disintegration. Thus, Kyron T-314 and mango peel powder tablets gave satisfactory results as
it showed better hardness, friability in-vitro disintegration and a good texture.
POST COMPRESSION EVALUATION: All the formulations prepared with synthetic and natural super disintegrants had hardness within the range of 4.6-5.6. Friability was within
limits of <1% for the MDTs prepared with Perlitol-200 SD as diluent. Drug content for all the
formulation was within limits of ± 5% of total drug. Formulation F18containing mango peel powder as super disintegrants and Perlitol-200 SD as diluent showed least wetting time of
35.19±0.43 sec. Formulation F18 showed the best disintegration time of 18.12+0.72 sec.
Hence mango peel powder was selected as the super disintegrants, whereas Perlitol-200 SD
was selected as the suitable diluent blend for further optimization studies. Formulation F18
with mango peel powder were optimized as best formulations and subjected to weight
variation test and drug release kinetics.
Evaluation of the final optimized MDT Formulation (F-18): The weight variation results of 20 tablets indicated that all the tablets are within the range. The hardness, friability and
respectively, hence were within the specified range. The wetting time and disintegration time
were found to be 35.19sec and 18.12sec respectively. In-vitro dissolution studies carried out
in pH 6.8 and F18 gave a better release 98.916%.
Drug Release Kinetic Studies: F18 was subjected to mathematical modelling such as Zero order, First order, Higuchi matrix, Hixon-Croswell cube root law and Kormeyers- Peppas
model. And the best fitted model for F18 was found to be Higuchi matrix model having
n=13.86 with R2 0.852 which indicates that the drug release is dependent on polymer.
Stability Studies: Short term stability studies were performed on final optimized MDT formulation for period of 1 month. At the end of 1 month F18 was evaluated for physical
appearance, drug content and CPR at 20th and 45th min and formulation was found to be stable.
REFERENCES
1. Tanira M, Al Balushi K. Genetic variations related to hypertension: a review. J Hum
Hypertens, 2004; 19(1): 7-19.
2. Siyad.A.R. hypertension. Hygiea journal for drugs and medicine, 2011; 3(1): 1-16.
3. Ilyas M. Hypertension in adults. Southern sudan medical journal, 2(3).
4. G:\Website\Drug Classess\Drug Classes Final Copy Dec 2008\Calcium Channel
Blockers.doc.
5. Ozawa Y, Hayashi K, Kobori H. New Generation Calcium Channel Blockers in
Hypertension Treatment, Curr Hypertens Rev., 2006 May 1; 103-111.
doi:10.2174/157340206776877370.
6. Vasanthan M, Narayanasamy D. Development of Fast Dissolving Tablets of Nisoldipine
by Solid Dispersion Technology using Poloxamer 407 and Polaxamer 188. J Young
Pharm, 2016; 8(4): 341-349.
7. Kumar S K, Ramarao T, Bikshapathi D.B.R.N and Jayaveera K.N. Controlled Release
Formulation Development and Evaluation of Felodipine Matrix Tablets By Using
Hydrophobic Polymers. IJPRS, 2013; 4(1): 506-511.
8. Rathore A S, Jat R.C, Sharma N, Tiwari R. An Overview: Matrix Tablets as Controlled
Drug Delivery System, Jun-Jul, 2013; 2(4): 482-492.
9. Sonje A, Yadav A, Chandra A, Jain D.A. Formulation and evaluation of immediate
release tablet of antihypertensive drugs according to BCS system INT J Ther Appl., 2012;
10.Gupta M.M, Mahinda M. Formulation development and evaluation of Immediate release
tablet of anti-hypertensive drug Olmesartan medoxomile. Pharma Inno J., 2013; 1(3):