CHARACTERIZATION OF WHEAT FLOUR: NUTRITIONAL
CONTENTS AND HEALTH HAZARDS.
1
Yadav K. S., 2Sen A.A., 3Sharma G. R., 4Netterwala A., 5*Desai N. S
1,4
School of Medicine, Department of Biochemistry, D Y Patil University, Navi Mumbai –
400706.
2
School of Biotechnology, D Y Patil University, Navi Mumbai – 400706.
3
Godhum Grains & Farms Pvt Ltd, Mumbai 400020 India.
5
Amity Institute of Biotechnology, Amity University, Bhatan, Panvel, Navi Mumbai-
410206.
ABSTRACT
Wheat is the most important source of proteins, vitamins and dietary
fibers. Nutritional deficiency affects a large population in India and
therefore nutritional value of wheat is very crucial, since it is one of the
important staple food of India. Various commercial brands are
available in Indian market out of which 20 brands were collected for
the study along with 2 brands from Denmark. Out of these, 5 local and
2 reference brands were analyzed for protein , Vitamin B1, B2 , B3 and
E , dietary fiber and rest all for pesticides in terms of suitability of
these wheat flours for nutrition and health safety. Highest amount of
protein and Vitamin B3 was observed in DEN-2 sample 13.95
g/100gm and 6.17 mg/100gm respectively. The DEN-1 sample showed
the highest amount of dietary content (10.89 g/100gm). The maximum amount of Vitamin B1
was observed in GA-3 (0.4 mg/100gm), Vitamin B2 in GA-7 (0.067mg/100gm).Pesticides
are toxic and has a deleterious effect on health and can lead to fatal organ failure. Pesticide
residues were detected in 7 samples out of the 20 Indian brands, their concentration ranged
from 0.01 to 0.23 mg/Kg. The reference samples were free from pesticidal residue as well as
they were found high in nutritional content. These observations indicate that reference brands
might be processed at low temperature and speed which may be result in preserving the
nutritional value. Whereas Indian brands are subjected to harsh processing ,which might have
degraded the nutritional content. Presence of pesticidal residue in the samples analyzed
Volume 5, Issue 2, 634-648. Research Article ISSN 2277– 7105
*Correspondence for Author
Desai N. S Amity Institute of
Biotechnology, Amity
University, Bhatan,
Panvel, Navi
Mumbai-410206.
Article Received on 22 Nov 2015,
indicate improper pretreatment before grinding and packaging .Thus it warrants urgent
consideration for conventional organic farming , use of organic manures and proper
processing of wheat to meet the nutritional demands and safety of the consumer.
KEYWORDS: wheat flour, nutritional values, pesticides, health hazards.
INTRODUCTION
Wheat is the most widely grown crop and is also the 2nd most abundant staple crop grown all over India. It is readily available protein source in developing countries. Wheat crop
contributes substantially to the national food security by supplementing more than 50% of the
calories to consumer. India has witnessed a significant increase in total food grain production
to the tune of 233.88 metric tons with a major contribution of wheat with 80.58 metric tons,
34.5% during 2008-09.[30] Wheat provides approximate 55% of carbohydrate and 20% of the food calories. It contains carbohydrate (78.10%), protein (14.70%), and fat (2.10%), minerals
like selenium, magnesium etc (2.10%) and vitamin-B.[13,32] Changing lifestyles, increased per capital income, continued trend in migration of population from rural to urban made
consumers more inclined toward readymade instant wheat products.
The amount of wheat storage proteins as well as their quality is one of the most important
factors determining the end-uses of wheat grain.[22]Whole wheat grains are known to protect from chronic disease. Earlier studies conducted by Jacobs et. al.,(1998) demonstrated that
consumption of dietary fiber and whole grain intake lowers the risk of colorectal, gastric and
endometrial cancer.[18] It has also been reported that there is a correlation between gluten and celiac disease, schizophrenia, sporadic idiopathic ataxia (gluten ataxia), migraines, acute
psychoses, etc.[8,13] The outer layer of the barn provides fiber that produces bulk and regulates the absorption and excretion from the body.[8,14] Wheat grain and its products contain more Phosphorous, Potassium and Magnesium while Silicon, Selenium, Sulphur, Calcium,
Chlorine and Iron are low. The mineral composition of wheat grown under different physical
and genomic factors revealed that there were differences in ash, Potassium, Manganese and
Magnesium contents, while only minor differences in Iron, Zinc, Phosphorous and Copper
contents were found.
Pesticidal residue studies in food is of regulatory importance. Many researchers have globally
reported the presence of pesticide residues in various crops, fruits and vegetables. There are
present investigation an attempt has been made to evaluate the various commercial wheat
flour from Indian market for nutritional content and health hazards.
MATERIALS AND METHODS
The following samples were collected from the local market and two imported samples were
obtained from Denmark as reference sample and were analyzed as indicated in Table No.1.
Table1: Various commercial wheat flour obtained from market analyzed for various biochemical and pesticide residues.
Sr. No Wheat flour coded
Geographical
region Biochemical analysis
1 GA-2
India
Amount of protein, dietary fiber,
vitamin B1, vitamin B2, Vitamin B3, vitamin E and Pesticide residues.
2 GA-3
3 GA-7
4 GA-8
5 GA-9
6 DEN-1
Denmark
7 DEN-2
8 IW-1
India
Analyzed are
Chloropyrifos, Meplquat, Chlormequat, Malathion, 2,4DDE
9 IW-2
10 IW-3
11 IW-4
12 IW-5
13 IW-6
14 IW-7
15 IW-8
16 IW-9
17 IW-10
18 IW-11
19 IW-12
20 IW-13
21 IW-14
22 IW-15
Protein Estimation
Protein content in the sample was estimated by Kjeldahl method . This is an analytical
method that involves digestion of sample in the presence of sulphuric acid and Dipotassium
sulphate at boiling temperature which breakdowns the organic matter and release nitrogen
gas. Ammonia is subjected to alkali distillation and titrated by acid to quantify as per AOAC
Estimation of Vitamin B1
Vitamin B1 content in wheat flour was quantified using ion-exchange high performance
liquid chromatography coupled to UV detector (HPLC-UV). After enzyme hydrolysis,
thiamin oxidizes with potassium ferricyanide in sodium hydroxide solution to form the
thiochrome, which is fluorescent. The extract was injected into a HPLC onto a reverse phase
column (C18) with fluorescence detector. The samples excitation was recorded at 370 nm and
emission at 430 nm using mobile phase (HTAA:Methanol 83:17)
Determination of pesticide residue by gas chromatography
Pesticide residue analysis in food is one of the most important and challenging tasks in
routine laboratory practice. The European legislation, which is currently the most strict
legislation (European Regulation 396/2005 and Commission Directive 2006/125/EC), sets
maximum residue limits (MRL) of pesticides in different products of plant and animal origin.
This presents a significant analytical challenge with respect to the low limits of quantification
(LOQ) required for some specified food matrices. Here in our work the method for
determination of pesticides in the wheat samples were outsourced to Eurofins Analytical
Services India (Bangalore).
Samples were treated according to a standard QuEChERS method protocol (extraction and
clean-up). The samples were extracted in the presence of citrate buffer , water was removed
and purified in a dispersive phase; prior to injection in the TSQ 8000 Triple-Stage
Quadrupole GC-MS system. Ready to use QuEChERS kit containing both extraction and
clean-up tubes and associated protocol were used for sample preparation (Thermo Fisher
Scientific, Runcorn UK). Identification of pesticide residues was based on retention time and
ion-ratio confirmation using selective reaction monitoring (SRM) of characteristic transition
ions, while quantification was calculated on matrix matched calibration and internal
standardization. All method performance criteria were established according to the relevant
guidelines.
Standards and Reagent Preparation
Individual Pesticide Standard Stock Solutions
Solutions were prepared gravimetrically in ~1000 mg/l concentration by weighing 10 mg of
each analyte and dissolved in 10 ml of appropriate solvent (acetone, toluene or acetonitrile
depending on the individual compound). Concentrations of each individual standard stock
individual standard stocks were stored at -20°C. Validity of individual standard stock
solutions was 6 months.
Intermediate Standard Stock and Working Standard Solutions
These preparations were done by pipetting the appropriate amount of each individual
standard stock and diluting it with acetonitrile. The concentration of intermediate standard
stock solutions was 5000ng/ml. Working standards were prepared by diluting intermediate
standard stock solution accordingly. Intermediate standard stock solutions were stored at -20
°C, and the working solutions at 4 °C. Validity of intermediate stock solutions was 3 months.
Individual Internal Standard Stock Solutions
Individual Internal Standard Stock Solutions were prepared gravimetrically in ~1000mg/l
concentration by weighing 10 mg of each analyte and dissolving in 10 ml of acetone for TPP
and 10 ml toluene for BFB. Exact concentration values were determined based on the
gravimetrical values of both weighed compound and added solvent. Individual internal
standard stock solutions were stored at -20°C. Validity of individual internal standard stock
solutions was 6 months.
Working Internal Standard Stock Solutions
Preparations were individually done by pipetting the appropriate amount of each individual
standard stock solution and diluting it with acetonitrile. The concentration of working internal
standard stock solutions was 5000ng/ml and was used for direct spiking of the samples.
Validity of working stock solutions was 3 months.
1% Sorbitol Solution (Analyte Protectant) was prepared in 70/30 v/v% ACN/H2O and used
for adding prior to injection. Protectant solution was added to the sample prior to injection in
order to prevent undesired analyte interaction and consequent losses during the injection.
Procedure
Sample Preparation
Blank matrix samples (Strawberry (SB), wheat flour (WF) and leek (LK)) used for validation
experiments were purchased from local retail stores and were homogenized with an
Ultra-Turrax homogenizer, extracted and cleaned-up prior to sample preparation. Matrix extracts
were used as matrix blank samples and dilution solvents for matrix-matched calibration.
that contained 4g MgSO4, 1g NaCl, 1g Trisodiumcitrate dehydrate and 0.5g Disodiumcitrate
sesquihydrate for buffered extraction of target compounds.
Homogenization of Matrices
For matrix homogenization, 500gm of the wheat flour sample was placed in an appropriate
beaker and labelled. The beaker was then attached to G25 dispergator tool to the Ultra-Turrax
homogenizer. (For better recovery of unstable compounds cryogenic homogenization is
advised). Homogenizer was rotated at middle rotation speed (speed level 2–3) until a uniform
smooth homogenate was prepared.
Sample Extraction and Clean-up
Sample extraction step is the most crucial part of the analysis. 10g of sample was weighed in
a 50ml QuEChERS extraction tube containing 4g MgSO4, 1g NaCl, 1g trisodium citrate
dehydrate and 0.5g disodiumcitrate sesquihydrate 200µl of 5000ng/ml internal standard was
added to the samples followed by addition of 20ml H2O to the samples. The sample was allowed to wet and then 10ml of ACN was added to it. Samples were shaked for 10 min on a
horizontal shaker and centrifuged at 5000rpm for 5min. Supernatant (~8ml) was aspirated in
15ml QuEChERS clean-up tubes containing 1200mg MgSO4, 400mg PSA and 400mg C18.
Vortexed for 1min and centrifuged samples at 5000rpm for 5min. Supernatant was collected
and 1ml was utilized for GC instrumental analysis. 50µl sorbitol solution (protectant) and
20µl of 5000ng/ml injection standard (BFB) was added to the GC vials prior to injection.
GC-MS/MS Analysis
Samples were assayed using TRACE 1310 gas chromatograph coupled to the TSQ 8000
Triple Stage Quadrupole Mass Spectrometer (Pesticide Analyzer). TraceFinder 3.1 software
was used for instrument control, analysis, data review and reporting.
Triple Quadrupole MS Settings
Mass spectrometric detection was carried out using the TSQ 8000 triple-quadrupole mass
spectrometer in timed-SRM mode. All methods and SRM settings were extracted from
Thermo Scientific TSQ 8000 Pesticide Analyzer system method.
Determination of total dietary fiber [TDF]
Total dietary fiber (TDF) was determined by running duplicate samples of dried and defatted
α-amylase to give gelatinisation, hydrolysis and depolymerisation of starch; incubated at 60°C
with protease (to solubilise and depolymerise proteins) and amyloglucosidase (to hydrolyse
starch fragments to glucose); and treated with four volumes of ethanol to precipitate soluble
fiber and remove depolymerised protein and glucose (from starch). The residue is filtered;
washed with 78% ethanol, 95% ethanol, and acetone; dried; and weighed. One duplicate was
analysed for protein and the other was incubated at 525°C to determine ash. The TDF is the
weight of the filtered and dried residue less the weight of the protein and ash.
RESULTS
In the present study the nutritional properties of wheat flours were analyzed by comparing
Indian and imported wheat flours.
Total protein content of different wheat flour brands
Protein content varied from 10-20%. Protein content estimated in all the wheat flour samples
indicated relatively same amount. Among all the samples DEN-2 showed highest content, i.e.
13.95 g/100gm, followed by GA-2 with 13.83 g/100gm protein content and GA-7 sample
13.77 g/100gm. The lowest protein content was reported in GA-9 with 10.23 g/100gm.
Figure1. Total protein content in wheat flour
Total dietary fiber content in different brands of wheat flour
The total dietary fiber content was determined in seven wheat flour samples. After detailed
analysis it was observed that DEN-1 contains highest amount of dietary fiber i.e.
10.89g/100gm. Amongst all the Indian samples GA-7 sample showed highest content of
dietary fiber i.e. 10.53 g/100gm. The lowest amount of dietary fiber content estimated was
whole wheat grain ranges from 11.6% to 12.7% dry weight which is similar with the findings
of this study.
Figure2: Total dietary fiber content in wheat flour
Total Vitamin B1 content in flour samples
Vitamin B1 content was examined in the seven wheat flour samples. The highest
concentration of Vitamin B1 is present in GA-3 (0.4 mg/100gm) and the lowest was reported
in GA-8. GA-7 and GA-9 has same amount of Vitamin B1 content 0.36 mg/100 gm.
Figure3:Total Vitamin B1 content in wheat flour
Total Vitamin B2 content in wheat flours
After detailed analysis it was found that the sample GA-2 contained the highest amount of
was present in DEN-1 sample (0.039mg/100gm)and the lowest amount of Vitamin B2 in all
[image:9.595.143.457.464.651.2]the samples was observed in DEN-2.
Figure 4: Total Vitamin B2 content in wheat flours.
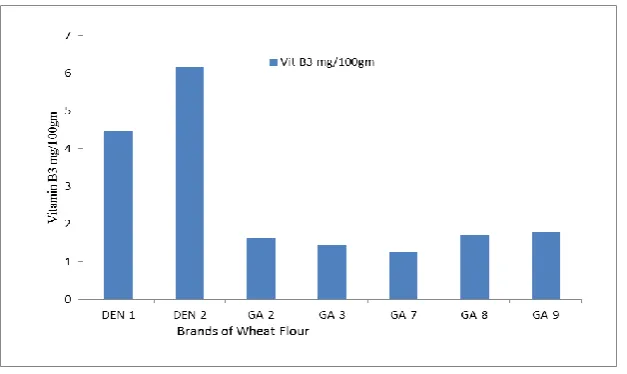
Total Vitamin B3 content in wheat flour
Vitamin B3 content in the wheat flour samples showed a significantly greater difference. In
this regard, Reference samples from Denmark ranged 4.4 to 6.1mg /100gm of Vitamin B3
amount. Whereas Indian samples had substantially lower amounts ranging from 1 to
2mg/100gm.
Figure4. Total Vitamin B3 content in wheat flour
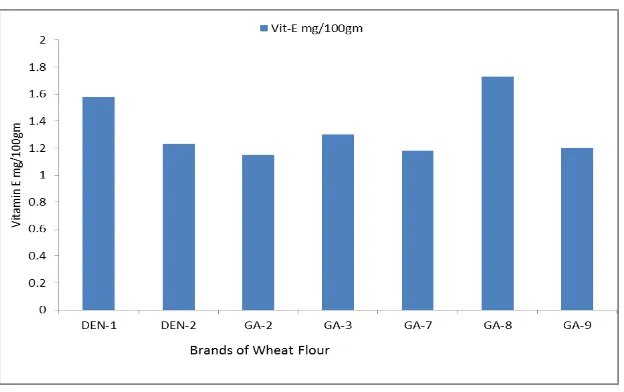
Total Vitamin E content in wheat flour
The Vitamin E content varied slightly in concentration, it ranged from 1mg/100gm to
2mg/100gm. Both Indian and reference samples had similar amount. Highest amount was
Figure5:Total Vitamin E in wheat flour.
Pesticidal residue in wheat flour
The pesticides which are frequently detected and are found to violate the Maximum Residue
Limit (MRL) were investigated in the present study. The samples were outsourced to detect
the presence of Chlorpyrifos, Malathion, 2, 4 DDD; 4,4 DDE; 4,4 DD; 4,4 DDT, Triazophos
and 4,8 Sulphoxite at Eurofins Analytical Services India Private Limited, NABL accredited
analytical Laboratory, Bangalore.
It was observed that six samples showed the presence of pesticides at various concentration
ranges between 0.01 to 0.23mg/kg. Out of all the samples chlorpyrifos and Malathion was
present in four samples. In the course of this study sample IW-3 showed the highest amount
[image:10.595.143.455.67.263.2]of pesticides as compared to others.
DISCUSSION
Nutrients are indispensible chemical substances that are essential for growth and healthy life.
Nutritional value of food depends upon macro and micro molecules present in it. The Indian
population as whole is deprived of ample amount of nutrients necessary for good health (21).
Wheat is a good source of Vitamin B complex, dietary fibers, magnesium and Vitamin E and
is one of the important constituent of Indian diet which provides significant amount of
nutrients. Wheat contain 8-20% proteins , and the samples studied in present study revealed
protein content from 10.2 to 13.8% whereas, the reference samples showed 14% protein . It is
indicative that the grinding process is the most crucial step in preserving proteins and other
nutritional content of wheat flour [28]. Traditionally wheat is processed by using ball milling
or roller milling method at very high speed. Processing at higher temperatures also damages
biomolecules and reduces their nutritional value. Traditional stone mill grinding involves
shear stress , compression and friction that helps in preserving these natural compounds.
Total dietary fibers in food are very important for enhancing digestibility balancing the
gastrointestinal pH , bowel movement and also to remove the body toxins. Fiber content
varied from 9.6 to 10.5%, whereas one of the reference sample showed 10.9%. Fibers get
damaged due to milling of cereals to fine refine flour, this could be the one of the reasons for
low fiber content in Indian flours. However it is a known fact that 470 C and above temperature degrades the essential macro and micro molecules. An increased temperature
leads to breakdown of weak bonds between polysaccharide chains which also affects
glycosidic linkages in the dietary fibers (FAO, 2016).
The essential vitamin and amino acids content varies in different genotype which is also
affected by environment. The Vitamin B3 content in reference sample is very high to that of
Indian samples , whereas Vitamin B2 and B1 are on higher side in Indian samples. Indicating
Indian genotypes are superior for Vitamin B content (10).
Pesticidal residue are major contaminants in our food. The contamination of food with toxic
pesticides has severe ill effects on human health. It is very important to explore food safety
especially for developing nations where pesticide contamination of foods is increasing at
alarming level due to indiscriminate uses of pesticides. Many of the samples showed higher
amounts of pesticides to that of WHO norms. The pesticides like chlorpyrifos has been
detected in four out of six samples. The usage of chlorpyrifos has been restricted in US and
chlorpyrifos and its degraded product has been concern of human health alongwith other
pesticides like Malathion, 4,4 DD , 2,4 DDD , etc. (16).
The overall observations of nutritional values and pesticidal residues in Indian wheat flour
are in agreement with the published data from different parts of the world. Organophosphate
pesticides are most common pesticide which have showed acute poisoning in countries like
India, Srilanka.[27].In last few years many cases of pesticide poisoning has been reported to
Poison Information Centre of The National Institute of Occupational Health in Ahmedabad
,(8) because of food ingested with various pesticide. Therefore pesticides in the environment
and food needs to be monitered to provide rich and healthy food to the consumer. Thus it
warrants to develop further strategies to avoid contamination of food and food products for
better health of the consumers.
CONCLUSION
Though the wheat varieties have high nutritional potential in terms of vitamins , dietary fibers
and proteins but many of them are contaminated with pesticides which make them as a
nutritional hazard. To avoid such contaminations and health hazards because of pesticides
conventional organic farming, less or no usage of chemical fertilizers and proper hygienic
food storage is needed.
ACKNOWLEGDEMENT
Authors are thankful to Ms Bhakti Gawade for her help in editing the manuscript.
REFERENCE
1. Adlercreutz H., Hamalainen E., Gorbach S.L., Goldin B.R., Woods M.N., Brunson L.S.,
Dwyer J.T. Association of Diet and Sex-Hormones in Relation to Breast-Cancer. Eur. J.
Cancer Clin. Oncol., 1987; 23: 1725–1726.
2. Asteraki EJ, Hanks CB, Clements RO. The impact of the chemical removal of the
hedge-based flora on the community structure of carabid beetles (Col. Carabidae) and spiders
(Araneae) of the field and hedge bottom. J Appl Ent., 1992; 113: 398–406.
3. Barcelo' D, Hennion MC. Trace Determination of Pesticides and Their Degradation
Products in Water. Amsterdam, the Netherlands: Elsevier., 1997; 3.
4. Barcelo D, Porte C, Cid J, Albaiges J. Determination of organophosphorus compounds in
phosphorus and chemical ionization mass spectrometric detection. Int J Environ A
Chem., 1990; 38: 199–209.
5. Bhagobaty R.K., Joshi S.R., Malik A., Microbial degradation of organophosphorous
pesticide : chlorpyrifos (mini review). Internet J Microbiol., 2007; 4(1): 1937-8289.
6. Caragay AB. Cancer- preventive foods and ingredients. Food Tech., 1992; 46(4): 65-68
7. Carson GR, Edwards NM. Criteria of wheat and flour quality. In: Khan K, Shewry P,
editors. Wheat chemistry and technology. St Paul, MN: American Association of Cereal
Chemists., 2009; 97–118.
8. Cartera JW, Madlb R, Padulac F. Wheat antioxidants suppress intestinal tumor activity in
Min mice. Nutrition Research, 2006; 26(1): 33-38.
9. Drankham K, Carter J, Madl R, Klopfenstein C, Padula F, Lu Y, Warren T, Schmitz N,
Takemoto DJ. Antitumor activity of wheats with high orthophenolic content. Nutrition
and Cancer, 2003; 47: 188–194.
10.Dupont F. M. and Altenbach S. B. , Molecular and biochemical impacts of environmental
factors on wheat grain development and protein synthesis. Journal of Cereal Science,
2003; 38: 133-146.
11.FAO-Carbohydrates and human nutrition: www.fao.org/docrep/w8079e/w8079e0j.htm
dtd. 5th Feb, 2016.
12.FDA, authors. Code of Federal Regulations. Vol. 2 Foods and Drug Administration;
Silver Spring, MD, USA. Health claims: Fiber-contaning grain products, fruits and
vegetables and cancer., 2008.
13.Fraley RT. Improving the nutritional quality of plants. In: Vasil IK (ed) Plant
biotechnology 2002 and beyond. Kluwer, Dordrecht, 2003; 61–67.
14.Hadjivassiliou M, Grunewald RA, Davies-Jones GAB, 2002. Gluten sensitivity as a
neurological illness. Journal of Neurology, Neurosurgery and Psychiatry, 2002; 72:
560–563.
15.He GY, Rooke L, Steele S, Bekes F, Gras P, Tatham AS, Fido R, Barcelo P, Shewry PR,
Lazzeri PA. Transformation of pasta wheat (Triticum durum L. var. durum) with high
molecular weight glutenin subunit genes and modification of dough functionality.
Molecular Breeding, 1999; 5: 377–396.
16.Huff R.A., Corcoran J.J., Anderson J.K., Abou-Donia M.B., Chlorpyrifos oxon binds
directly to muscarinic receptors and inhibits cAMP accumulation in rat striatum. J
17.Hvatum M, Kanerud L, Hallgren R, Brandtzaeg P. The gut–joint axis: cross-reactive food
antibodies in rheumatoid arthritis. Gut, 2006; 55: 1240–1247.
18.Jacobs DR, Marquart L, Slavin J, Kushi LH. Whole-grain intake and cancer: an expanded
review and meta-analysis. Nutrition and Cancer, 1998a; 30: 85–96.
19.Jacobs DR, Meyer KA, Kushi LH, Folsom AR. Whole-grain intake may reduce the risk
of ischemic heart disease death in postmenopausal women: the Iowa women’s health
study. American Journal of Clinical Nutrition, 1998b; 68: 248–257.
20.Kalaydiian AE, Eaton W, Cascella N, Fasano A. The gluten connection: the association
between schizophrenia and celiac disease. Acta Psychiatrica Scandinavia, 2006; 113:
82–90.
21.Kaushik Geetanjali, Naik S. N. , Satya Santosh , Effect of domestic processing on
nutrients and pesticide residues in chickpea. Medterr J Nutr Metab., 2012; 5: 21-30.
22.Kumar P., Yadava R.K., Gollen B., Kumar S., Verma R.K. and Yadav S. Nutritional
Contents and Medicinal Properties of Wheat: A Review. Life Sciences and Medicine
Research., 2011; 2011.
23.Meyer K.A., Kushi L.H., Jacobs D.R., Jr., Slavin J., Sellers T.A., Folsom A.R.
Carbohydrates, dietary fiber, and incident type 2diabetes in older women. Am. J. Clin.
Nutr., 2000; 71: 921–930.
24.Mohammad.A., Faruki F.B and Mustafa J., Edible Compounds as Anti-tumor Agents.
Indian Journal of Science and Technology., 2009; 2(5): 0974-6846.
25.Nomura A.M., Hankin J.H., Henderson B.E., Wilkens L.R., Murphy S.P., Pike M.C., Le
Marchand L., Stram D.O., Monroe K.R., Kolonel L.N. Dietary fiber and colorectal cancer
risk: The multiethnic cohort study. Cancer Causes Control., 2007; 18: 753–764.
26.Pandey.N., Baking quality of wheat: effect of delayed harvest, cultivars, growing
conditions and nitrogen fertilization. Master thesis. Department of Plant and environment
(IPM): Norwegian university of life sciences, 2013.
27.Patel A. , Dewani A. and Kaji B. , Monocrotophos poisoning through contaminated millet
flour. Archives of Industrial Hygiene and Toxicology., 2012; 63(3): 377-382.
28.Prabhashankar P., Rao P.H., Effect of different milling methods on chemical composition
of whole wheat flour. European Journal Of Food Research and Technology, 2001; 213:
465-469.
29.Schatzkin A., Park Y., Leitzmann M.F., Hollenbeck A.R., Cross A.J. Prospective study of
dietary fiber, whole grain foods, and small intestinal cancer. Gastroenterology., 2008;
30.Singh SS. Wheat production in India and future aspects. 8th International Wheat Conference: Russia, June 2010; 1-4: 2-29.
31.Thompson C A, Bloch A. Position of the American Dietetic Association: Phytochemicals
and functional foods. J. Am Diet Assoc., 1995; 95: 493-96.
32.Topping D. Cereal complex carbohydrates and their contribution to human health. Journal
of Cereal Science, 2007; 46: 220–229.
33.Tosi, P., Gritsch, C. S., He, J. & Shewry, P. R. Distribution of gluten proteins in bread
wheat (Triticum aestivum) grain. Annals of botany, 2011; 108(1): 23-35.
34.Tucker L.A., Thomas K.S. Increasing total fiber intake reduces risk of weight and fat
gains in women. J. Nutr., 2009; 139: 576–581.
35.Young G.P., Hu Y., Le Leu R.K., Nyskohus L. Dietary fiber and colorectal cancer: A