Zote et al. World Journal of Pharmaceutical Research
Zote et al. World Journal of Pharmaceutical Research
IN SILICO
STRUCTURAL AND FUNCTIONAL
CHARACTERIZATION OF QTLS CONTROLLING GPC AND
MICRONUTRIENT CONTENT AND IDENTIFICATION OF
CANDIDATE GENE BASED QTLs SPECIFIC MARKERS
R. K. Zote*, G. Chandel1, R. N. Dhawale2, S. B. Verulkar3 and A. S. Kotasthane4
*
Assistant Professor, COAB, Georai Tanda-Aurangabad (MS) India. PIN-431 001.
1
Associate Professor, Department of Plant Molecular Biology and Biotechnology, IGKVV,
Raipur (CG), India.
2
Assistant Professor, VDCOAB, Latur, VNMKV, Parbhani, (MS), India.
3
Professor and HOD, Department of Plant Molecular Biology and Biotechnology, IGKVV,
Raipur (CG), India.
4
Professor and Head of Department, Department of Plant Pathology, IGKVV, Raipur (CG).
ABSTRACT
Rice (Oryza sativa L.) grain iron and zinc content is a polygenic
complex trait having additive effect of multiple genes thus
identification of QTLs and sequence analysis of genomic region
encompassing them enable us to understand not only the inheritance of
grain micronutrient content but also to develop Fe/Zn rich rice using
marker assisted breeding techniques. Co-segregation analysis was
performed with the F6 mapping population derived from a cross
between rice cultivar Swarna x Moroberekan. The grain Fe content
ranged from 9.68 to 19.98 μg/g with an average of 16.87 μg/g and
grain Zn content ranged from 15.85 to 20.84 μg/g with an average of
25.76μg/g among the 73 homozygous rice mapping population.
Similarly the grain protein content ranged from 5.34% to 7.18% with an average of 9.23%. In
order to identify novel SSR based molecular markers, 5 known QTLs (qFE-1, qFE-9, qZN-5,
qZN-7 and qZN-11) identified[9] for grain Fe/Zn content in rice were analyzed using in-silico
tools. Out of 1063 novel SSRs loci present within the 5 QTL regions, 161 Class I SSRs with
2-6 nt long repeat motifs and 12–80 nt repeat lengths were identified. On the basis of position
World Journal of Pharmaceutical Research
SJIF Impact Factor 6.805
Volume 5, Issue 3, 1647-1672. Research Article ISSN 2277– 7105
Article Received on 19 Jan 2016,
Revised on 09 Feb 2016, Accepted on 29 Feb 2016
*Correspondence for Author
R. K. Zote
Zote et al. World Journal of Pharmaceutical Research
Zote et al. World Journal of Pharmaceutical Research
novel Class- I SSR and validated in the parents for their polymorphism. Out of 34 previously
designed primers, 4 randomly selected RM markers and 22 novel SSR designed markers,
only 18 markers were found to be polymorphic. The allelic segregation analysis indicated that
indica parent Swarna contributed about 60.6% whereas the japonica parent Moroberekan
contributed about 34.32% of total amplified alleles on an average which clearly showed
departure from the theoretically expected 1:1 ratio of equal contribution from the two parents.
Out of 18 polymorphic SSRs, the co-segregation analysis performed for the 5 randomly
selected SSR‟s markers. The all five markers; gRMm7-2, gRMm7-3, gRMm33-2,
gRMm34-1 and gRMm33-3 were significantly associated to grain iron and zinc contents.
KEYWORD: in-silico, Rice, allelic segregation, SSRs, Fe content, Fe/Zn, QTLs.
INTRODUCTION
Rice is vital staple food of more than half of the world‟s population, primarily the poor
people living in Asia and Latin America. Approximately, 90 countries cultivate rice, farmers
from irrigated upland, lowland and flood-prone areas across Asia are major rice producers.
Rice represent single largest source of calories in the world.[6] The human body requires more
than 22 minerals elements that can be supplied by an appropriate diet.[13] Rice has been a
model plant for almost all genomics and molecular biology research owing to its small and
compact genome. This research is important because the fruits of such research are going to
affect major shift in food productivity and human nutrition.[12] Poor grain protein content in
rice is an important cause of widespread protein malnutrition among rice eating population
especially those residing in developing nations.[10] In India about 47% of children are
suffering from protein energy malnutrition (PEM) with infants suffering more from clinical
or sub clinical levels of protein deficiency.[16] However, rice is a poor source of essential
micronutrients such as Fe and Zn.[1] Micronutrient malnutrition, and particularly Fe and Zn
deficiencies (the so called „hidden hunger‟), affect over three billion people worldwide,
mostly in developing countries.[18]
Enhancing GPC of rice is a recent food based approach that has gained attention not only of
nutritionists and crop biologists but also of renowned economists all over the world.[4]
Recently, a sustainable solution to mineral malnutrition termed as „Biofortification‟ has been
proposed of crop plants through enhanced in the edible portions of crop plants through
agronomic intervention or genetic selection. Candidate gene approach is becoming a
Zote et al. World Journal of Pharmaceutical Research
Zote et al. World Journal of Pharmaceutical Research
traits in both the animal and plant systems. Candidate genes for economically important traits
have been potentially useful in plant breeding. Apart from high amount of consumption the
quality of protein of rice is considered as high because of better digestibility. To improve
nutritive value of rice the preliminary step is to characterize genetic variability for grain
protein content in germplasm and then to use this variability for breeding nutrient rich rice.[3]
The complex polygenic traits are governed by Quantitative Trait Loci (QTLs) thus
identification as well as characterization of QTLs controlling grain micronutrient contents in
rice harbors great potential for Markers assisted selection (MAS) and QTLs introgression
based breeding approaches to develop nutrient rich rice.
The candidate genes or DNA sequences with predicted functions serves as an important
source to generate novel molecular markers within a given QTL region which is likely to
show more stable association across the mapping populations or genetic stocks.[15] In this
context the present study was undertaken with in silico structural and functional
characterization of QTLs controlling GPC and micronutrient content and identification of
candidate gene based QTLs specific markers, phenotypic characterization of parents and
mapping population for grain micronutrient, protein and amino acid and genotyping of the
mapping population for validation of novel molecular markers.
MATERIALS AND METHODS
The present investigation was carried out at Department of Plant Molecular Biology and
Biotechnology, Indira Gandhi Krishi Vishwavidyalaya, Raipur (CG).
Materials
The plant material used for this study includes the rice cross developed by Swarna x
Morobreken and the F6 population of 73 lines. Seeds of both parents and population were
sown in pots under green house conditions for 2-3 weeks, in the Department of Plant
Molecular Biology and Biotechnology.
Before analyzing the rice samples for total grain protein, iron and zinc content, 50gms of
seeds of both parent and populations were subjected to dehusking by using polyurethane
Zote et al. World Journal of Pharmaceutical Research
Zote et al. World Journal of Pharmaceutical Research
Estimation of protein
Total protein content of brown rice grains of all samples were estimated by modified
micro-Kjeldahl method[7] and the distilled samples were titrated against the 0.05 N Sulfamic acid
until the first appearance of violate color as the end point. The titer value was used to
calculate percent Nitrogen, which is then used to estimate total protein content by using
conversion factor 5.95.[8]
Estimations of iron and zinc
Whole brown grains were subjected to di-acid mixture based digestion. Iron and zinc content
was estimated by using standard method described under[5] guidelines using Atomic
absorption spectrophotometer (AAS200).
Statistical analysis
The data obtained in present study was statistically analyzed using randomized block design,
for checking genetic differences within these advanced breeding lines. The different
parameters viz. standard deviation (SD), coefficient of variation (CV), coefficient of
correlation, standard error (SE) was calculated.
Characterization of QTLs controlling grain Fe/Zn content in rice
Five QTLs namely qFE-1, qFE-9, qZN-5, qZN-7 and qZN-11 reported to govern high grain
protein and FE/ZN content in rice by[9] were selected based on their higher phenotypic
variance and lower LOD value. These four QTLs are located on chromosome 1, 5, 7, 9, and
11 of rice respectively (Table 1).
Table 1 List of QTLs present between the markers. Sr.
No. QTL
Chromosome No.
Position on
chromosome Marker Interval
QTL length bp
BAC/PAC contig
1 qFE-1 1 41968722-42955596 bp RG236 – C112 986874 8
2 qFE-9 9 14648372-17837010 bp C472 – R2638 3188638 12
3 qZN-5 5 849198-1840480 bp R3166 - RG360 991282 8
4 qZN-7 7 3033385-4415836 bp RM234 – R1789 1382451 8
5 qZN-11 11 25472678-26529185 bp RG118-C794 1056507 12
Identification of co-localized expressed sequence tags (ESTs)
The metal homeostasis related candidate gene sequences were analyzed for presence of
known ESTs using PASA (Program to Assemble Spliced Alignments) program at TIGR rice
Zote et al. World Journal of Pharmaceutical Research
Zote et al. World Journal of Pharmaceutical Research
(http:// rgp.dna. aafrc.go. jp/E/ publicdata /estmap2001/). The PASA program resulted in
incorporation of high quality ESTs by transcript alignment in a genomic and full length
cDNA (fl-cDNA). ESTs identified for each gene was then characterized for respective
expression tissue library using digital northern and anatomy viewer search tools available in
rice ESTs database. ESTs corresponding to a tissue library provided information about
putative site of expression of the metal related genes in which it was identified.
Identification of Massive Parallel Signature Sequence (MPSS) tags
More than 20 MPSS libraries derived from diverse tissues root, leaves, stem, panicle and
germinating seeds abiotically stressed(cold, drought and salt) tissueshave been generated for
japonica cultivar Nipponbare grown under different conditions as light and dark, different
developmentalstages and several biological replicates. The search resulted in 17 and 20 nt
long MPSS tags, tag sequence, chromosome coordinate position, tissue library information
and transcript abundance values such as TPM (transcripts per million) value.
Designing of primers
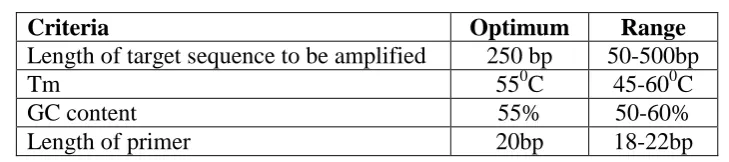
SSR primers were designed with selected putative SSR motifs using BatchPrimer-3 software.
Primer designing was done by putting the nucleotide sequences in FASTA format with
[image:5.595.114.479.480.561.2]different parameters as default setting (Table 2).
Table 2 Specifications for primer designing.
Criteria Optimum Range
Length of target sequence to be amplified 250 bp 50-500bp
Tm 550C 45-600C
GC content 55% 50-60%
Length of primer 20bp 18-22bp
PCR analysis to detect parental polymorphism and validation of molecular marker
The 73 lines belonging to F6 population derived from cross Swarna between and
Moroberekan were used to obtain SSR genotypic data. Total rice genomic DNA was
extracted from four-week old plants of the parental lines i.e. Swarna and Moroberekan as
well as the cross population by the method described by by Dellaporta method (Dellaporta et
al., 1983) and for quantification, 3 µl of the DNA samples isolated from each line, along with
standards of known quantity of DNA, was loaded on 0.8% agarose gel. After quantification,
Zote et al. World Journal of Pharmaceutical Research
Zote et al. World Journal of Pharmaceutical Research
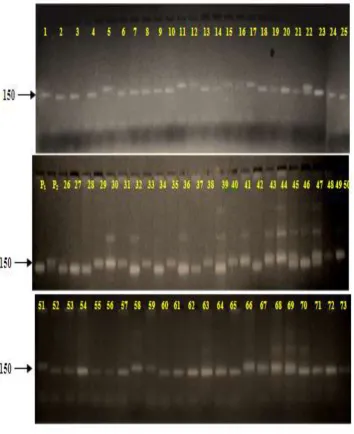
PCR analysis was done using the selected SSR and designed markers to identify the
polymorphic loci between the parental lines, Swarna and Moroberekan and their F6
population. Amplified products were resolved by electrophoresis on agarose gel along with
100 bp DNA ladder as molecular weight marker in 1X TAE buffer, and visualized with UV.
Gels were photographed for parental polymorphism by using digital camera under photodyne
of twenty two SSR primers. The primer exhibiting polymorphism on parents were further
screened against population of 73 lines. Genotypic data were generated with a set of
polymorphic primers. The banding pattern of population developed by each set of SSR
primer was scored separately as Swarna like allele (A), Morobereken like allele (B), and
Both alleles (H). QTL analysis was carried out in selected lines, single marker analysis was
used to estimate association between marker and trait by using„t‟- test.
RESULTS AND DISCUSSION
In silico characterization of the QTL region governing Iron and Zinc content in rice
The characterization of QTLs related to mineral content in rice grains was carried out by the
in silico approach. The QTLs selected for the study was previously identified by the.[9] Total
five QTLs qFE-1, qFE-9, and qZN-5, qZN-7, qZN-11known for governing grain iron and
zinc or QTLs AQTO33, AQTO34 protein content in rice were taken for the study. The details
of the QTLs including chromosomal location, position and marker interval are presented in
Table 3.
Table 3 Features of Quantitative Trait Loci known for governing Iron and Zinc content in rice.[9]
Sr.
No. QTL
Chromosome
No. Position on chromosome
Marker Interval
QTL length Bp
BAC/PA C contig
1 qFE-1 1 41968722-42955596 bp RG236-C112 986874 8
2 qFE-9 9 14648372-17837010 bp C472-R2638 3188638 12
3 qZN-5 5 849198-1840480 bp R3166-RG360 991282 8
4 qZN-7 7 3033385-4415836 bp RM234-R1789 1382451 8
5 qZN-11 11 25472678-26529185 bp RG118-C794 1056507 12
Two QTLs for Iron content in rice (qFE-1 and qFE-9), were found to be located on
chromosome number 1 and 9 respectively, and three QTLs responsible for zinc content
(qZN-5, qZN-7 and qZN-11), located on chromosome number (qZN-5, 7 and 11 respectively. Among all
the five QTLs, qFE-9 was the largest and qFE-1 was the smallest QTL in terms of size (bp).
Mining the genomic region of the target QTLs, revealed that all the five QTLs comprise
Zote et al. World Journal of Pharmaceutical Research
Zote et al. World Journal of Pharmaceutical Research
clones) and 12 BAC/PAC clones (6 BAC & 6 PAC clones) respectively, whereas QTLs
qZN-5, qZN-7, and qZN-11 include 8 (1BAC & 7PAC clones), 8 (4BAC & 4PAC clones) and 12
BAC clones respectively.
Identification of putative candidate genes in the target QTL regions
In this study, genes were also analyzed for the presence of predicted number of exons, which
revealed that gene major facilitator antiporter family underlying QTL qZN-7 has the highest
number of predicted exons (17) whereas the minimum number of exon was found to be one
and present underlying three genes encoding oxidoreductase/transition metal ion binding
protein, cation efflux family protein and transporter, major facilitator family protein (Table
4).
Identification of co-localized Expressed Sequence Tags (ESTs) underlying putative candidate genes
In the present study analyzed distribution of identified ESTs in different tissues to predict
putative site of expression of iron and zinc related putative candidate genes. Out of 9 iron and
zinc related 5 QTLs genes analyzed in silico, ESTs were identified in 7 genes (metal cation
transporter, oxidoreductase/ transition metal ion binding protein, 2Fe-2S iron-sulfur cluster
binding domain containing, cation efflux family protein, heavy metal-associated domain
containing protein, transporter, major facilitator family, ion channel nompc). A total of 113
ESTS were identified in 7 genes with maximum 64 ESTs in LOC_Os09g26650 2Fe-2S
iron-sulfur cluster binding domain containing gene and minimum 5 ESTs in LOC_Os05g03780
gene encoding cation efflux family protein. The ESTs identified in each gene were then
categorized according to their corresponding expression in tissue library such as flower,
panicle, seed, leaves, roots, stem to understand putative site of expression. Figure 1 shows total number of ESTs identified in each gene and their distribution in different tissue libraries.
The ESTs corresponding to the gene encoding cation efflux family protein were found to
express in callus, whole plant, shoot, flower, root callus, seed and leaf tissue libraries
suggesting expression of the gene in these tissues. The ESTs identified in major facilitator
family protein corresponded mostly to callus, flower, mixed, root and panicle tissues which
suggested reproductive phase specific expression of these genes in rice. It was observed that
ESTs overlapping cation efflux family protein also correlated to seed tissue suggesting role of
Zote et al. World Journal of Pharmaceutical Research
Zote et al. World Journal of Pharmaceutical Research
ESTs corresponding to root tissue which indicates that the above genes may participate in
uptake and transport of metal ions within plants.
Similarly OsZIP9 gene express in floral tissue (panicle, stigma and ovary) and developing
grains thus suggesting putative expression of OsZIP9 gene in reproductive plant parts. It was
also observe that these genes did not express in tissue libraries including seedling, anther,
stem, pistil and phloem etc showing their preferential expression in selected tissue types.
Characterization of putative candidate genes for grain iron and zinc content by MPSS signature analysis
A total of 35 MPSS tags (17 bp) were found corresponding to genes present in the QTLs
controlling iron and zinc content. Out of 21 MPSS tags, nine signature tags belonged to class
I (those present within the exonic region of the gene sequence) three belongs to II (within 500
bp potential 3_UTR) and class V (within intron, sense strand), one signature belonged class
III while five signatures belonged to class IV (unannotated). No tags belonging VI (within
intron, antisense strand) class of MPSS signature tags were identified. The abundance of a
MPSS tag in a tissue library (root, leaf, stem, meristematic, ovary, pollen, stigma, panicle and
developing seeds, germinating seedling) determined by its TPM (transcript per million) value
is an indirect measure of level of corresponding gene expression. A TPM value of less than 5
corresponds to very low level while TPM value between 5-15 shows basal level of expression
in Arabidopsis (Meyers et al., 2004), but only those MPSS tags having TPM > 15 in atleast
one tissue were included in the study. The MPSS analysis of gene encoding 2Fe-2S
iron-sulfur cluster binding domain containing protein belonging to the QTL qFE-9 revealed very
strong level of expression with the total TPM56388 value of and expressed in most of the
tissue libraries such as young root, mature root, stem, mature leaves, germinating seeds,
developing seed, meristematic tissue, roots, leaves, and under biotic and abiotic stresses, this
gene was prominently expressed in X. oryzae and M. grisea, while moderate expression level
Zote et al. World Journal of Pharmaceutical Research
Zote et al. World Journal of Pharmaceutical Research
[image:9.595.119.474.72.507.2]Zote et al. World Journal of Pharmaceutical Research
[image:10.842.11.842.110.520.2]Zote et al. World Journal of Pharmaceutical Research
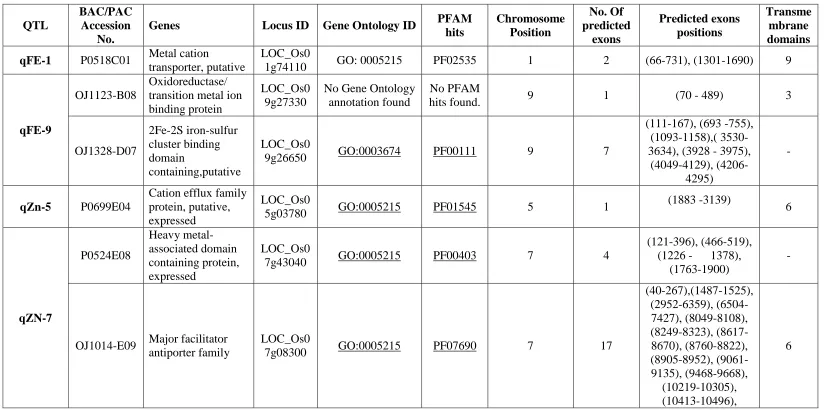
Table 4 Detail of Putative candidate genes with their Clone ID, locus ID, GO ID, PFAM hits, chromosome position, no. of exons and no of predicted transmembrane domain for QTLs governing Iron and Zinc content in rice.
QTL
BAC/PAC Accession
No.
Genes Locus ID Gene Ontology ID PFAM
hits Chromosome Position No. Of predicted exons Predicted exons positions Transme mbrane domains qFE-1 P0518C01 Metal cation
transporter, putative
LOC_Os0
1g74110 GO: 0005215 PF02535 1 2 (66-731), (1301-1690) 9
qFE-9
OJ1123-B08
Oxidoreductase/ transition metal ion binding protein
LOC_Os0 9g27330
No Gene Ontology annotation found
No PFAM
hits found. 9 1 (70 - 489) 3
OJ1328-D07 2Fe-2S iron-sulfur cluster binding domain containing,putative LOC_Os0
9g26650 GO:0003674 PF00111 9 7
(111-167), (693 -755), (1093-1158),( 3530-3634), (3928 - 3975),
(4049-4129), (4206-4295)
-
qZn-5 P0699E04
Cation efflux family protein, putative, expressed
LOC_Os0
5g03780 GO:0005215 PF01545 5 1
(1883 -3139) 6 qZN-7 P0524E08 Heavy metal-associated domain containing protein, expressed LOC_Os0
7g43040 GO:0005215 PF00403 7 4
(121-396), (466-519), (1226 - 1378),
(1763-1900)
-
OJ1014-E09 Major facilitator
antiporter family
LOC_Os0
7g08300 GO:0005215 PF07690 7 17
Zote et al. World Journal of Pharmaceutical Research
Zote et al. World Journal of Pharmaceutical Research
(10578-10664), (11094-11138), (11537-11578), (12025-12027).
qZN-11
OSJNBb009 F15
Transporter, major facilitator family, putative, expressed
LOC_Os1
1g08370 GO:0005215 PF07690 11 1 (1117-2403) 12
OSJNBb008 4H09
Ion channel nompc, putative, expressed
LOC_Os1 1g07980
No Gene Ontology
annotation found. PF00023 11 4
(1837-2115), (2294-2614), (2902-2949),
(4155-4277)
-
stigma and germinating seedling. Preferential expression of candidate genes was observed in the developing rice seeds indicating their role in the
grain loading of micronutrients which is the most important aspect of the biofortification programs with the ultimate goal of enrichment of
micronutrient in the edible plant part i.e. grain. The gene transporter, major facilitator family belonging to QTL qZN-11 showed the minimum
level of expression with TPM value of 71. This gene is expressed in ovary and mature stigma, callus, under abiotic stress, leaves, and developing
seeds. Rest six genes expressed at moderate level in the entire collection of tissue libraries. Higher expression level was observed for most of the
genes under X. oryzae and M. grisea infected tissue libraries. This finding indicates the dynamic role of these genes in activities of plant defense
and resistance related mechanisms. This finding is similar to the work of [19]. Computational expression profiling through EST and MPSS
signatures revealed a considerable degree of commonalties in the two sequence tag based approaches. Collectively LOC_Os07g08300 (qZN-7),
Grain micronutrient (Fe and Zn) contents in parents and mapping population
In this study grain iron and zinc content of F6 mapping population developed from the cross
between Swarna and Moroberekan was analyzed by using Atomic Absorption
Spectrophotometer (AAS200) as per [5] protocol. Swarna is a popular indica rice cultivar
having low grain Fe (8.63 μg/g) and Zn (14.38 μg/g) contents and Moroberekan is a japonica
rice genotype having high grain Fe (13.63 μg/g) and Zn (21.38 μg/g). The results of elemental analysis revealed that the brown grain iron content ranged from 9.68 to 15.83 μg/g with an average of 16.87 μg/g (Table 5) and brown grain zinc content ranged from 15.5 to 22.7 μg/g with an average of 25.76 μg/g in parents and mapping population.
Table 5 Mean whole brown grain Iron and Zinc concentration in μg/g of 73 rice lines with parents Swarna and Moroberekan.
Sr.
No. Genotypes
Mean iron ± SEm µg/g
Mean zinc ±SEm µg/g
Sr.
No. Genotypes
Mean iron ± SEm µg/g
Mean zinc ±SEm µg/g
1 Swarna 8.63±0.06 14.38 40 SM 38 12.84±0.26 19.6±0.18
2 Moroberekan 13.63±0.53 21.38 41 SM 39 11.85±4.31 20.34±0.76
3 SM 1 13.42±0.55 20.42±0.80 42 SM 40 11.25±4.61 19.84±0.51
4 SM 2 13.25±3.61 18.76±0.62 43 SM 41 12.86±027 19.9±0.06
5 SM 3 9.85±1.24 16.68±1.67 44 SM 42 11.98±0.17 18.42±0.20
6 SM 4 9.84±5.31 18.31±0.85 45 SM 43 12.43±0.05 16.96±1.52
7 SM 5 11.05±4.73 17.66±1.17 46 SM 44 13.02±0.35 19.45±0.28
8 SM 6 13.60±0.64 21.28±0.62 47 SM 45 12.4±4.03 18.31±0.85
9 SM 7 12.93±0.30 20.96±1.07 48 SM 46 12.46±4.00 17.56±1.22
10 SM 8 12.42±0.05 19.68±0.17 49 SM 47 17.83±1.31 18.26±0.87
11 SM 9 13.26±0.47 17.73±1.14 50 SM 48 14.01±3.22 15.91±2.05
12 SM 10 12.74±0.21 19.21±0.40 51 SM49 15.13±2.66 20.9±0.43
13 SM 11 13.52±0.60 16.28±1.87 52 SM 50 14.43±3.01 21.24±1.21
14 SM 12 12.74±0.21 17.9±1.04 53 SM 51 13.83±3.31 17.7±1.16
15 SM 13 11.35±4.56 17.03±1.49 54 SM 52 12.9±3.78 20.84±1.01
16 SM 14 13.63±3.41 17.68±1.17 55 SM 53 13.5±3.48 20.33±0.15
17 SM 15 13.25±0.46 21.28±1.23 56 SM 54 14.68±2.89 17.53±1.24
18 SM16 13.23±3.61 16.53±1.74 57 SM 55 14.13±3.16 14.93±2.54
19 SM 17 13.61±0.64 15.63±2.19 58 SM 56 13.37±3.54 17.88±1.07
20 SM 18 12.48±0.08 19.41±0.30 59 SM 57 12.36±0.02 18.45±0.78
21 SM 19 13.52±0.60 19.5±0.26 60 SM 58 12.48±0.05 16.08±1.97
22 SM 20 12.68±3.89 21.01±0.49 61 SM 59 12.48±0.08 20.48±0.83
23 SM 21 15.83±2.31 20.8±0.38 62 SM 60 12.46±0.07 18.96±0.07
24 SM 22 13.18±3.64 17.61±1.20 63 SM 61 13.61±3.42 20.42±0.80
25 SM 23 11.96±4.25 20.42±0.80 64 SM 62 12.84±0.26 18.58±0.72
26 SM 24 10.28±5.09 19.42±0.30 65 SM 63 10.46±0.93 19.51±0.25
27 SM 25 13.41±3.52 16.25±1.88 66 SM 64 11.68±4.39 19.80±0.49
28 SM 26 10.06±5.20 16.56±1.72 67 SM 65 13.2±3.63 19.36±0.32
[image:12.595.55.543.309.765.2]30 SM28 13.53±3.46 20.42±0.80 69 SM 67 12.51±3.97 18.24±0.29
31 SM 29 13.26±0.47 17.75±1.13 70 SM 68 12.82±0.25 17.96±0.43
32 SM 30 11.45±4.51 15.5±2.26 71 SM 69 12.32±0.00 18.16±0.92
33 SM 31 12.96±0.32 21.32±1.25 72 SM 70 11.68±0.32 20.42±0.80
34 SM 32 11.15±4.66 20.03±0.00 73 SM 71 12.42±0.05 19.45±0.28
35 SM 33 13.25±3.61 19.98±0.02 74 SM 72 12.42±0.05 20.23±0.10
36 SM 34 11.75±4.36 19.84±0.51 75 SM 73 9.68±5.39 20.42±0.80
37 SM 35 12.78±3.84 19.36±0.32
38 SM 36 13.2±3.63 17.3±1.36
39 SM 37 14.05±3.21 22.7±1.37
Variance 1.16µg/g (iron) and 2.74µg/g (zinc); SEm 7.05µg/g (iron) and 0.5636u/g (zinc); CV
[image:13.595.109.482.300.380.2]–8.16% (iron) and 6.6 % (zinc).
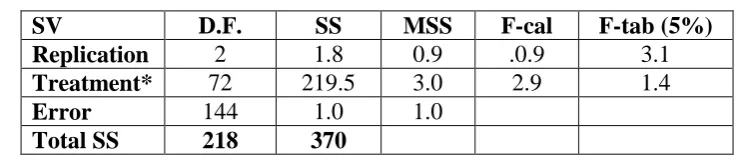
Table 6 ANOVA for grain Fe content.
SV D.F. SS MSS F-cal F-tab (5%)
Replication 2 1.8 0.9 .0.9 3.1
Treatment* 72 219.5 3.0 2.9 1.4
Error 144 1.0 1.0
Total SS 218 370
* Significant at 5% and 1% level of significance and 72 degrees of freedom.
Table 7 ANOVA for grain Zn content.
SV D.F. SS MSS F-cal F-tab (5%)
Replication 2 2.2 1.1 1.2 3.1
Treatment* 72 628.4 8.7 9.2 1.4
Error 144 137.4 1.0
Total SS 218 74890.36
* Significant at 5% level of significance and 72 degrees of freedom.
The frequency of the number of plants falling in each class indicated normal distribution of
the population for grain Fe and Zn trait (Figure 2 and Figure 3). The rice line SM 61
showed maximum grain Fe content (13.61 μg/g) which was more than Moroberekan and
maximum grain Zn content 21.32 μg/g was observed in rice line SM 31 which is higher than
0 2 4 6 8 10 12 14 16 18
0.5-10.5 10.5-15.5 15.5-20.5
Grain Fe Content
0 10 20 30 40 50
13.5-16.5 16.5-19.5 19.5-21.5 21.5-23.5
Grain Zn content
[image:14.595.181.413.75.370.2]Zn content µg/g
Figure 2 Frequency distribution of grain zinc content in cross Figure 3 Frequency distribution of grain iron content in cross population showing normal distribution. population showing normal distribution
Grain protein concentration
Whereas significant differences in protein and amino acid content among Japanese native
varieties were found, variety Brimful showed highest protein of 12.1% and lysine of
0.569g/100gm protein [15]. Wide variation for protein concentration in milled grains level
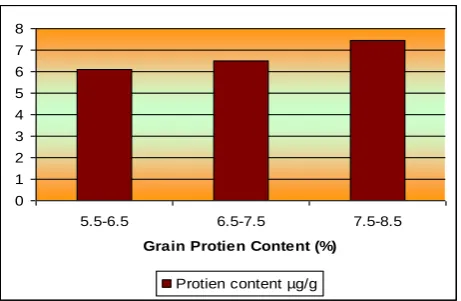
from 2.8% to 9.9% of rice germplasm lines of Chhattisgarh have been reported by [3] (Figure
4, Table 8 and 9).
0 1 2 3 4 5 6 7 8
5.5-6.5 6.5-7.5 7.5-8.5
Grain Protien Content (%)
Protien content µg/g
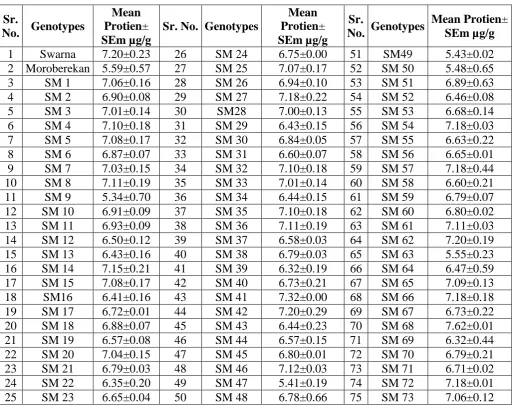
[image:14.595.183.414.594.744.2]Table 8 Mean whole brown grain protein. Sr.
No. Genotypes
Mean Protien± SEm µg/g
Sr. No. Genotypes
Mean Protien± SEm µg/g
Sr.
No. Genotypes
Mean Protien± SEm µg/g
1 Swarna 7.20±0.23 26 SM 24 6.75±0.00 51 SM49 5.43±0.02
2 Moroberekan 5.59±0.57 27 SM 25 7.07±0.17 52 SM 50 5.48±0.65
3 SM 1 7.06±0.16 28 SM 26 6.94±0.10 53 SM 51 6.89±0.63
4 SM 2 6.90±0.08 29 SM 27 7.18±0.22 54 SM 52 6.46±0.08
5 SM 3 7.01±0.14 30 SM28 7.00±0.13 55 SM 53 6.68±0.14
6 SM 4 7.10±0.18 31 SM 29 6.43±0.15 56 SM 54 7.18±0.03
7 SM 5 7.08±0.17 32 SM 30 6.84±0.05 57 SM 55 6.63±0.22
8 SM 6 6.87±0.07 33 SM 31 6.60±0.07 58 SM 56 6.65±0.01
9 SM 7 7.03±0.15 34 SM 32 7.10±0.18 59 SM 57 7.18±0.44
10 SM 8 7.11±0.19 35 SM 33 7.01±0.14 60 SM 58 6.60±0.21
11 SM 9 5.34±0.70 36 SM 34 6.44±0.15 61 SM 59 6.79±0.07
12 SM 10 6.91±0.09 37 SM 35 7.10±0.18 62 SM 60 6.80±0.02
13 SM 11 6.93±0.09 38 SM 36 7.11±0.19 63 SM 61 7.11±0.03
14 SM 12 6.50±0.12 39 SM 37 6.58±0.03 64 SM 62 7.20±0.19
15 SM 13 6.43±0.16 40 SM 38 6.79±0.03 65 SM 63 5.55±0.23
16 SM 14 7.15±0.21 41 SM 39 6.32±0.19 66 SM 64 6.47±0.59
17 SM 15 7.08±0.17 42 SM 40 6.73±0.21 67 SM 65 7.09±0.13
18 SM16 6.41±0.16 43 SM 41 7.32±0.00 68 SM 66 7.18±0.18
19 SM 17 6.72±0.01 44 SM 42 7.20±0.29 69 SM 67 6.73±0.22
20 SM 18 6.88±0.07 45 SM 43 6.44±0.23 70 SM 68 7.62±0.01
21 SM 19 6.57±0.08 46 SM 44 6.57±0.15 71 SM 69 6.32±0.44
22 SM 20 7.04±0.15 47 SM 45 6.80±0.01 72 SM 70 6.79±0.21
23 SM 21 6.79±0.03 48 SM 46 7.12±0.03 73 SM 71 6.71±0.02
24 SM 22 6.35±0.20 49 SM 47 5.41±0.19 74 SM 72 7.18±0.01
25 SM 23 6.65±0.04 50 SM 48 6.78±0.66 75 SM 73 7.06±0.12
Variance 7.7 SEm 3.72µg/g CV –7.79%.
Table 9 ANOVA for grain protein content.
SV D.F. SS MSS F-cal F-tab (5%)
Replication 2 0.239 0.12 0.41 3.1
Treatment* 72 47.75 0.66 2.30 1.4
Error 144 41.57 0.29
Total SS 218 89.57
* Significant at 5% level of significance and 72 degrees of freedom.
Identification of novel SSR markers
Genomic region underlying five selected QTLs for grain micronutrient (iron and zinc)
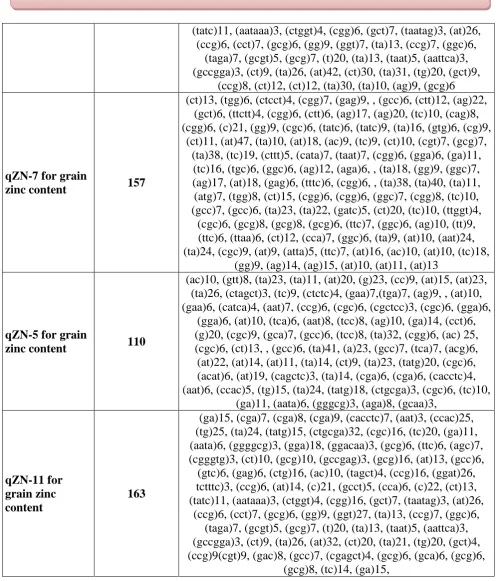
A total of 1063 puatative SSRs were identified within genomic region encompassing the five
QTLs including 152 loci in qFE-1, 482 loci in qFE-9,223 loci in qZn-5 and 157 loci in
qZN-7. Occurrence of di and tri-nucleotide repeats occurred more commonly in all identified SSRs
(Table 10). The tri-nucleotides repeats has been reported to be more common in eukaryotes
especially cereals and legumes plant genomes. The potential of putative SSR to be used as a
marker depends on repeat motif, number of repeats and position in gene.
Out of 1063 putative SSRs, 141 class I SSRs (more than 20 nt long) were selected such that
they covered each 100-200 Kb fragment of the QTLs in each question. Out of the total Class I
SSRs, 22 putative SSRs were found to be present in immediate vicinity of a metal transporter
or cross membrane transporter family protein or hypothetical protein encoding genes (Table
11) and were used to design ~ 22 nt primers using BatchPrimer-3 software. The newly designed primers from 22 novel SSRs loci were used to fine map the genomic region
encompassing five known QTLs controlling grain iron and zinc content.
Table 10 Total 1063 putative SSRs identified within five known QTLs controlling grain iron and zinc content in rice.
QTLs Putative SSRs Motifs
qFE-1 for grain iron content in rice
152
(acg)7, (tgg)6, (cag)6, (tcta)6, (gcc)7, (gtg)6, (ct)9, (tac)6, (ctgc)5, (gt)9, (ac)9, (gtt)6, (ta)26, (ta)40, (at)10, (g)23, (cc)9,
(at)19, (at)33, (ta)16, (ctagct)3, (tc)9, (ctctc)4, (gaa)7,(tga)7, (ag)9, , (at)10, (gaa)6, (catca)4, (aat)7, (ccg)6, (cgc)6, (cgctcc)3,
(cgc)6, (gga)6, (gga)6, (at)10, (tca)6, (aat)8, (tcc)8, (ag)10, (ga)14, (cct)6, (g)20, (cgc)9, (gca)7, (gcc)6, (tcc)8, (ta)32, (cgg)6, (c) 25, (cgc)6, (ct)13, , (gcc)6, (ta)41, (a)23, (gcc)7, (cgt)9, (gac)8, (gcc)7, (cgagct)4, (gcg)6, (gca)6, (gcg)6, (gcg)8, (tc)14, (ga)15, (tca)7, (acg)6, (c)22, (at)14, (at)11, (ta)14, (ct)9,
(ta)23, (tatg)20, (cgc)6, (acat)6, (at)19, (cagctc)3, (ta)14, (aat)26, (atta)5, (ataac)5, (attagc)3, (aag)10, (ctc)7, (tttttc)3,
(ttctc)4, (aatca)4, (tc)9, (ggt)6, (ggt)6, (tt)11, (at)25, (at)20, (aaag)5, (gat)7, (ctg)6, (ga)9, (gaa)6, (cttt)5, (aag)6, (aag)14,
(gt)20, (ta)13,(tatg)6, (ta)10, (ta)15, (gac)7
qFE-9 for grain iron content in rice
482
(ag)9, (ata)6, (tctt)6, (gt)9, (cgc)7, (gag)8, (tc)9, (tga)6, (cgg) 6, (tgga)5, (aaacaa)3, (ag)15, (gcgaga)3, (ct)17, (cgccgt)3, (cgccgt)3, (at)42, (tg)16, (tct)6, (ggc)6, (ttc)22, (ttaa)6, (ag)10,
(at)13, (ag)15, (cag)6, (aat)10, (gga)8, (ggc)6, (ccg)6, (cgg)6, (gcaggt)3, (ta)10, (ga)14, (cga)6, (cga)6, (cga)6, (cacctc)4, (aat)6, (ccac)5, (tg)15, (ta)24, (tatg)18, (ctgcga)3, (cgc)6, (tc)10,
(ga)11, (aata)6, (ggggcg)3, (gga)8, (ggacaa)3, (gcg)6, (ttc)6, (agc)7, (cgggtg)3, (ct)10, (gcg)10, (gccgag)3, (gcg)6, (at)13, (gcc)6, (gtc)6, (gag)6, (ctg)6, (ac)10, (tagct)4, (ccg)6, (ggat)6,
(tatc)11, (aataaa)3, (ctggt)4, (cgg)6, (gct)7, (taatag)3, (at)26, (ccg)6, (cct)7, (gcg)6, (gg)9, (ggt)7, (ta)13, (ccg)7, (ggc)6,
(taga)7, (gcgt)5, (gcg)7, (t)20, (ta)13, (taat)5, (aattca)3, (gccgga)3, (ct)9, (ta)26, (at)42, (ct)30, (ta)31, (tg)20, (gct)9,
(ccg)8, (ct)12, (ct)12, (ta)30, (ta)10, (ag)9, (gcg)6
qZN-7 for grain
zinc content 157
(ct)13, (tgg)6, (ctcct)4, (cgg)7, (gag)9, , (gcc)6, (ctt)12, (ag)22, (gct)6, (ttctt)4, (cgg)6, (ctt)6, (ag)17, (ag)20, (tc)10, (cag)8, (cgg)6, (c)21, (gg)9, (cgc)6, (tatc)6, (tatc)9, (ta)16, (gtg)6, (cg)9,
(ct)11, (at)47, (ta)10, (at)18, (ac)9, (tc)9, (ct)10, (cgt)7, (gcg)7, (ta)38, (tc)19, (cttt)5, (cata)7, (taat)7, (cgg)6, (gga)6, (ga)11,
(tc)16, (tgc)6, (ggc)6, (ag)12, (aga)6, , (ta)18, (gg)9, (ggc)7, (ag)17, (at)18, (gag)6, (tttc)6, (cgg)6, , (ta)38, (ta)40, (ta)11, (atg)7, (tgg)8, (ct)15, (cgg)6, (cgg)6, (ggc)7, (cgg)8, (tc)10, (gcc)7, (gcc)6, (ta)23, (ta)22, (gatc)5, (ct)20, (tc)10, (ttggt)4,
(cgc)6, (gcg)8, (gcg)8, (gcg)6, (ttc)7, (ggc)6, (ag)10, (tt)9, (ttc)6, (ttaa)6, (ct)12, (cca)7, (ggc)6, (ta)9, (at)10, (aat)24, (ta)24, (cgc)9, (at)9, (atta)5, (ttc)7, (at)16, (ac)10, (at)10, (tc)18,
(gg)9, (ag)14, (ag)15, (at)10, (at)11, (at)13
qZN-5 for grain
zinc content 110
(ac)10, (gtt)8, (ta)23, (ta)11, (at)20, (g)23, (cc)9, (at)15, (at)23, (ta)26, (ctagct)3, (tc)9, (ctctc)4, (gaa)7,(tga)7, (ag)9, , (at)10, (gaa)6, (catca)4, (aat)7, (ccg)6, (cgc)6, (cgctcc)3, (cgc)6, (gga)6,
(gga)6, (at)10, (tca)6, (aat)8, (tcc)8, (ag)10, (ga)14, (cct)6, (g)20, (cgc)9, (gca)7, (gcc)6, (tcc)8, (ta)32, (cgg)6, (ac) 25, (cgc)6, (ct)13, , (gcc)6, (ta)41, (a)23, (gcc)7, (tca)7, (acg)6, (at)22, (at)14, (at)11, (ta)14, (ct)9, (ta)23, (tatg)20, (cgc)6, (acat)6, (at)19, (cagctc)3, (ta)14, (cga)6, (cga)6, (cacctc)4, (aat)6, (ccac)5, (tg)15, (ta)24, (tatg)18, (ctgcga)3, (cgc)6, (tc)10,
(ga)11, (aata)6, (gggcg)3, (aga)8, (gcaa)3,
qZN-11 for grain zinc content
163
(ga)15, (cga)7, (cga)8, (cga)9, (cacctc)7, (aat)3, (ccac)25, (tg)25, (ta)24, (tatg)15, (ctgcga)32, (cgc)16, (tc)20, (ga)11, (aata)6, (ggggcg)3, (gga)18, (ggacaa)3, (gcg)6, (ttc)6, (agc)7, (cgggtg)3, (ct)10, (gcg)10, (gccgag)3, (gcg)16, (at)13, (gcc)6,
(gtc)6, (gag)6, (ctg)16, (ac)10, (tagct)4, (ccg)16, (ggat)26, tctttc)3, (ccg)6, (at)14, (c)21, (gcct)5, (cca)6, (c)22, (ct)13, (tatc)11, (aataaa)3, (ctggt)4, (cgg)16, (gct)7, (taatag)3, (at)26,
(ccg)6, (cct)7, (gcg)6, (gg)9, (ggt)27, (ta)13, (ccg)7, (ggc)6, (taga)7, (gcgt)5, (gcg)7, (t)20, (ta)13, (taat)5, (aattca)3, (gccgga)3, (ct)9, (ta)26, (at)32, (ct)20, (ta)21, (tg)20, (gct)4, (ccg)9(cgt)9, (gac)8, (gcc)7, (cgagct)4, (gcg)6, (gca)6, (gcg)6,
[image:17.595.49.552.49.631.2](gcg)8, (tc)14, (ga)15,
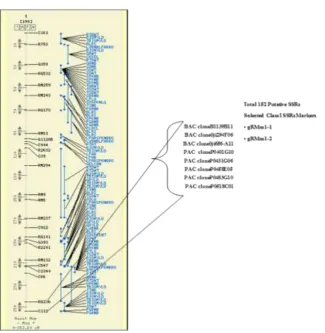
Table 11 Genes present in the region encompassing 22 selected class -1 SSR loci. QTL Sr. No. Primer Encompassing gene Function
qFE-1
1 gRMm1-1 LOC_Os01g73590 Transporter family protein,
putative
2 gRMm1-2 LOC_Os01g74110 Metal cation transporter,
4 gRMm9-2 LOC_Os09g26460 Protein binding protein, putative
5 gRMm9-3 LOC_Os09g27330 Oxidoreductase/ transition
metal ion binding protein
6 gRMm9-4 LOC_Os09g26650
2Fe-2S iron-sulfur cluster binding domain containing, putative
7 gRMm9-5 LOC_Os09g26900 ctr copper transporter family
protein, putative,
8 gRMm9-6 LOC_Os09g27580 Potassium transporter,
putative,
9 gRMm9-7 LOC_Os09g28610 Protein transport protein,
putative,
10 gRMm9-8 LOC_Os09g26290 Amino acid transporter family
protein,
11 gRMm9-9 LOC_Os09g28160
Phosphate carrier protein, mitochondrial precursor, putative,
12 gRMm9-10 LOC_Os09g27960 Transmembrane protein 50A,
putative,
13 gRMm9-11 LOC_Os09g29430 Citrate transporter, putative,
14 gRMm9-12 LOC_Os09g24980 Vesicle transport v-SNARE
protein, putative,
qZn-5 15 gRMm5-1 LOC_Os05g03000 Ion channel nompc, putative,
qZN-7
16 gRMm7-1 LOC_Os07g43040
LTPL56 - Protease
inhibitor/seed storage/LTP family protein precursor, expressed
17 gRMm7-2 LOC_Os07g43040
Heavy metal-associated domain containing protein, expressed
qZN-11
18 gRMm11-1 LOC_Os11g0760
ABC-2 type transporter domain containing protein, expressed
19 gRMm11-2 LOC_Os11g06820
Transmembrane amino acid transporter protein, putative, expressed
20 gRMm11-3 LOC_Os11g06410 Homeodomain, putative,
expressed
21 gRMm11-4 LOC_Os11g08370 Transporter, major facilitator
family, putative, expressed
22 gRMm11-5 LOC_Os11g07980 Ion channel nompc, putative,
expressed
Validation of identified SSRs markers
Parental polymorphism analysis using SSR primers
In this study cross validated 34 previously designed primers and 4 known random rice
to detect any polymorphism between the parents Swarna and Moroberekan. Out of a total of
38 markers screened, 18 markers showed polymorphism between the two parents Swarna and
Moroberekan (Figure 5). The monomorphic or polymorphic amplification of the 34 new
SSRs generated based on the 5 QTLs for grain iron and zinc content in rice have validated
them as new generation genomic DNA based markers. This finding shows a higher level of
polymorphism/ differences in the sequences of the indica and japonica subspecies of rice in
the QTL region under study. Out of 18 polymorphic primers, 5 primers were selected
[image:19.595.136.462.242.576.2]randomly and were used for co segregation studies in the mapping population.
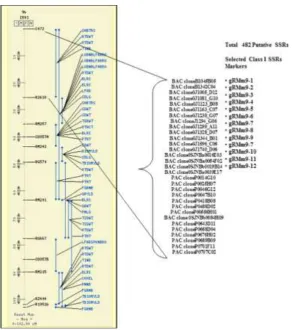
Figure 5 Map position of QTL qFE-1 on Ch # 1 along with co-localized putative SSRs markers identified.
SSR based genotyping of mapping population
The five novel SSRs showing polymorphism with parents were selected for genotyping of the
mapping population. The genotypic data thus generated (Figure 6) was analyzed for
segregation of Swarna and Moroberekan like alleles in the population. The Scoring of bands
Moroberekan like allele in the breeding lines, while some of the lines showed both Swarna
and Moroberekan like alleles and thus were considered as heterozygous. It was found that the
Swarna contributed about 50.1% of its trait (on the mean basis) whereas the Moroberekan
contributed about 44.93% of its trait on similar basis. The variation in trait was represented
departure from the theoretically expected ratio of 1:1 i.e. equal contribution from both the
parents. The rice lines showing Swarna like allele were found to carry low Fe and Zn content
while those showing Moroberekan like allele showed comparatively higher grain Fe/Zn
content. Yet many rice lines of mapping population having Moroberekan like allele were
found to contain lesser grain micronutrient contents. All the 5 polymorphic novel SSRs
[image:20.595.142.440.288.619.2]markers show a significant deviation from the expected 1:1 ratio.
Figure 7 Map position of QTL qZN-5 on Ch # 5 along with co-localized putative SSRs markers identified.
[image:21.595.157.438.418.717.2]Figure 9 Map position of QTL qZN-11 on Ch # 11 along with co-localized putative SSRs markers identified.
Association mapping
Single marker association mapping technique was used to identify the association of SSRs
markers to iron, zinc contents in brown rice grains. „t‟ value was determined for each of the
polymorphic primer to analyze its significant association to grain micronutrient content
which is presented in the Figure 10, Table 15 was checked with „t‟ value at 72 degree of freedom at 5% level of significance. The analysis revealed that the polymorphic marker
gRMm33-3 was significantly associated to grain Iron and Zinc contents. Similarly 4 markers
namely gRMm7-2, gRMm7-3, gRMm33-2 and gRMm34-1 showed significant associations
with grain Iron and Zinc content. Determination of association of a marker with a trait is the
basic principal of association mapping. The mapping population is partitioned into different
phenotypic classes based on the variability for the trait. The correlative statistical analysis of
the genotypic data of the marker locus for individual genotype is performed with the
phenotypic classes and forms the basis of association mapping. The failure of independent
segregation of marker loci with the phenotypic class is said to display “linkage
disequilibrium”[14]
statistical methods and softwares have been developed to determine association of marker
loci with a trait including Single Marker Analysis, interval mapping, MAPMAKER, QTL
mapper and Q Gene etc.[21, 20]
Table 15 ‘t’- test of the polymorphic primers for Zn and Fe content. Sr.
No. Primer Chromosome
t-value (Zinc)
t-value (Iron)
Association with grain Fe content
Association with grain Zn content
1 gRMm7-3 7 851.16 1343 Associated Associated
2 gRMm34-1 3 463.12 661 Associated Associated
3 gRMm33-2 2 956.52 1449 Associated Associated
4 gRMm33-3 2 1074.66 1630 Associated Associated
5 gRMm7-2 7 492.15 690 Associated Associated
Figure 10 Parental polymorphism profile using QTL specific SSR marker M- marker, P1-Swarna, P2- Moroberkan.
CONCLUSIONS
The grain protein content of different rice lines of population derived from cross between
Swarna and Moroberekan ranged from 5.34 to 7.18% with an average of 9.23%.
The brown grain Iron content ranged from 9.68 to 19.98 μg/g with an average of 16.87
μg/g while, the brown grain Zinc content was found to range from 15.5 to 20.84 μg/g with an average of 25.76 μg/g, in mapping population. The coefficient of variation (CV) for
grain Fe and Zn content was found to be 8.16 % and 6.6 %, respectively. The analysis of
variance using Randomized Block Design (RBD) indicated significant variation in grain
Fe, Zn and protein content among 73 rice lines belonging to Swarna X Moroberekan
[image:23.595.63.528.156.462.2] A total of 1063 SSRs have been identified in the genomic region of 5 known QTLs and
twenty two novel SSR primers have been designed from the selected Class I SSR loci
which are needed to be experimentally validated in the mapping population.
Out of a total of 38 previously designed primers, 18 have shown polymorphism between
the parents Swarna and Moroberekan. This indicates a higher level of sequence
differences and polymorphism between the indica and japonica subspecies of rice in the
QTL regions under study.
The co-segregation analysis for phenotypic and SSR genotypic data generated from the F6
population revealed that 60% were Swarna like alleles and 35% were Moroberekan like
alleles.
The association analysis between the markers and trait revealed that three novel QTL specific
SSRs markers namely gRMm7-2, gRM 7-3 gRMm33-2 and gRMm34-1 were associated to
grain iron content and zinc. Significant association was found between the novel SSRs
markers and grain Fe and Zn contents in rice for the QTL analyzed in the study.
ACKNOWLEDGEMENT
Authors are grateful to Department of Biotechnology, Govt. of India for proving the funds
and the work was done as an post graduate programme, so the authors are especially grateful
to the Professor and Head of Department, I.G.K.V.V., Raipur (CG) for representing their help
and support in pursuing this work.
REFERENCES
1. Bouis, H. E., Graham, R. D. and Welch, R. M. The Consultative Group on International
Agricultural Research (CGIAR) micronutrients project: justification and objectives. Food
and Nutrition Bulletin, 2010; 21: 374–381.
2. Chandel, G., Dudhare, M. S., Saluja, T., Shiva, S. M., Sharma, Y., Geda, A. K., Sahu, G.
R., Mishra, V. N. and Katiyar, S. K. 2005. Screening rice accessions for nutritional
quality trait to to achieve nutritionally balanced rice. In 5th international Rica Genetics
Symposium. Nov.19-23. 60-61.
3. Dellaporta, S. L., Wood, J. and Hicks, J. B. A plant DNA minipreparation: Version II,
Plant Mol. Bio. Rep., 1983; 1(14): 19-21.
4. Frei R. L., and Becker, M. A. The genome sequence and structure of rice chromosome 1.
Nature, 2002; 420: 312-316.
6. Harvest Plus. 2006. Annual Report.
7. Hunnel, J. and Moritaka, K. In: Iron Fortification of Foods F. Clyesdale, K. Wiemen
(Eds.), Academic Press, Orlando, USA., 1985; 121-132.
8. Johry, R. P., Singh, S. P., Shrivastava, K. N., Gupta, H. O. and Lodha, M. L. Chemical
and biological evaluation of nutritional quality of food grains:a laboratory manual. ICAR,
New Delhi Publication., 2000; 2-11.
9. Juliano, B. O. Grain structure composition and consumers criteria for quality. In: Rice in
human nutrition. Int. Rice Res. Inst., Manila, Philippines, 1993; 35-59.
10.Kaiyang, Lu., Lanzhi, Li., Xingfei, Zheng., Zhihong, Zhang., Tongmin, Mou and
Zhongli, H.u. Quantitative trait loci controlling Cu, Ca, Zn, Mn and Fe content in rice
grains. Journal of Genetics, 2008; 87(3): 305-310.
11.Lozoff B., Nutr. Rev., 2006; 64: S34.
12.Meyers, B. C., Galbraith, D. W., Nelson, T., Agrawal, V. Methods for Transcriptional
Profiling in Plants. Be Fruitful and Replicate. Plant Physiology, 2004; 135: 637–652.
13.Parvez S and Rather A. G. QTL analysis in rice improvement: Concep, methodology and
application. Biotechnology, 2007; 6: 1-13.
14.Philip, J. White and Martin, R. Broadley. Biofortifying crops with essential mineral
elements. Trends in Plant Science, 2000; 10(12): 586-593.
15.Prasanna, B. M. QTL mapping and its application in crop plant. Indian Agricultural
Research Institute. PUSA, New Delhi., 2008; 1-8.
16.Singh, R. K., Gautam, P. L., Saxena, S. and Singh, S. 2000. Scented Rice germplasm;
Conservation, evaluation and utilization. In: Aromatic Rice, 107-131.
17.Thorup G. L. and Kearsey F. D. The principles of QTL analysis (a minimal mathematics
approach). J. Exp. Bot, 2000; 49: 1619-1623.
18.UNICEF. Vitamin and Mineral Deficiency: A global progress report. 2005; Ottawa and
New York.
19.Wang, Z., Taramino, G., Yang, D., Liu, G., Tingey, S., Miao, G., and Wang, G. Rice
ESTs with disease-resistance gene-or defense response gene-like sequences mapped to
regions containing major resistance genes or QTLs. Mol. Genet. Genomics, 2005; 265:
310.
20.Welch, R. M. and Graham, R. D. Breeding for micronutrient in staple food crops from a
21.Yang W, Liu Y, Chen L, Gao T, Hu B, Zhang D, Liu F, Zinc uptake regulator (zur) gene
involved in zinc homeostasis and virulence of Xanthomonas oryzae pv. oryzae in rice.
Current Microbiology, 2007; 54: 307-314.