RP-HPLC METHODE DEVELOPMENT AND VALIDATION FOR
ESTIMATION OF “CAPECITABINE” AS API & DOSAGE FORM
Priya Vishwanath Mijgar1*, Shilpa Pandharinath Dakhurkar2, Snehal Dilip Wani3,
Prachi Madhukar Murkute4
1
Shree Bhagwan College of Pharmacy, Aurangabad.
2,3,4
Rajesh Bhaiyya Tope College of Pharmacy, Nipani –Bhalgaon, Aurangabad.
ABSTRACT
A simple, specific, accurate, and precise reverse phase high
performance liquid chromatographic method was developed and
validated for the estimation of Capecitabine in tablet dosage forms. A
C18column having 250 × 4.6 mm and mobile phase containing
Methanol: Water (50:50v/v) was used. The flow rate was 1.0 ml/min
and effluents are monitored at 241 nm. The retention time of
Capecitabine is 3.15 min. The method was validated for specificity,
linearity, accuracy, precision, limit of quantification, limit of detection,
robustness in accordance with ICH guidelines. Limit of detection and
limit of quantification for estimation of Capecitabine found to be 2.13 µg/ml and 6.46 µg/ml.
Recovery of Capecitabine in tablet formulation was found to be 98.64%. Proposed method
was successfully applied for the quantitative determination of Capecitabine in commercially
available tablet dosage forms.
KEYWORDS: Capecitabine, RP-HPLC Method development, Validation.
INTRODUCTION
Analytical chemistry is defined as “The science and the art of determining the composition of
materials, which deals with both theoretical, practical science. In analytical chemistry it is of
prime importance to gain information about the qualitative and quantitative composition of
substances and chemical species. Pharmaceutical analysis deals medicaments and their
precursors. Quality is important in every product. Quality control is a concept, which strives
to produce a perfect product. Physico-chemical methods are used to study the physical
phenomenon that occurs as a result of chemical reactions. Physico-chemical methods are
Volume 8, Issue 1, 1499-1508. Research Article ISSN 2277– 7105
Article Received on 22 Nov. 2018,
Revised on 12 Dec. 2018, Accepted on 02 Jan. 2019
DOI: 10.20959/wjpr20191-14015
*Corresponding Author
Priya Vishwanath Mijgar
Shree Bhagwan College of
optical, photometry (photocolorimetry and spectrophotometry covering UV-Visible, IR
Spectroscopy and nepheloturbidimetry) and chromatographic (column, paper, thin layer, gas
liquid and high performance liquid chromatography) methods. Modern pharmaceutical
analysis must need the following requirements. 1. The analysis should take a minimal time. 2.
The accuracy of the analysis should meet the demands of Pharmacopoeia. 3. The analysis
should be economical. 4. The selected method should be precise and selective.
Chromatography: The term chromatography was first used by the Russian chemist and
botanist Michael Tswett in 1906. The term chromatography is derived from the Greek words:
Chroma for colour and Graphein to write. “Chromatography is a physical method of
separation in which the components to be separated are distributed between two phases, one
of which is stationary while the other moves in a definite direction.
Drug profile
Name: Capecitabine
Structure:
Figure 1: Structure of capacitabine.
Description
Capecitabine is prodrug which is enzymatically changed to 5- flurouracil in tumor and stop
DNA synthesis there by reduce growth of the tumor tissue. It is orally administered
chemotherapeutic drug which has a very good potency in the treatment of various kinds of
cancer diseases especially in the therapy of colorectal cancer, breast cancer, gastric cancer,
and esophageal cancer.
IUPAC name: Pentyl
N-{1-[(2R,3R,4S,5R)-3,4-dihydroxy-5-methyloxolan-2-yl]-5-fluoro-2-oxo-1,2-dihydropyrimidin-4-yl}carbamate.
Chemical formula: C15H22F3N3O6
Molecular mass: 359.35g/mol
Melting point: 110-121℃
Solubility: Water solubility is 26 mg/ml. It is soluble in ethanol, methanol and DMF.
pka: 5.41
t1/2: 45-60 min
MATERIAL AND METHOD
Materials
Capecitabine obtained from swapnroop drug agency, Aurangabad.
Instrument
The analysis of the drug was carried out on thermofisher gradient system UV detector.
Equipedv with C18 column (250 × 4.6 mm) and running chromoquest 4.1 software.
Selection of detection of wavelength
The UV spectrum of diluted solution of various concentration of Capecitabine in mobile
phase was recorded using a UV spectrophotometer. The wavelength of maximum absorbance
was observed at 241nm. This wavelength was used for detection of Capecitabine.
Preparation of Mobile phase
The aim is to find the correct concentration of the mobile phase. The mobile phase and its
strength is a measure ability to pull analytes from the column. In reverse phase HPLC with
aqueous mobile phases such as Methanol and water (50:50v/v). The retention time is also
important criteria for selection of mobile phase.
Preparation of standard stock solution
An accurately weighed quantity pure powder of Capecitabine (25 mg) was transferred to
50ml volumetric flask dissolved and diluted to the mark with mixture of methanol and water
in the ratio of 50:50. The volume was made up to the mark using same mixture of mobile
phase to get final concentration 500µg/ml.
Preparation of sample solution
10 tablet label claim 500mg Capecitabine IP (CAPECAD, Ciplapharma ltd.) were weighed
and crushed into fine powder. The amount of powder equivalent to 25mg of Capecitabine
was weighed and transferred into the 50ml of mobile phase. The resulting solution was
filtered through 0.45µ membrane filter and sonicated for 20 min in two cycles each of 10
Optimized method for Capecitabine
Chromatographic condition
Parameter Optimized Condition
Column :C18 column(4.6m 250mm)
Mobile phase :Methanol: water (50:50)
Detection wavelength :241nm
Flow rate :1.0 ml/min
Column temperature :Ambient
Sample size :10µl
Run time :6.0 min
System suitability testing
Preparation of working solution
From freshly prepared standard stock solution (500µg/ml), 1.0ml stock solution was pipetted
out and diluted upto 10ml to obtain consequential solution of 50µg/ml. The resulting solution
was filtered through 0.45µ membrane filter and sonicated for three cycles each of
10min.Three replicatesof this solution were injected and result were recorded for RT, area,
tailing factor, theoretical plates, SD, %RSD were calculated for the results and other
parameters are shown in Table 1.
Method Validation
Linearity
The linearity of an analytical procedure is its ability to obtain test results, which are directly
proportional to the concentration of analyte in the sample. A linear relationship should be
evaluated across the range of the analytical procedure. It is demonstrated directly on the drug
substance by dilution of a standard stock solution of the drug product components, using the
proposed procedure. For the establishment of linearity, minimum of Six concentrations is
recommended by ICH guideline. The value of correlation co-efficient should fall around
0.99. The regression equation and correlation coefficient was calculated and found to be
within the required limits as shown in Tables 2 and 3 respectively.
Precision
The precision of an analytical procedure expresses the closeness of agreement between a
series of measurements obtained from multiple sampling of the same homogeneous sample.
The precision of an analytical procedure is usually expressed as the variance, standard
deviation or coefficient of variation of a series of measurements. The intra-day and inter-day
Accuracy/Recovery
The accuracy of an analytical procedure expresses the closeness of agreement between the
value which is accepted either as a conventional true value or an accepted reference value and
the value found. The evaluation of accuracy has got very prime importance as it deliberately
force the method to extract the drug and impurities at higher and lower level. The recovery
results for accuracy study of capecitabine were represented in Table 5.
Robustness
The robustness of an analytical procedure is a measure of its capacity to remain unaffected by
small but deliberate variations in method parameters and provides an indication of its
reliability during normal usage. The results of robustness study were shown in Tables 6 & 7
respectively.
Limit of detection and limit of quantification
Limit of detection is the lowest concentration in a sample that can be detected, but not
necessarily quantified under the stated experimental conditions. The limit of quantification is
the lowest concentration of analyte in a sample that can be determined with acceptable
precision and accuracy. Limit of detection and limit of quantification was calculated using
following formula LOD= 3.3SD/S and LOQ= 10SD/S, where the SD= standard deviation of
response (peak area) and S= slope of the calibration curve.
RESULT AND DISCUSSION
System suitability test
To optimize the chromatographic conditions, the effect of chromatographic variables such as
composition of mobile phase, flow rate and the column were studied. The resulting
chromatograms were recorded and the chromatographic parameters such as peak area,
resolution and theoretical plates were integrated. The conditions obtained most excellent
Minutes
0.0 0.2 0.4 0.6 0.8 1.0 1.2 1.4 1.6 1.8 2.0 2.2 2.4 2.6 2.8 3.0 3.2 3.4 3.6 3.8 4.0 4.2 4.4 4.6 4.8 5.0
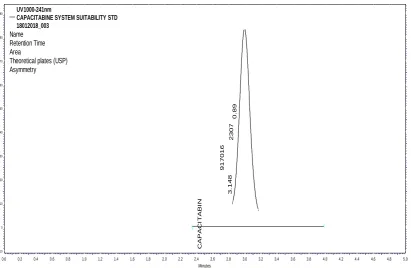
m A U -10 0 10 20 30 40 50 60 70 80 90 m AU -10 0 10 20 30 40 50 60 70 80 90 C A P A C IT A B IN 3 .1 4 8 917016 2307 0 .8 9 UV1000-241nm
CAPACITABINE SYSTEM SUITABILITY STD 18012018_003
Name Retention Time Area
[image:6.595.93.505.76.344.2]Theoretical plates (USP) Asymmetry
Fig. 1: Chromatogram of system suitability.
Table 1: System suitability parameter.
Sr.no System suitability parameter
Mean observation
Standard
limits Inference
1 Retention time 3.15 NLT 2.0min Passed
2 Area 916877 NLT 2000 Passed
3 Theoretical plate 23265 NLT 2000 Passed
4 Tailing factor 0.88 NMT 2.0 Passed
5 % RSD 0.59 NMT2.0% Passed
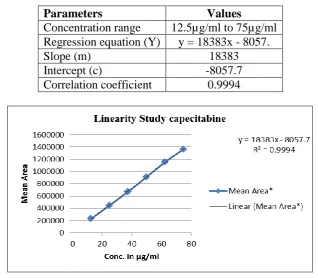
Linearity
The standard calibration curve was constructed between concentration Vs peak area and
linearity was found in the range from 12.5µg/ml to 75µg/ml. The regression equation and
[image:6.595.203.393.638.736.2]correlation coefficient was calculated and found to be within the required limit.
Table 2: Linearity data of Capecitabine.
Sr. no. Conc. µg/ml Mean Area*
1 12.5 229123
2 25 447707
3 37.5 668099
4 50 911802
5 62.5 1157138
Table 3: Results for Linearity.
Parameters Values
Concentration range 12.5µg/ml to 75µg/ml Regression equation (Y) y = 18383x - 8057.
Slope (m) 18383
Intercept (c) -8057.7
Correlation coefficient 0.9994
Fig. 2: Calibration curve of Capecitabine.
Precision
Precision Intra-day precision was investigated by replicate applications and measurements of
peak area for Capecitabine for three times on the same day under similar conditions.
Inter-day precision was obtained from %RSD values obtained by repeating three times on two
different days. The %RSD was calculated which was within the acceptable limits of not more
than 2.0.
Table 4: Results of Precision.
Conc.(µg/ml) Intra-day precision Inter-day Precision
Mean± SD % RSD Mean± SD % RSD
20 378830.7±859 0.23 379653±1778.1 0.47
35 645733±5353.45 0.83 345609±1897.8 0.29
70 1320003±2502.4 0.13 1323303±1858.4 0.22
Accuracy/ Recovery
The accuracy of the method was tested by triplicate sample at 3 different concentrations
equivalent to 75%, 100% and 125% of the active ingredient, by adding a known amount of
Capecitabine standard to a sample with predetermined amount of Capecitabine. The
recovered amount of Capecitabine, % recovery of each concentration was calculated to
Table 5: Results of Accuracy/ Recovery.
Sr No
% Recover
y Level
Amount of Standard Taken (μg/ml)
Amount of Sample Spiked
(μg/ml)
Mean Area*
Amount Recovered
(μg/ml)
% recovery
1 80 50 40 1652664 90 100.37
2 100 50 50 1805337 100 98.64
3 120 50 60 2012869 110 99.94
Robustness
Robustness is the ability to provide accurate and precise results under a variety of conditions.
In order to measure the extent of method robustness, the most critical parameters were
interchanged while keeping the other parameters unchanged and in parallel, the
chromatographic profile was observed and recorded. The studied parameters were the
composition of flow rate, and mobile phase composition. The results of robustness study
indicated that the small change in the conditions did not significantly affect the determination
of Capecitabine.
Table 6: Results for Robustness Mobile phase composition variation.
Sr.no Concentration
(μg/ml) Area
45:55 v/v Methanol: water
55:45 v/v Methanol: water
1 905162 901659
2 50 μg/ml) 905007 901721
3 910107 903821
%RSD 0.32% 0.14%
Table 7: Results for Robustness flow rate variation.
Sr. no Concentration (μg/ml) Area
0.95 (ml/minute) 1.05 ml/minute)
1 909370 888066
2 50 μg/ml 906987 903477
3 913673 901130
%RSD 0.37% 0.93%
Limit of detection and Limit of quantification
The Limit of detection was found to be 0.42µg/ml
CONCLUSION
The proposed method for the assay of Capecitabine was simple, rapid, accurate, precise,
sensitive and economic for the quantification of Capecitabine from its pharmaceutical dosage
forms. The method was validated for linearity, accuracy, precision, LOD, LOQ, robustness
and system suitability. The method was free from interference of other active ingredient and
excipients. Hence it can be concluded that this method may be employed for routine quality
control analysis of capecitabine in Active pharmaceutical ingredient and Formulation
product.
ACKNOWLEDGEMENT
We are thankful to swapnroop drug agency Aurangabad, for providing samples of
capecitabine. We are thanks to Mr. Dharbale N. B. Asst. Professor, Shree Bhagwan college of
pharmacy Aurangabad and our supporters Khushboo Bari, Umesh Mulgir. We also thank
shod laboratories for providing necessary facilities to carry out the research work.
REFERENCES
1. The Indian Pharmacopoeia, Vol. IV, Controller of Publications, Government of India,
Delhi, 2014; 2838-2840.
2. The United States Pharmacopoeia, USP 36, NF 31, Vol. 2, The United States
Pharmacopoeial Convention, Inc, Rockville, MD, 2013; 5307-5308.
3.
Skoog, D., Holler, F. Principle Of Instrumental Analysis, ed. 1st Thomson Publications,
India, 2007; 1-3, 145-147, 180.
4. Beckett A. H. and Stenlake J. B., In Practical Pharmaceutical Chemistry, 4(2), CBS
Publisher and Distributers, New Delhi, 2002; 275-278, 281-300.
5. Validation of Analytical Procedure: Methodology, ICH Harmonized Tripartie Guidelines,
November, 1996; 1-8.
6. ICH, Q2A, Tex on Validation of Analytical Procedures, International Conference on
Harmonization, Geneva, October, 1994; 1-5.
7. Samudrala V., Boovizhikannan T., Ramalingam K., Gummadi G., Kannan V.,
AnkireddyV., Journal of Pharmacy Research, 2012; 5(5): 2834-2836.
8. G. Chaitanya, G.Venkata Ramana, A.K.M. Pawar, International Journal of Pharmacy And
Analytical Research, 2016; 5(1): 190-198.
9. Fathima A., Tangadpally R., Kondepudi R., MakulaA., International Research Journal of
10.M. Prasad Rao, K. Leelavathi, N. Chandreshta, V. Sowjanya, I Sireesha, I.Rajani, V.V.
Naga Premi, INDO American Journal of Pharmaceutical Sciences, 2016; 3(5): 492-507.
11.Pani Kumar AD, Venkata Raju Y., Sunith G., Rama Krishna K, Ceema M, Venkteshara
Rao A., International Journal of Research in Pharmaceutical and Biomedical science,
2011; 2(1): 175-181.
12.Sreenivasa RaoT, Sukanya K, Chandanam S, Akkamma HG, Sai Kumar S, Manogna,
Research Journal of Pharmaceutica and Biological and Chemical science, 2012; 3(3):
713-721.
13.K. Ravi Kumar, CH. M.M. Prasada Rao, CH. Babu Rao, K.B. Chandra Sekhar, P. Gangi
Reddy, International Journal of Chem Tech Research, 2010; 2: 307-311.
14.P. Ravisankar, G. Devala Rao, M. Nveen Kumar, M. Krishna Chaitanya, Scholars
Research Library, 2013; 5(3): 249-260.
Wikipedia, the free encyclopedia, https:/en.m. Wikipedia.org>wiki> capecitabine.
www.drugbank. Ca/drugs.
http://en.wikipedia.org/wiki capecitabine.
https://pubchem. ncbi.nlm.nih.gon.