DEVELOPMENT AND VALIDATION OF STABILITY INDICATING
RP-HPLC METHOD FOR SIMULTANEOUS ESTIMATION OF
SACUBITRIL AND VALSARTAN IN BULK AND PHARMACEUTICAL
DOSAGE FORM
Arti M. Jadhav1* and Hemlata S. Bhawar2
Department of Pharmaceutical Chemistry, Pravara Rural College of Pharmacy, Pravaranagar,
Loni, Ahmednagar.
ABSTRACT
A simple, precise and reproducible Reverse Phase High Performance
Liquid Chromatography method was developed and validated for
simultaneous estimation of Sacubitril and Valsartan in tablet dosage
form. Chromatographic separation was achieved by Grace C18 (250
mm x 4.6 ID, Particle size- 5 micron) column and methanol: water
(90:10v/v) as mobile phase, at a flow rate of 1 ml/min (millilitre per
minute) using UV detection at 244nm. Forced degradation experiments
were carried out by exposing Sacubitril and Valsartan standard and
sample for thermal, photolytic, oxidative and acid-base hydrolytic
stress conditions. The retention time for Sacubitril and Valsartan were
obtained as 6.984min and 5.311 min. respectively. The method has
been validated for linearity, accuracy, precision, LOD, and LOQ. Linearity of Sacubitril and
Valsartan were found to be 12-60μg/ml.(R2=0.9987) and 13-65μg/ml.(R2=0.9979)
respectively. The accuracy of present method was evaluated at 50%, 100%, 150%. Recovery
was found to be in a range from 99.13%-101.25% for sacubitril and 98.92%-101.80% for
valsartan. Intermediate precision studies were carried out and the RSD values were less than
2%. Lower values of LOD (0.096µg/ml) and LOQ (0.293µg/ml) for sacubitril and LOD
(0.280µg/ml) and LOQ (0.849µg/ml) for valsartan indicated good sensitivity of the method.
In this study, the optimization of mobile phase, flow rate, injection volume and wavelength
were achieved. This demonstrate that the developed method is simple, precise, accurate and
robust for simultaneous estimation of Sacubitril and Valsartan in tablet dosage form. The
Volume 7, Issue 19, 1123-1138. Research Article ISSN 2277– 7105
Article Received on 05 October 2018,
Revised on 25 October 2018, Accepted on 15 Nov. 2018
DOI: 10.20959/wjpr201819-13773
*Corresponding Author Arti M. Jadhav
Department of
Pharmaceutical Chemistry,
Pravara Rural College of
Pharmacy, Pravaranagar,
method was acceptable for degradation studies of heat, sunlight, acid, base, peroxide which
meet the acceptance criteria for forced degradation studies.
KEYWORDS: Sacubitril, Valsartan, RP-HPLC, Validation.
INTRODUCTION
Sacubitril is a prodrug that is activated to sacubitrilat by de-ethylation via esterases.
Sacubitrilat inhibits the enzyme neprilysin, which is responsible for the degradation of atrial
and brain natriuretic peptide, two blood pressure-lowering peptides that work mainly by
reducing blood volume.[1-3]
Valsartan is an angiotensin II receptor antagonist (commonly called an ARB, or angiotensin
receptor blocker), blocks the actions of angiotensin II, which include constricting blood
vessels and activating aldosterone, to reduce blood pressure. The drug binds to angiotensin
type I receptors (AT1), working as an antagonist. This mechanism of action is different than
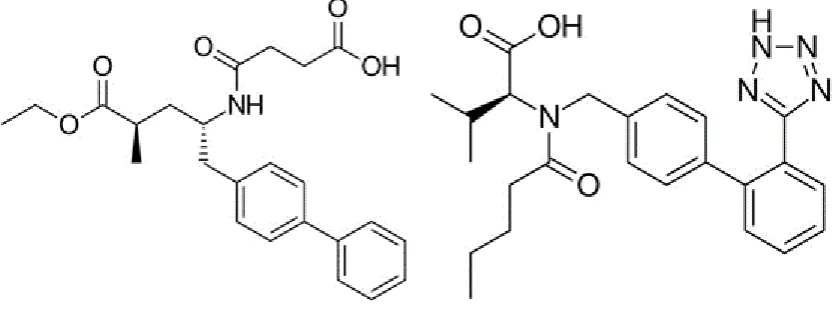
[image:2.595.88.508.403.559.2]the ACE inhibitor drugs, which block the conversion of angiotensin I to angiotensin II.[4-6]
Fig. 1: Chemical structure of Sacubitril. Fig. 2: Chemical structure of Valsartan.
On literature survey, it was found that only few methods was found for the simultaneous
estimation of Sacubitril and Valsartan in combined dosage forms and no method is available
in the pharmacopoeias. Few analytical methods like UV, RP-UPLC have been developed for
the determination of Sacubitril and Valsartan individually and in combination with other
drugs.[7-14] So we have developed a novel, simple and highly sensitive stability indicating
RP-HPLC methods for Sacubitril and valsartan in bulk and pharmaceutical formulations and
MATERIALS AND METHOD List of Instruments
Table 1: List of apparatus/ instruments used.
Sr. no. Name Model Manufacturer/Supplier
1. Weighing balance
PGB 100 Max : 100gm Min : 0.001gm
Wenser High Precision Balance
2. Digital PH Meter PICO+ Lab India pvt ltd.
4. Sonicator WUC-4L
Capacity -4 liter Wenser Ultra Sonicator
5. Magnetic stirrer Remi Equipment
6. HPLC HPLC 3000 Series Analytical Technologies Ltd.
Table 2: HPLC Instrument Information. Parts of Instruments Information
System HPLC Binary Gradient System
Model no. HPLC 3000 Series
Company Analytical Technologies Ltd.
Pump P-3000-M Reciprocating (40 MPa)
Column Grace C18 (250mm×4.6ID, Partical size- 5 micron)
Detector UV-3000-M
Software HPLC Workstation
List of Chemicals
Table 3: List of chemical used.
Sr.No. Name Specification Manufacturer/Supplier
1. Methanol HPLC grade Merck
2. Purified water HPLC grade In house production
3. 0.1N HCL HPLC grade Merck
4. 0.1N NaOH HPLC grade Merck
5. 3% H2O2 HPLC grade Merck
Table 4: List of API used.
Sr. No. Name Specification Manufacturer/Supplier
1. Sacubitril Working standard Lupin ltd. India.
2. Valsartan Working standard Lupin ltd. India.
Preparation of mobile phase
Mixed a HPLC grade Methanol and Purified water (90:10) in volumetric flask. Filter through
0.45µ filter under vaccum filtration.
Preparation of standard solutions
Accurately weigh and transfer 0.01gm (10mg) of pure sacubitril and valsartan working
standard separately into 10ml clean and dry volumetric flask. Add diluent and sonicated to
dissolve it completely and made volume upto the mark with same solvent (mobile phase).
From this, five working standard solution of concentration covering the range 12-60 ppm and
13-65 ppm for sacubitril and valsartan respectively, were prepared by transferring and
diluting different aliquots into series of 10ml volumetric flask with same diluent.
Preparation of sample solutions
Weighed and transfer 20 tablets of Vymada 50mg [containingsacubitril 24mg and valsartan
26mg lable claim] into mortar and pestle. Crush the above tablets into fine powder. Weigh
and transfer sample powder quantity equivalent to 10 mg of sacubitril and valsartan in 10 ml
volumetric flask containing mobile phase and shaken vigorously, sonicated for 15 min and
made up volume up to the mark with mobile phase. Aliquots of the above solution was
pipetted and transferred into a series of clean and dry 10 ml volumetric flask and diluent was
added uo to the mark to get final concentration of sacubitril and valsartan. 20µL volume each
of these standard and sample solution were injected five times and the peak areas were
recorded.
Selection of wavelength: UV spectrum of 10µg/ml sacubitril and valsartan diluents (mobile phase composition) was recorded by scanning in the range of 200nm to 400nm. From the
spectrum wavelength selected as 244nm. At this wavelength, both drugs show good
[image:4.595.132.468.545.722.2]absorbance.
HPLC instrumentation and chromatographic conditions
The HPLC system was Binary Gradient system consisting of pump P-3000-M Reciprocating
(40MPa), detector UV-3000-M, column Grace C18 (250mm×4.6ID, Particle size- 5micron),
thermo scientific injector rheodyne injector (20µl capacity) and syringe Hamilton (25µl).
Data were processed using HPLC workstation software. A freshly prepared mixture of
methanol and purified water (90:10 v/v) (PH 3.0) used as the mobile phase. Mobile phase
was filtered through 0.45µm membrane filter and sonicated before used. The flow rate of
mobile phase was maintained at 1.0 ml/min. The eluents were monitored at 244nm. The
injection volume of sample and standard were 20µl. Total run time is 10 min.
Optimized chromatographic condition
In the present study the separation of sacubitril and valsartan was achieved by using C18
column Grace C18 (250mm×4.6ID, Particle size- 5micron) with mobile phase consisting of
mixture of methanol and water in the ratio of 90:10 at a flow rate 1.0 ml/min with uv
detection wavelength of 244nm at ambient temperature. The retention time for sacubitril and
valsartan were found to be 6.984 and 5.311min respectively (fig no 4 and 5).
Time Conc Area Resolution T.Platenum Asymmetry
6.984 24ppm 13097587 0.00 8456 1.32
Time Conc Area Resolution T.Platenum Asymmetry
5.311 26ppm 9773330 0.00 8326 1.31
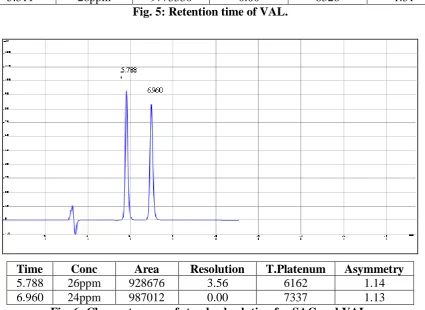
Fig. 5: Retention time of VAL.
Time Conc Area Resolution T.Platenum Asymmetry
5.788 26ppm 928676 3.56 6162 1.14
[image:6.595.87.513.334.644.2]6.960 24ppm 987012 0.00 7337 1.13
Fig. 6: Chromatogram of standard solution for SAC and VAL.
RESULT AND DISCUSSION Method Validation
The developed method was validated as per ICH guidelines for its specificity, system
suitability, linearity, accuracy, precision, robustness, limit of detection, limit of
System suitability
System suitability and chromatographic parameters were validated such as resolution,
[image:7.595.80.475.149.237.2]theoretical plates, and the tailing factor was calculated. The results are given in table 5.
Table 5: System suitability parameters for sacubitril and valsartan. System suitability parameters Sacubitril Valsartan
Retention time 6.960 5.788
Theoretical plate no. 987012 928676
Tailing factor 1.13 1.14
Resolution 3.56
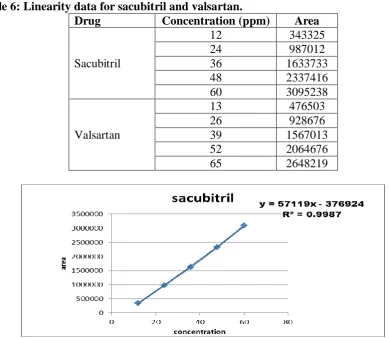
Linearity
The linearity of this method was evaluated by linear regression analysis and calculated by the
least square method and studied by preparing standard solutions of sacubitril and valsartan at
different concentration levels. The calibration curve showed (Fig. 7 and 8) good linearity in
the range of 12.25-36.75 μg/ml, for sacubitril with a correlation coefficient (r2) of 0.999 and
12.75-38.25 μg/ml for valsartan with a correlation coefficient (r2) of 0.999. Results are given
[image:7.595.94.484.407.745.2]in table 6.
Table 6: Linearity data for sacubitril and valsartan.
Drug Concentration (ppm) Area
Sacubitril
12 343325
24 987012
36 1633733
48 2337416
60 3095238
Valsartan
13 476503
26 928676
39 1567013
52 2064676
65 2648219
Fig. 8: Linearity graph of Valsartan.
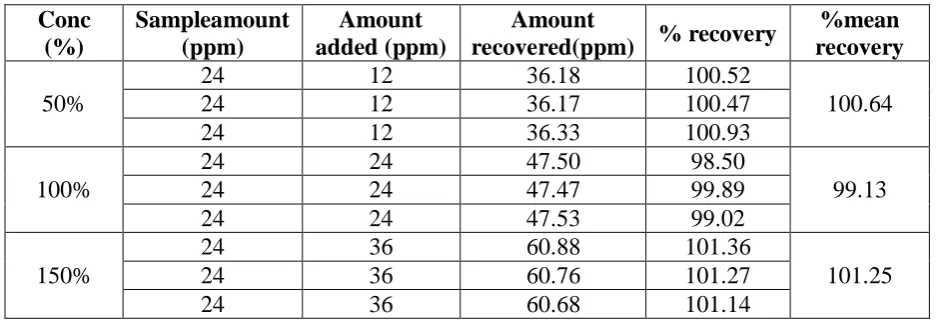
Accuracy
Recovery studies were carried out by addition of the standard drug to the sample at 3
different concentration levels (80%, 100% and 120%) taking into consideration percentage
purity of added bulk drug samples. At each concentration, the sample was injected thrice to
check repeatability and from the % RSD values it was analyzed that the method was accurate
as % recovery values found to be in the range of 99.13-101.25% for the Sacubitril and
98.92-101.80% for valsartan at three different concentrations 80%, 100%, 120%. The results are
given in table 7 and 8.
Table 7: Accuracy data for sacubitril. Conc
(%)
Sampleamount (ppm)
Amount added (ppm)
Amount
recovered(ppm) % recovery
%mean recovery
50%
24 12 36.18 100.52
100.64
24 12 36.17 100.47
24 12 36.33 100.93
100%
24 24 47.50 98.50
99.13
24 24 47.47 99.89
24 24 47.53 99.02
150%
24 36 60.88 101.36
101.25
24 36 60.76 101.27
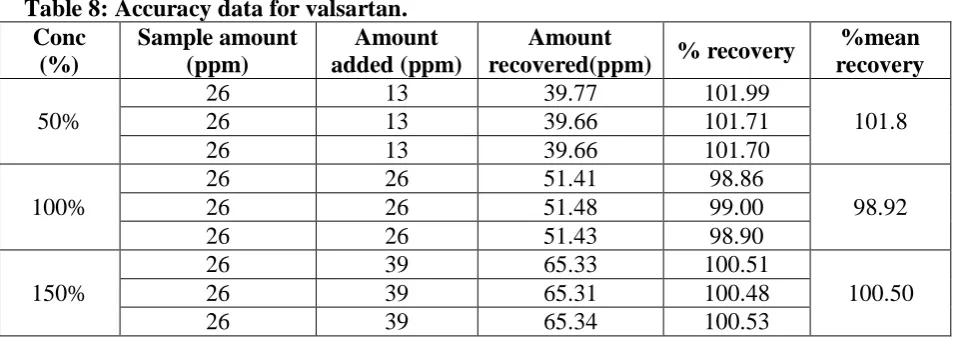
[image:8.595.64.538.496.659.2]Table 8: Accuracy data for valsartan. Conc (%) Sample amount (ppm) Amount added (ppm) Amount
recovered(ppm) % recovery
%mean recovery
50%
26 13 39.77 101.99
101.8
26 13 39.66 101.71
26 13 39.66 101.70
100%
26 26 51.41 98.86
98.92
26 26 51.48 99.00
26 26 51.43 98.90
150%
26 39 65.33 100.51
100.50
26 39 65.31 100.48
26 39 65.34 100.53
Precision Repeatability
A standard solution containing sacubitril (12 μg/ml) and valsartan (13 μg/ml) was injected
three times and areas of peaks were measured and % RSD was calculated. The results are
[image:9.595.73.485.376.492.2]given in table 9.
Table 9: Repeatability data for sacubitril and valsartan.
Drug Conc (ppm) Area Mean ±SD (n=3) % RSD
Sacubitril 12
343325
343540.66 0.329
342555 344742
Valsartan 13
476503
477041.66 0.314
475883 478739
Intraday precision
A standard solution containing (12,24,36 μg/ml) of sacubitril and (13, 26,39 μg/ml) of
valsartan were analyzed three times on the same day and % R. SD was calculated. The results
[image:9.595.71.498.602.768.2]are given in table 10.
Table 10: Intraday data for sacubitril and valsartan.
Sacubitril Valsartan
Morning
Area
Morning
Area
1633733 1567013
1633499 1565224
1632141 1565091
Evening
1635909
Evening
1565479
1631995 1566367
1635125 1565501
Mean 1633734 Mean 1565779
Standard deviation 1567.32 Standard Deviation 750.6201
Inter day precision A standard solution containing (12, 24, 36μg/ml) ofsacubitril (13, 26, 39
μg/ml) of valsartan were analyzed three times on a different day and % RSD was calculated.
[image:10.595.97.489.162.331.2]The resultsare given in table 11.
Table 11: Interday data for sacubitril and valsartan.
Sacubitril Valsartan
Day 1
Area
Day1
Area
1633733 1567013
1633499 1565224
1632141 1565091
Day2
1632778
Day2
1564452
1629361 1567701
1634978 1569969
Mean 1634978 Mean 1569969
Standard deviation 1915.63 Standard Deviation 2074.29
%RSD 0.12% %RSD 0.13%
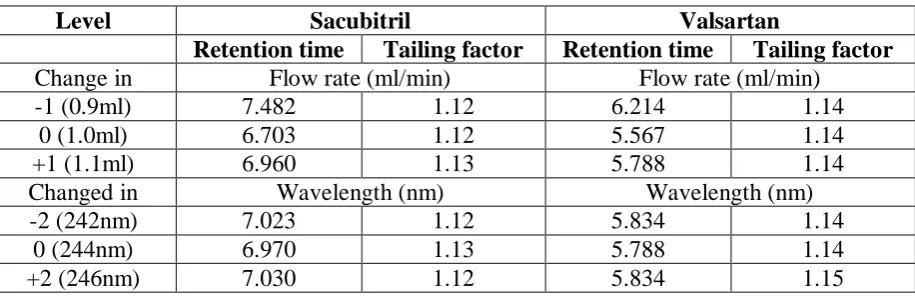
Robustness
Small deliberate changes in chromatographic conditions such as a change in mobile phase
ratio (±2%), change in wavelength (±2 units) and flow rate (±2 units) were studied to
determine the robustness of the method. The results were in the factor of (% RSD<2%) the
developed RP-HPLC method for the analysis of sacubitril and valsartan. The results are given
in table 12.
Table 12: Robustness data for sacubitril and valsartan at different flow rate and wavelength.
Level Sacubitril Valsartan
Retention time Tailing factor Retention time Tailing factor
Change in Flow rate (ml/min) Flow rate (ml/min)
-1 (0.9ml) 7.482 1.12 6.214 1.14
0 (1.0ml) 6.703 1.12 5.567 1.14
+1 (1.1ml) 6.960 1.13 5.788 1.14
Changed in Wavelength (nm) Wavelength (nm)
-2 (242nm) 7.023 1.12 5.834 1.14
0 (244nm) 6.970 1.13 5.788 1.14
+2 (246nm) 7.030 1.12 5.834 1.15
Limit of detection (LOD) and limit of quantification (LOQ)
The LOD and LOQ were found to be 0.096μg/ml and 0.293μg/ml for sacubitril and
0.280μg/ml and 0.849μg/ml for valsartan estimated by using the standard formulas. The low
[image:10.595.71.529.517.665.2]precise as it can detected and quantify with very low concentration. The result is given in
table 13.
Table 13: Data for LOD & LOQ for sacubitril and valsartan.
Sr.No. Drug LOD (µg/ml) LOQ (µg/ml)
1 Sacubitril 0.096 0.293
2 Valsartan 0.280 0.849
Method development
ICH prescribed stress conditions such as acidic, basic, oxidative, thermal and photolytic
stresses were carried out.
Forced Degradation Study
Sacubitril and Valsartan were subjected to variety of stress conditions to affect degradation
up to about 5-20%. The drugs were stressed under a variety of stress conditions like acid,
alkali, effect by oxidation, light and dry heat. The stressed samples were subjected to
chromatographic separation to resolve the drug from any potential degradation products.
Acid degradation
Acid decomposition studies were performed by refluxing 1 ml of sample stock solution was
transferred into 10 ml of volumetric flask. 2 ml of 0.1N HCL was added and mixed well and
put for 4 h at 70ºc in round bottom flask. After time period content was cooled to room
temperature. Then the volume was adjusted with diluent to get 24ppm for sacubitril and
26ppm for valsartan. After making final solutions, it is injected into HPLC and peak area and
peak shape were observed. Chromatogram of acid degradation on sample solution is shown in
Time Conc Area Resolution T.Platenum Asymmetry
5.844 26ppm 1945720 4.96 10652 1.14
7.061 24ppm 2575541 0.00 12144 1.12
Fig. 9: Acid degradation of sacubitril and valsartan at 4 hr.
Base degradation
Base decomposition studies were performed by refluxing 1ml of sample stock solution was
transferred into 10ml of volumetric flask. 2ml of 0.1N NaOH solution were added and mixed
well and put for 4 h at 70ºc in round bottom flask. After a time period the content was cooled
to room temperature. Then the volume was adjusted with diluent to get 24ppm for sacubitril
and 26ppm for valsartan. After making final solution, it is injected into HPLC and the peak
area and peak shapes were observed. Chromatogram of base degradation on sample solution
is shown below fig 10.
Time Conc Area Resolution T.Platenum Asymmetry
5.940 26ppm 2015705 4.55 8024 1.12
7.175 24ppm 2389054 0.00 11343 1.10
Fig. 10: Base degradation of sacubitril and valsartan at 4 hr.
Oxidative degradation
Oxidative decomposition studies were performed by refluxing 1ml of sample stock solution
was transferred into 10ml of volumetric flask. 2ml of 3% H2O2 solution were added and
mixed well and put for 4 h at 70ºc in round bottom flask. After a time period the content was
cooled to room temperature. Then the volume was adjusted with diluent to get 24ppm for
the peak area and peak shapes were observed. Chromatogram of oxidative degradation on
sample solution is shown below fig 11.
Time Conc Area Resolution T.Platenum Asymmetry
6.039 26ppm 1920115 3.39 8297 1.13
7.000 24ppm 2061637 0.00 9161 1.10
Fig. 11: Oxidative degradation of sacubitril and valsartan at 4 hr.
Thermal degradation
Thermal decomposition studies were performed by taking 1ml of sample stock solution was
transferred into 10ml of volumetric flask. The volumetric flask was stored in an oven at 110ºc
for 4 h. Then the volume was adjusted with diluent to get 24ppm for sacubitril and 26ppm for
valsartan. After making final solution, it is injected into HPLC and the peak area and peak
shapes were observed. Chromatogram of thermal degradation on sample solution is shown
Time Conc Area Resolution T.Platenum Asymmetry
6.081 26ppm 2642836 4.17 6728 1.12
7.359 24ppm 3009798 0.00 9170 1.10
Fig. 12: Thermal degradation of sacubitril and valsartan at 4 hr.
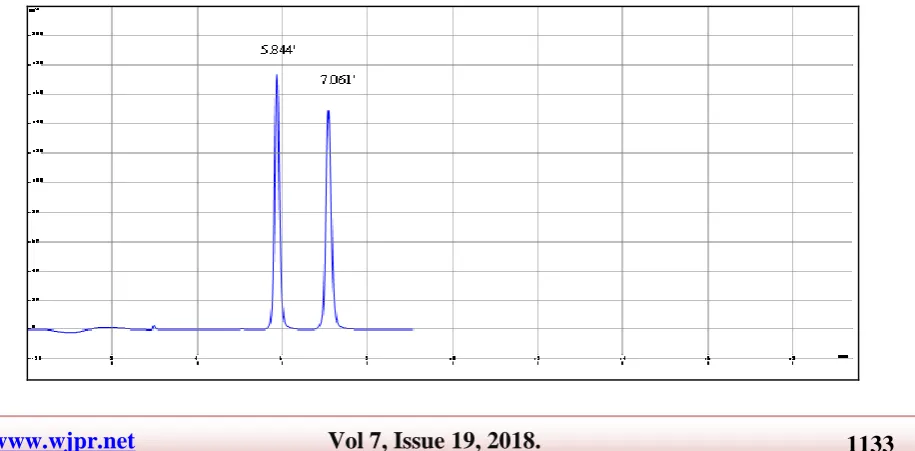
Photolytic degradation
Photolytic decomposition studies were performed by taking 1ml of sample stock solution was
transferred into 10ml of volumetric flask. The volumetric flask was kept in an UV chamber
for 1 72 h. Then the volume was adjusted with diluent to get 24ppm for sacubitril and 26ppm
for valsartan. After making final solution, it is injected into HPLC and the peak area and peak
shapes were observed. Chromatogram of photo degradation on sample solution is shown
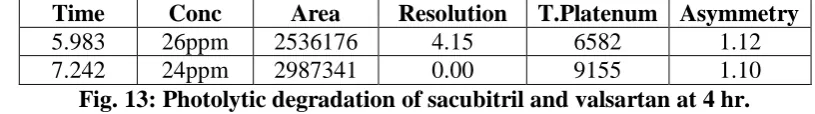
Time Conc Area Resolution T.Platenum Asymmetry
5.983 26ppm 2536176 4.15 6582 1.12
7.242 24ppm 2987341 0.00 9155 1.10
[image:15.595.90.498.73.130.2]Fig. 13: Photolytic degradation of sacubitril and valsartan at 4 hr.
Table 13: Stability data for sacubitril.
Stress condition Retention time Area of peak Degradation (%)
API after degradation %
Std. drug 6.984 13097587 -- --
Acidic (0.1N HCL) 7.061 2575541 80.33 19.67
Alkaline (0.1N NaOH) 7.175 2389054 81.75 18.75
Oxidation (H2O2) 7.000 2061637 84.25 15.75
UV 7.242 2987341 77.19 22.81
Thermal 7.359 3009798 77.02 22.98
Table 14: Stability data for valsartan.
Stress condition Retention time Area of peak Degradation (%)
API after degradation %
Std. drug 5.311 9773330 -- --
Acidic (0.1N HCL) 5.844 1945720 80.09 19.91
Alkaline (0.1N NaOH) 5.940 2015705 79.37 20.63
Oxidation (H2O2) 6.039 1920115 80.35 19.65
UV 5.983 2536176 74.05 25.95
Thermal 6.081 2642836 72.95 27.05
CONCLUSION
Stability indicating RP-HPLC methods have been developed and validated for the
determination of sacubitril and valsartan in tablet dosage form. The methods are found to be
specific as there was no interference of any co-eluting impurities after stress degradation
study. The degraded products are well resolved, indicating the method can also be useful for
determination of degraded products. The proposed method is found to be simple, accurate,
precise and robust. Hence, it can be used successfully for the routine analysis of sacubitril
and valsartan in pharmaceutical dosage forms and for analysis of stability samples obtained
during accelerated stability study.
ACKNOWLEDGEMENT
The authors express their gratitude to the Pravara Rural College of Pharmacy, Loni for
providing all the facilities and Lupin Pharmaceuticals Ltd, India for providing me the gift
REFERENCES
1. Patel RB “An Introduction to analytical method development for pharmaceutical
formulations”, research gate, 2008; 220.
2. Willard HH, Merrit LL, Dean JA, Settle FA, “Instrumental methods of analysis”, New
Delhi; CBS Publishers and Distributors, 5th edition, 2001; 465-506, 513-522, 530-534.
3. https://www.drugbank.ca/drugs/DB09292 (Sacubitril).
4. Indian Pharmacopoeia, Government of India Ministry of health and family welfare, Vol.II
Indian pharmacopoieal Comission Ghaziabad, 2014; 202,618,2951.
5. https://www.drugbank.ca/drugs/DB00177 (Valartan).
6. Nash RA, Wachter AH. Validation of analytical methods process. In: Pharmaceutical
process validation”, New York, 3rd
edition, 2003; 507- 524.
7. Singh R, Rehman Z, “Current trends in forced degradation study for pharmaceutical
product development”, Journal of harmaceutical Education and Research, 2012; 3(1):
376-384.
8. Forced degradation studies: Regulatory consideration and Implementation (online):
Refferd as on 12 Nov 2017.
9. Kena HP, Shailesh VL, Sachin BN. Simultaneous estimation of sacubitril and valsartan in
synthetic mixture by RP-HPLC method. J. Pharm. Sci. Bioscientific Res., 2016; 6(3):
262-9.
10.N. Madana Gopal C Shridhar. RP-UPLC method for simultaneous estimation of
Sacubitril and Valsartan in bulk and tablet dosage form, International Journal of Chem
Tech Research, 2017; ISSN(online). 2455-9555.
11.Muqhtar A. Satishkumar SA. Development and validation of UV Spectrophotometric
methods for the simultaneous estimation of sacubitril and valsartan in bulk and
pharmaceutical formulations International Journal of Universal Pharmacy and Bio
Sciences, April 2017; ISSN. 2319-8141.
12.Shweta M., Patel CJ. Patel MM. Development and validation of stability indicating
chromatographic method for simultaneous estimation of sacubitril and valsartan in
pharmaceutical dosage form. International Journal of Applied Pharmaceutics, Aug 2017;
ISSN. 0975-7058.
13.T. Naga Raju D Ravi Kumar Assay for Valsartan and Sacubitril in combined dosage form
by RP-HPLC. Journal of Applied Chemistry, Sep. 2017; 6(5): 1004-1011.
14.Skoog D.A., Holler F.J.,. Timothy A, Nieman NW, “Principle of Instrumental Analysis”,