The Economic and Social Review, Vol. 20, No. 2, January 1989, pp. 111-120
A Systems Approach to Modelling the
E M S Exchange Rate Mechanism*
R O N A L D B E W L E Y
University of Sydney and University of New South Wales C O L M K E A R N E Y
University of New South Wales
Abstract: This paper examines the extent to which the EMS has succeeded i n stablising intra-European exchange rates from external influences. I t generalises earlier results by developing a systems approach to the problem which enables intra-currency volatility to be separated from the impact o f external exchange rate shocks o n the system as a whole. I t is f o u n d that the EMS has indeed been successful i n the intra-system task while the external effects o n the entire system have increased.
he purpose o f this paper is t o analyse the extent t o w h i c h the EMS has JL been successful i n stabilising intra-European exchange rates w h i l e reduc ing the collective v a r i a b i l i t y o f these rates t o changes i n the major non-EMS currencies. Previous w o r k i n this area has been reported b y Padoa-Schioppa ( 1 9 8 4 ) , R o g o f f ( 1 9 8 5 ) , Giavazzi and Giovannini ( 1 9 8 6 ) , Ungerere^a/. ( 1 9 8 6 ) , and A r t i s ( 1 9 8 8 ) . Our paper generalises these analyses b y developing an appropriate systems f r a m e w o r k w h i c h allows e x a m i n a t i o n o f the responsive ness o f the complete set o f participating members' b i l a t e r a l exchange rates t o variations i n the strength o f the Japanese and U n i t e d States currencies. Using m o n t h l y data f r o m January 1973 t o June 1986, models were estimated for b o t h pre- and post-EMS regimes. A m o n g s t the major findings are that w h i l e
*We w o u l d like t o thank Trevor Breusch for his comments and J o h n Hillier for his research assistance. This paper was presented at the Australian Economics Society Conference, Gold Coast, Australia i n August 1987 and at the annual conference o f the European Economics Association i n Bologna, Italy i n August 1988. I t was completed while R. Bewley was o n leave at the Department o f Agricultural Economics, University o f Sydney and he thanks that institution for its support.
the EMS as a w h o l e has become increasingly susceptible t o external influences, i t has nevertheless succeeded i n reducing the bilateral exchange rate v o l a t i l i t y of its members' currencies.
The remainder o f the paper is organised as f o l l o w s . Section I I introduces the m o d e l l i n g strategy and the essential properties o f the data. Section I I I outlines the m o d e l and presents the empirical findings. Conclusions are d r a w n i n the final section.
I I T H E EMS A N D D I S P E R S I O N O F E U R O P E A N E X C H A N G E R A T E S
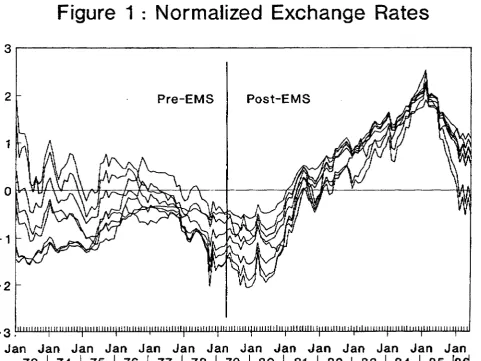
I t is w i d e l y accepted that the EMS has achieved considerable success i n reducing the dispersion o f the exchange rates o f its p a r t i c i p a t i n g members' currencies. Figure 1 illustrates the extent t o w h i c h this is the case.
A l t h o u g h there is obviously l i t t l e p o i n t i n testing for the existence o f a change i n the degree o f dispersion among these exchange rates since the intro d u c t i o n o f the E M S , there is some m e r i t i n describing its extent. I n order t o m a i n t a i n some degree o f consistency w i t h the analysis w h i c h is presented i n the n e x t section, the dispersion analysis is conducted i n terms o f the logarithms o f the US-dollar exchange rates o f the EMS-participating countries (Belgium, D e n m a r k , T h e Netherlands, France, West G e r m a n y , Ireland and I t a l y ) .
T h e t o t a l v a r i a t i o n i n the EMS can be described b y the sum o f the variances of the seven i n d i v i d u a l series expressed i n logarithms. I n order t o gain insight i n t o the dispersion among the currencies, various indices can be c o m p u t e d that a t t e m p t to account for this t o t a l variation. One simple way o f effectively achieving this is t o use p r i n c i p a l component analysis. I n principal component analysis, the seven exchange rates are transformed i n t o seven u n c o r r e c t e d indices w i t h the sum o f the variances o f the indices being identical t o that o f the original t o t a l variation. T h e indices are constructed i n order o f diminishing variance so t h a t , i f a l l seven rates were almost perfectly correlated, the first
component w o u l d account for nearly a l l o f the t o t a l variation. As the degree of dispersion increases, more components are needed to account for t o t a l variation.
Specifically, the first component PCj is t h a t index
PC. = 1 w.Zn(Sj) i = 1
where the Sj denote the US-denominated exchange rates o f the European currencies and the fixed weights w. ( i = l , . . . , n) are derived i n the p r i n c i p a l c o m p o n e n t analysis. Because ?Cl is that index w i t h the highest variance, i t
Figure 1 : Normalized Exchange Rates
2 l i i n i n i i i i j i m m i i i i j t i i i i j i i n i i | i i i n i i i i i i | n i i i H i n i j i n M i i i i i i [ i i i i i i i i l i i | n i i i l i i l i i | i i n i i i i i i i | i i l i i i n i i i | i i i i i i i i i i i | i i i i i i i i i i i | i i i i
Jan Jan Jan Jan Jan Jan Jan Jan Jan Jan Jan Jan Jan Jan
for w i t h o n l y a few components. Indeed, the number o f components neces sary t o e x p l a i n , say, 95 per cent o f the t o t a l v a r i a t i o n is an i n d i c a t i o n o f h o w closely the series move together. Therefore, an analysis o f the EMS pre-and-post its i n t r o d u c t i o n should show t h a t fewer components are necessary t o provide an adequate representation o f the data after its i n t r o d u c t i o n i f the EMS has, indeed, contained the i n d i v i d u a l rates i n a tighter band. The cumu lative percentage explanations o f the first three components are presented i n Table 1 .
T a b l e 1: Decomposition of Total Variation by Principal Components
Cumulative Percentage Explanation
Sample Period by Components 1 to i
Sample Period
1 2 3
P r e - E M S 6 6 . 4 8 9 6 . 6 5 9 8 . 6 3
P o s t - E M S 9 8 . 9 9 9 9 . 6 6 9 9 . 8 3
N o t surprisingly, the greater pre-EMS dispersion noted i n Figure 1 has led t o t w o components being required to explain more t h a n 95 per cent o f the v a r i a t i o n i n the system whereas a greater explanation is achieved i n the post-EMS p e r i o d w i t h o n l y one c o m p o n e n t .
The p r i n c i p a l components analysis can be extended t o decompose the vari a t i o n o f each i n d i v i d u a l currency participating i n the system. Table 2 presents these results. I n t e r e s t i n g l y , the D u t c h guilder and German mark are subject to more n o n - t r e n d variation than the others in the post-EMS regime. These t w o rates have tended to share a p a r t i c u l a r l y close relationship and the greater variability i n the m a r k reflects its role as a substitute for the major non-EMS currencies i n w o r l d p o r t f o l i o s . D u r i n g the pre-EMS p e r i o d , five o f the cur rencies e x h i b i t similar behaviour w i t h the first component explaining the m a j o r i t y o f the variance and the second bringing the t o t a l up t o more t h a n 90 per cent. T w o currencies, the French franc and the Danish k r o n e , stand o u t as being somewhat d i f f e r e n t . T h e franc has almost no correspondence t o t r e n d w i t h components 2 and 3 playing a similar role t o components 1 and 2 for the other currencies.
A SYSTEMS A P P R O A C H T O M O D E L L I N G T H E EMS E R M
T a b l e 2 : Decomposition of the Variation in Each Currency
Cumulative Percentage Explanation by Components 1 to i
Country
1 2 3 Pre-EMS.
B e l g i u m 5 3 . 6 3 9 8 . 7 1 9 9 . 0 0
D e n m a r k 2 3 . 7 9 9 0 . 4 4 9 2 . 7 1
N e t h e r l a n d s 6 2 . 8 5 9 6 . 8 0 9 7 . 0 0
F r a n c e 1.92 7 0 . 0 1 9 6 . 5 4
W . G e r m a n y 6 5 . 4 8 9 8 . 8 6 9 9 . 1 9
I r e l a n d 6 9 . 0 3 9 6 . 8 1 9 8 . 9 9
I t a l y 8 6 . 9 7 9 8 . 8 4 9 8 . 9 9
Post-EMS:
B e l g i u m 9 9 . 5 6 9 9 . 5 8 9 9 . 8 5
D e n m a r k 9 9 . 5 0 9 9 . 5 1 9 9 . 5 1
N e t h e r l a n d s 9 7 . 1 6 9 9 . 8 4 9 9 . 9 2
F r a n c e 9 9 . 5 5 9 9 . 7 2 9 9 . 9 9
W . G e r m a n y 9 6 . 3 1 9 9 . 8 4 9 9 . 9 1
I r e l a n d 9 9 . 7 7 9 9 . 7 7 9 9 . 7 7
I t a l y 9 8 . 7 7 9 9 . 5 9 9 9 . 9 9
I I I T H E M O D E L
T h e m o d e l w h i c h forms the basis o f our econometric analysis expresses the change i n each rate, D(sj) as a contemporaneous f u n c t i o n o f the log-changes o f the effective US and Japanese exchange rates
D(si ) = « o , + « i iD( U Se) + a2 iD ( Y E Ne) + u; (1)
Since the seven equations i n (1) have identical regressors, the complete m o d e l can be efficiently estimated b y O L S and the difference between any t w o esti mated equations is identical t o a regression o f the log-change o f the relevant bilateral rates o n the same set o f regressors.
T h e m o d e l (1) contains a non-EMS currency, the US dollar, as the d e n o m i n ator i n each s; and t h i s can be removed b y f o l l o w i n g one o f t w o approaches.
I n the previous section, the variance o f the system was decomposed using p r i n c i p a l components. I f the exchange rates are nonstationary, p o p u l a t i o n variances do n o t exist so an evolving p o p u l a t i o n variance is effectively being decomposed i n Section I I . T o the extent that exchange rate behaviour is closely a p p r o x i m a t e d b y a r a n d o m w a l k , differenced data is a p p r o x i m a t e d b y a stationary process and, hence, d e c o m p o s i t i o n o f these sample variances is more appropriate. T h e analysis reported i n Table 1 is repeated i n Table 3 for the differenced data and the corresponding weights are presented i n Table 4.
T a b l e 3 : Decomposition of Total Volatility by Princ ipal Components
Cumulative Percentage Explanation Sample Period by Co mponents 1 to i
1 2 3
P r e - E M S 8 2 . 0 8 9 0 . 0 9 9 4 . 6 6
P o s t - E M S 9 6 . 1 2 9 7 . 4 4 9 8 . 1 7
T a b l e 4: Weights Defining First Component
Country Pre-EMS Post-EMS
B e l g i u m 1 7 . 1 3 1 4 . 9 0
D e n m a r k 1 6 . 1 0 1 4 . 4 9
N e t h e r l a n d s 1 7 . 2 6 1 4 . 5 8
F r a n c e 14.81 1 4 . 5 4
W . G e r m a n y 1 7 . 4 0 14.68
I r e l a n d 9.01 1 4 . 1 0
I t a l y 8.28 12.71
F o l l o w i n g Bewley ( 1 9 8 6 ) , the first c o m p o n e n t is subtracted f r o m each equation i n the system (1) t o produce a singular, normalised equation system. Thus, any n - l equations i n that system define the entire m o d e l and can be estimated b y O L S because o f the c o m m o n regressor p r o p e r t y . T h e trans f o r m e d equations can be t h o u g h t o f as expressing deviations f r o m an overall f i x e d weight index, w h i c h we call the European M o n e t a r y U n i t ( E M U ) , as a f u n c t i o n o f external factors. There are i m p o r t a n t differences between the E M U and the E C U , w h i c h is the o f f i c i a l "average" o f the component cur rencies. T h e former is a f i x e d weight index for each regime b u t the E C U has been the subject o f a number o f re-alignments. While the E C U d i d n o t exist pre-EMS, the E M U can be constructed for b o t h regimes.
The m a i n purpose o f i n t r o d u c i n g the E M U t o E q u a t i o n (1) is t o separate the average behaviour o f the EMS currencies f r o m their dispersion about i t . B y so d o i n g , we can analyse the impact o f external effects o n the EMS i n t w o distinct parts; o n the system as a w h o l e via the E M U , and u p o n the cross-rates w i t h i n the system. The f i n a l m o d e l is, therefore, a t r a n s f o r m a t i o n o f E q u a t i o n ( 1 ) . T h e seven equations i n (1) have been replaced b y six E M U - d e n o m i n a t e d currencies and one E M U equation.
T h e estimation was conducted o n end-of-period m o n t h l y data over the period January 1973-March 1979 for the pre-EMS regime and A p r i l 1979-June 1986 for the post-EMS regime. The E M U equation estimates w i t h a
first-order a u t o c o r r e l a t i o n c o r r e c t i o n are presented i n Table 5 and the intra-system estimates are p r o v i d e d i n Table 6.
T a b l e 5 : The EMU Equation Estimates
Regressor Pre-EMS Post-EMS
C o n s t a n t 0 . 0 0 0 9 0 . 0 0 0 4
( 1 . 2 2 ) ( 0 . 6 4 )
D ( U Se) - 0 . 4 6 4 2 - 0 . 5 1 1 4
( 8 . 7 2 ) ( 2 4 . 2 2 )
D ( Y E Ne) - 0 . 1 7 9 5 - 0 . 2 1 4 4
( 4 . 5 0 ) ( 1 1 . 3 4 )
A R ( 1 ) 0.18 0 . 8 8
( 1 . 4 0 ) ( 4 . 2 7 )
T H E ECONOMIC A N D S O C I A L R E V I E W
T a b l e 6: Systems Estimates
EMU-Denominated Pre-EMS Post-EMS Exchange Rate D ( U Se) D ( Y E Ne) D ( U Se) D ( Y E Ne)
B e l g i a n f r a n c 0 . 1 4 6 0 . 1 0 2 0 . 0 4 0 0 . 0 3 2
( 2 . 2 6 ) ( 2 . 0 0 ) ( 1 . 0 2 ) ( 0 . 8 8 )
D a n i s h k r o n e 0.145 0 . 0 9 2 - 0 . 0 2 3 - 0 . 0 3 8
( 2 . 0 4 ) ( 1 . 6 4 ) ( 0 . 7 2 ) ( 1 . 2 4 )
D u t c h guilder 0 . 1 7 4 0 . 1 0 7 - 0 . 0 2 7 0 . 0 0 7
( 2 . 1 8 ) ( 1 . 7 0 ) ( 1 . 0 1 ) ( 0 . 2 8 )
F r e n c h f r a n c 0 . 0 3 9 - 0 . 0 8 2 0 . 0 8 2 - 0 . 0 0 7
( 0 . 3 1 ) ( 0 . 8 4 ) ( 1 . 8 6 ) ( 0 . 1 6 )
G e r m a n m a r k 0 . 1 3 5 0 . 0 5 2 0 . 0 1 2 0 . 0 4 8
( 1 . 8 6 ) ( 0 . 9 0 ) ( 0 . 4 0 ) ( 1 . 7 8 )
I r i s h p u n t - 0 . 6 1 0 - 0 . 2 4 9 - 0 . 0 1 2 0 . 0 0 5
( 3 . 6 1 ) ( 1 . 8 7 ) ( 0 . 4 0 ) ( 0 . 2 0 )
I t a l i a n l i r a - 0 . 3 6 8 - 0 . 3 0 3 - 0 . 0 8 2 - 0 . 0 5 6
( 3 . 1 6 ) ( 1 . 9 0 ) ( 1 . 8 6 ) ( 1 . 3 8 )
J o i n t test 3.01 0 . 3 4 1.80 1.26
I t is clear f r o m Table 5 that w h i l e the change i n the influence o f the external exchange rates o n the E M U is m i n i m a l across regimes, there exists a significant change i n the a u t o c o r r e l a t i o n structure o f the residuals. I t is reasonable t o conjecture t h a t the similarities i n the c o n s t r u c t i o n o f the E M U and the E C U i n the post-EMS regime give rise t o the same basic trends i n these averages. T h e sharp changes due t o the re-alignments o f the EMS currnecies d u r i n g the post-1979 era, however, cause a p a t t e r n i n the residuals o f the E M U equation w h i c h requires c o r r e c t i o n for the generated positive a u t o c o r r e l a t i o n . T h e co efficients o n the external rates i n the E M U equation are essentially unchanged across regimes b u t there is a m a r k e d increase i n the significance o f the effect. I n b o t h cases, the impact o f the US dollar and the Y e n is negative and signifi cant so i t can be claimed that the EMS has n o t reduced the v o l a t i l i t y o f the system as a w h o l e w h i c h has been generated f r o m external sources.
A 5 per cent c r i t i c a l value o f 2.25 for this H o t e l l i n g ' s T test confirms that o n l y the US dollar impacts u p o n the system pre-EMS and neither rate does post-EMS. Since the average residual variance reduces f r o m 34 t o 7 across regimes, i t can be n o t e d that the unexplained v o l a t i l i t y has been dramatically reduced.
I V C O N C L U S I O N S
This paper has been concerned w i t h the extent to w h i c h the EMS has succeeded i n stabilising intra-European bilateral exchange rates d u r i n g a p e r i o d o f increasing external pressure. T h e m o d e l l i n g strategy is based o n a complete systems approach t o remove problems o f defining a suitable numeraire rate and, i m p o r t a n t l y , t o separate intra-system v o l a t i l i t y f r o m v o l a t i l i t y o f the system as a w h o l e .
REFERENCES
A R T I S , M . J . , 1 9 8 8 . " E x t e r n a l A s p e c t s o f the E M S " , i n D . F a i r and C . de Boissieu (eds.),
International Monetary and Financial Integration — The European Dimension, N i j h o f f .
B E W L E Y , R . A . , 1 9 8 6 . Allocation Models: Specification, Estimation and Applications, C a m b r i d g e : Ballinger.
G I A V A Z Z I , F . , a n d A . G I O V A N N I N I , 1 9 8 6 . " T h e E M S a n d the D o l l a r " , Economic Policy,
N o . 2, p p . 4 5 6 - 4 8 5 .
P A D O A - S C H I O P P A , T . , 1 9 8 4 . " P o l i c y C o - o p e r a t i o n a n d the E M S E x p e r i e n c e " , i n W . H .
B u i t e r and R . C . M a r s t o n (eds.), International Economic Policy Coordination, p p . 3 3 1
-3 -3 5 .
R O G O F F , K . , 1 9 8 5 . " C a n E x c h a n g e R a t e P r e d i c t a b i l i t y B e A c h i e v e d W i t h o u t M o n e t a r y C o n v e r g e n c e ? E v i d e n c e f r o m the EMS",European Economic Review, N o . 2 8 , p p . 9 3 - 1 1 5 .
U N G E R E R , H . , O . E V A N S , T . M A Y E R , and P. Y O U N G , 1 9 8 6 . " T h e E u r o p e a n M o n e t a r y