RP-HPLC METHOD DEVELOPMENT AND VALIDATION FOR
PREGABALIN AND CELECOXIB IN BULK AND DOSAGE FORMS
G. Swapna*1 and Merugu Manasa2
1
Gland Institute of Pharmaceutical Sciences, Narsapur.
2
Pulla Reddy Institute of Pharmacy, Domadugu(V), Gummadidala(M), Sangareddy.
ABSTRACT
A simple, accurate, precise and highly selective reverse phase high
performance liquid chromatographic (RP-HPLC) method was
developed and validated for Pregabalin and Celecoxib.
Chromatographic separation was achieved isocratically by using
waters allaiance 2695 separation module, Hypersil BDS(150 mm x 4.6
mm, 5) at temperature 30oc. Flow rate selected was 1ml/min. Both
changes were identified with 238 nm. Mobile phase employed was
potassium di hydrogen orthophosphate buffer of pH 6.5 and
acetonitrile in the ratio of (70:30) which resulted best resolution and
sensitivity. Developed method was validated in terms of linearity,
range(37.5 µg/ml-281.25 µg/ml, for Pregabalin, 100 µg/ml -750 µg/ml Celecoxib),
precession (correlation coefficient is less than 0.999), robustness, accuracy (recovery of
Pregabalin and Celecoxib were 100.3% and 100.13% respectively). The validation of
proposed method was verified by recovery studies and can be applicable in routine
pharmaceutical analysis.
KEYWORDS: RP-HPLC, Pregabalin, Celecoxib and potassium di hydrogen orthophosphate
buffer.
INTRODUCTION
Pregabalin(PRE) and Celcoxib (CEL) are used for the treatment of diseases like neuropathic
pain. Pregabalin is chemically (S)-3-(aminomethyl)-5-methylhexanoic acid, act as
Anticonvulsant, Analgesic, Celecoxib is chemically
4-[5-(4-methylphenyl)-3-(trifluoromethyl)-1H-pyrazol-1-yl]benzene-1- sulphonamide belonging to category
Volume 6, Issue 8, 1354-1360. Research Article ISSN 2277– 7105
*Corresponding Author
G. Swapna
Gland Institute of
Pharmaceutical Sciences,
Narsapur.
Article Received on 30 May 2017,
Revised on 20 June 2017, Accepted on 10 July 2017
cyclooxigenage inhibitors. It is needed to develop a method without any draw back because
no methods are reported for Pregabalin and Celecoxib.
MATERIALSAND METHOD
Chromatographic separation was carried by using WATERS Aliance 2695 model with
empower2 software, Weighing Balance model no ER200A, Sonicator with SE60US and pH
Meter AD102U model was used . Pregabalin and Celecoxib standards are obtained as gift
from AUROBINDO labs, Hyderabad, the tablet dosage forms as Lyrica 75 (Pregabalin) and
TAPAL 50 (Tapentdol). All the chemicals and reagents user were HPLC grade or analytical
reagent grade purchased from qualigens, Merck (CHEMICALS), Mumbai, India.
CHROMATOGRAPHICCONDITIONS
The separation of drugs were performed by using potassium dihydrogen orthophosphate
buffer of pH 6.5: Aceto nitrile (70:30) as mobile phase and Hypersil BDS was used as
stationary phase. As a result of this the Peak resolution between two peaks was very good,
retention time also good and no impuritiy peaks are developed at 238nm.
PREPARATION OF STANDARD SOLUTION
Accurately Weighed and transferred 75mg of Pregablin and 200mg of celecoxib working
Standards into two 10 ml clean dry volumetric flasks, add 7ml of diluent, sonicated for 5
minutes and make up to the final volume with diluents.(standard stock).
CALIBRATION CUVRE
Calibration curve was developed to determine the linearity. The plots were developed concentrations verses area of the peak, it must obey Beer’s- Lambert’s law. The linearity was
determined by using serial dilution of 37.5 µg/ml of Pregabalin and 100 µg/ml of celecoxib,
(93.75 µg/ml of Pregabalin and 250 µg/ml of celecoxib, 131.25µg/ml of Pregabalin and
350µg/ml of celecoxib, 187.5 µg/ml of Pregabalin and 500 µg/ml of celecoxib, 225 µg/ml of
Pregabalin and 600 µg/ml of celecoxib and 281.25 µg/ml of Pregabalin and 750 µg/ml of
celecoxib.
ANALYSIS OF FORMULATION
20 tablets were taken individually and triturated to fine powder and take equivalent to 75mg
of Pregablin and 200mg of Celecoxib in to a 10 ml clean dry volumetric flasks, add 7ml of
RESULTS AND DISCUSSION
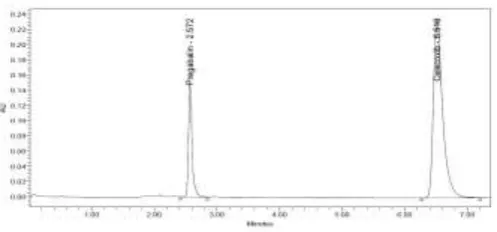
In the method the both drugs are eluted with a run time of 10min using potassium di
hydrogen orthophosphate buffer of pH 6.5 and acetonitrile in the ratio of 70:30 as mobile
phase, the retention times for Pregabalin and Celecoxib were 2.527 min and 6.516 min
respectively at the flow rate of 1ml/min. the wavelength selected for determination was
[image:3.595.176.425.499.615.2]238nm for both drugs. The tailing factor, resolution, theoretical plate count were reported in
table.
The linearity of PRE and CEL were determined by calibration curves and linearity table the
range of 37.5 µg/ml-281.25 µg/ml and 100 µg/ml- 750 µg/ml respectively, the regression
coefficient for PRE and CEL were 0.999 and 0.999 respectively. Precision was measured for
intraday and checked for repeatability and %RSD for repeatability 0.08 and 0.4 for PRE and
CEL respectively. The RSD was found to be within the limit and the results were tabulated.
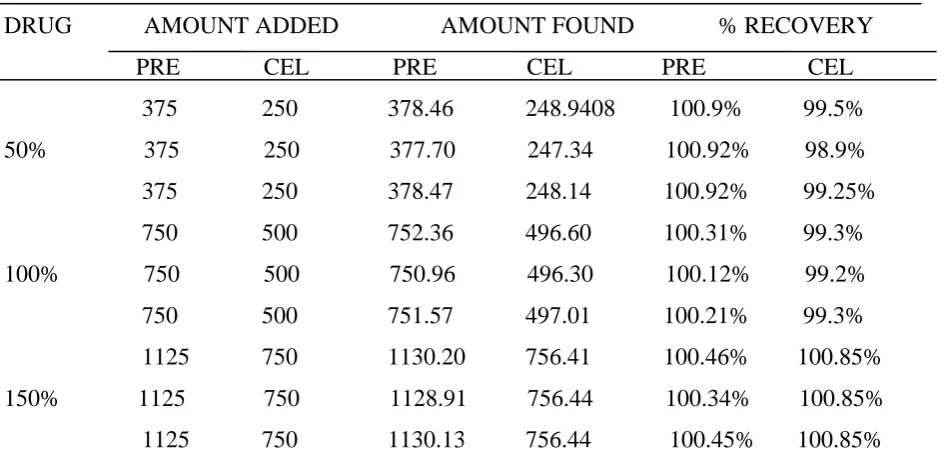
The accuracy was determined by studying the percentage recovery. the recovery studies are
performed for 505, 100% and 150% solution of PRE and CEL mixture. The results are
tabulated below.
The robustness was determined by changing the parameters like temperature and flow rate
and the %RSD was calculated by taking the results for 3 injections. The results were
mentioned in the table.
Table: 1 SYSTEM SUITABILITY PARAMETERS
PARAMETER PRE CEL
RETENTION TIME 2.572 6.516
TAILING FACTOR 1.44 1.56
THEORETICAL PLATE 10751 10224
[image:3.595.70.463.657.761.2]TABLE 2. RECOVERY STUDIES
DRUG AMOUNT ADDED AMOUNT FOUND % RECOVERY
PRE CEL PRE CEL PRE CEL
375 250 378.46 248.9408 100.9% 99.5%
50% 375 250 377.70 247.34 100.92% 98.9%
375 250 378.47 248.14 100.92% 99.25%
750 500 752.36 496.60 100.31% 99.3%
100% 750 500 750.96 496.30 100.12% 99.2%
750 500 751.57 497.01 100.21% 99.3%
1125 750 1130.20 756.41 100.46% 100.85%
150% 1125 750 1128.91 756.44 100.34% 100.85%
1125 750 1130.13 756.44 100.45% 100.85%
TABLE 3 INTRADEY PRECISION
Injection Area of Pregabalin Area of Celecoxib
Injection-1 296551 6148603
Injection-2 299707 6153129
Injection-3 295025 6154783
Injection-4 293010 6127838
Injection-5 298788 6122394
Injection-6 297910 6148809
Average 296831.8 6142593
Standard Deviation 2498.221 13856.92
%RSD 0.8 0.2
TABLE 4 LINEARITY
Level
Cocentration (ug/ml) pregabalin
Cocentration (ug/ml) celecoxib
Response Pregabalin
Response celecoxib
Linearity Pregabalin
Linearity Celecoxib
CONCLUSION
The proposed HPLC method was found to be simple, specific, precise, accurate, rapid and
economical for simultaneous estimation of Pregabalin and celecoxib in bulk and
pharmaceutical dosage form.
The method is completely validated and satisfactory results were obtained for all parameters
tested.
ACKNOWLEDGEMENT
This work was partially supported by Sri Balaji College of pharmacy, Pulla Reddy Institute
of Pharmacy and Gland Institute Of Pharmaceutical Sciences, Narsapur.
REFERNCES
1. Gurudeep chatwal and sham anand, Instrumental methods of chemical analysis Analysis.
Himalaya publishers, 7th edition, 1992; Pg. no 2.624-2.639.
3. Vogel’s Text book of quantitative chemical analysis. Published by Dorling Kindersley
pvt.ltd. 6th edition, 2008; 289-304.
4. Lloyd R. Snyder et al., practical HPLC method development. John wiley & son’s
publishers, 2nd edition, 1997; 350-400.
5. Kannapan N et al.., Analytical RP-HPLC Method for Development and Validation of
Pregabalin and Methylcobalamine in Combined Capsule Formulation:Journal of Applied
Chemical Research, ISSN: 2008-3815, 13, 85-89 (2010).
6. Sarvesh Kumar Mishra et al.., Stability Indicating Rp-Hplc Method For Determination Of
Pregabalin Using Ich Guidelines: International Journal Of Natural Product Science 2012;
Spl Issue 1: 130.
7. G. B. Kasawar et al.., Development and Validation of HPLC Method for the
Determination of Pregabalin in Capsules: Indian J Pharm Sci. 2010 Jul-Aug; 72(4):
517–519.
8. Ashu M et al.., Development and validation of rapid HPLC method for determination of
Pregabalin in bulk drug and capsule dosage forms: Der Pharma Chemica, 2011; 3(1):
482-489.
9. Naresh Chandra Reddy M et al., RP-HPLC Determination of Related substances of
Pregabalin in bulk and pharmaceutical dosage form: International Journal of Chemical
and Pharmaceutical Sciences ISSN: 0976-9390, 2012; June., 3(2): 40-46.
10.P.Nalla Kumar et al., RP – HPLC method development and validation for the
simultaneous estimation of methyl cobalamine and pregabalin in capsules.
11.Krishnaveni Get al., A Novel RP-HPLC method for the Quantification of Celecoxib in
Formulations: Research Journal of Pharmaceutical, Biological and Chemical Sciences,
January – March 2012; 3(1): 340-346.
12.KG. Jadhav et al.., A Validated RP-HPLC Method for the Determination of Celecoxib in
Bulk and Pharmaceutical Dosage Form: International Journal of Research in
Pharmaceutical and Biomedical Sciences ISSN: 2229-3701 Jul – Sep2012; 3(3):
1312-1316.
13.Pramod M. Dhabu et al., A Stability-Indicating HPLC Method to Determine Celecoxib in
Capsule Formulations: informa 2002; 28(7): 815-821.
14.Jayasagar G Validated HPLC method for the determination of celecoxib in human serum
and its application in a clinical pharmacokinetic study: Pharmazie. 2002 Sep; 57(9):
15.Patel Prakash et al., Development And Validation Of Rp-Hplc Method For The
Simultaneous Estimation Of Diacerein And Celecoxib In Pharmaceutical Dosage Form:
Inventi Rapid: Pharm Analysis & Quality Assurance Vol. 2013 publication
date: 2013/6/4.
16.Rao RN et al., Development and validation of a reversed-phase liquid chromatographic
method for separation and simultaneous determination of COX-2 inhibitors in
pharmaceuticals and its application to biological fluids: Biomed Chromatogr. 2005 Jun;
19(5): 362-8.