FORMULATION AND EVALUATION OF ANTIDIABETIC TABLETS:
EFFECT OF ABSORPTION ENHANCSER
Ashwini Kumar*, Mayank Bansal
Department of Pharmaceutical Technology, Meerut Institute of Engineering and Technology, NH-58, Bypass Road- Baghpat Crossing, Meerut – 250005, Uttar Pradesh, INDIA.
ABSTRACT
The present study is to formulate an antidiabetic tablet containing natural permeation enhancer which enhances gastrointestinal absorption of poorly absorbable antidiabetic drug. Metformin hydrochloride (HCl) is a BCS class III drug which has high solubility and poor intestinal absorption characteristic. The gastrointestinal absorption of metformin hydrochloride was enhanced using natural enhancer like gokhru fruit (Tribulus terrestris Linn) extract. The permeation of drug was measured by everted sac technique using chicken intestine. The drug was absorbed through chicken intestine mainly by passive diffusion mechanism. The absorbed drug was determined by using U.V Visible Spectrophotometer at 234nm. After analyzing the results it was found that gokhru fruit extract enhance the absorption of metformin hydrochloride from chicken intestine and the absorption enhancement activity of the plant was due to the presence of saponins in the extract. This extract was used to reduce dose of metformin hydrochloride in tablet dosage form. For optimizing the dose of metformin hydrochloride, different batches of tablets (F0 to F11) was prepared by wet granulation method with different concentration of gokhru extract and metformin hydrochloride. Tablets were evaluated for various parameters like weight variation, hardness, friability, disintegration, dissolution, permeation and stability. Results showed batch F7 and F8 was permeated in amount similar to control batch F0. But after studying all evaluation parameters F7 was found to be optimized batch because tablet hardness was acceptable for this batch and it does not take moisture from environment while F8 easily taken moisture from environment and its hardness was comparatively less than F7.
Volume 3, Issue 10, 1426-1445. Research Article ISSN 2277– 7105
Article Received on 08 October 2014,
Revised on 02 Nov 2014, Accepted on 26 Nov 2014
*Correspondence for Author Ashwini Kumar Department of Pharmaceutical Technology, Meerut
Institute of Engineering
and Technology, NH-58,
Bypass Road- Baghpat
Crossing, Meerut – Uttar
Pradesh, INDIA.
KEYWORDS: Metformin hydrochloride, Absorption enhancer, Gokhru fruit extract,
Everted sac method, Antidiabetic tablet.
INTRODUCTION
Oral administration is the most common method of drug delivery from ancient time and still it is the most preferred route for drug administration. The important aim for the pharmaceutical industry is to optimize bioavailability of orally administrated drug. Drug transport across mucosal membrane is a fundamental step for oral absorption and systemic availability. The drugs with small molecular weight and lipophilic in nature are easily permeated through the intestinal barrier whereas macromolecules are restricted by the intestinal epithelial barrier which causes reduced bioavailability. Mostly available drugs fall under the class III of the biopharmaceutical classification system (BCS), possess high therapeutic potential but cannot be effectively delivered by oral route because of its poor permeation across the gastro intestinal epithelia. [1, 2]
Antidiabetic tablets treat diabetes mellitus by lowering glucose levels in the blood. With the exceptions of insulin, exenatide, liraglutide and pramlintide, all are administered orally and are thus also called oral hypoglycaemic agents or oral antihyperglycemic agents. [3]
Drug delivery by oral route is preferred for its convenience. Tablets and capsules can be formulated in large quantity at low price as compared to other dosage form. Therefore, in lead optimization step of drug discovery, oral bioavailability is important. It depends on various factors like intestinal permeability, solubility during gastrointestinal transit, liberation from dosage form, liability to efflux and metabolism. Most of the drug molecules show poor permeability due to their physicochemical properties which are difficult to change, so to enhance permeation transiently, an excipient may be added externally. [4, 5]
MATERIAL AND METHODS
DRUG AND CHEMICALS
Metformin hydrochloride was obtained as a gift sample from Abhilasha Pharma Pvt. Ltd., Ankleshwar, Gujarat. Starch, Polyvinylpyrrolidone K30, Magnesium stearate and n-Octanol used were of CDH, Delhi. Avicel, Croscarmellose sodium used were of Sigma Aldrich, USA. Sodium hydroxide, Potassium dihydrogen phosphate, Chloroform, Acetone, Ether used were of Fischer Scientific Ltd. All chemicals were provided by Department of Pharmaceutical Technology, Meerut Institute of Engineering and Technology, Meerut. Different reagents for testing of plant extract were also provided by Department of Pharmaceutical Technology, Meerut Institute of Engineering and Technology, Meerut.
Selection of drug
Metformin hydrochloride was selected from Antidiabetic category due to its poor intestinal permeability property.
IDENTIFICATION OF DRUG SUBSTANCE
FTIR
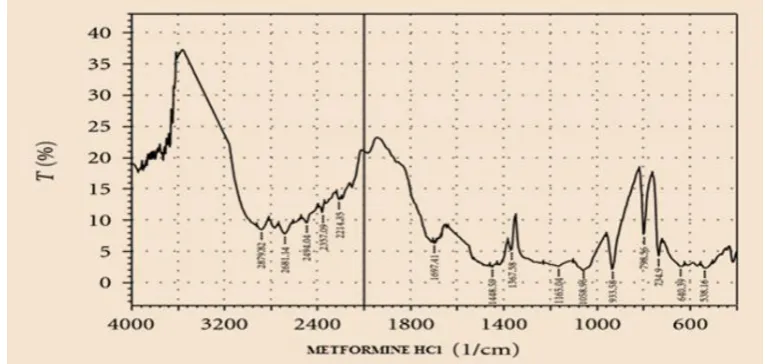
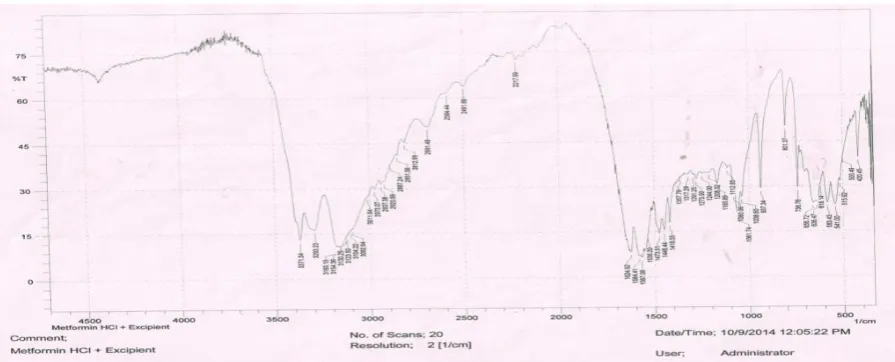
[image:3.595.105.488.453.635.2]FT Infra-red absorption spectrum of drug and exicipients were characterized using SHIMADZU FT-IR spectrophotometer using standard KBr disc method.
Fig 1: Standard Infra-red spectra of Metformine HCl (as reported by Florey).
The peaks from infra red spectra of metformine HCl (sample) must be identical to standard. Melting point
Partition coefficient
The partition coefficient is a measure of the extent a substance partition between two phases, generally an oil phase and an aqueous phase. This ratio is often expressed as log P. Log P measurement is useful parameter for understanding the behavior of drug molecules at the preformulation stage.
Partition coefficient (P) = Drug conc. in organic phase
Drug conc. in aqueous phase
Drugs having values of Log P much greater than 1 are classified as lipophilic, whereas those with partition coefficients much less than 1 are indicative of a hydrophilic drug.
Preparation of plant extract [7, 8]
Fresh and dried fruits of Tribulus terrestris were collected from surroundings of Meerut city. Plant was authenticated by Department of Botany, Meerut Collage, Meerut. Collected material was crushed in a mortar and pestle to get powder. The powder material was collected and subjected to Soxhlet apparatus for hot solvent extraction using ethanol as a solvent at 60-70⁰C for 20 hours. Solvent are removed from marc using rotary evaporator. The resulting residue was dried in water bath and yield was recorded.
Selection of other excipients [9]
Incorporation of avicel shows capillary action, entry of water inside tablet result in swelling of tablet by which tablet disintegration and dissolution property gets enhanced. Incorporation of starch and PVP K30 in powder mixture blends provides binding property to tablets. Incorporation of magnesium stearate in granules blends increases flow property of granules by acting as lubricant. Incorporation of croscarmellose sodium in granules blends increases disintegration of tablet.
Drug excipient compatibility study
FTIR specta of the physical mixture of drug and excipients selected was compared with the FTIR spectra of pure drug to find out the evidence of any incompatibility between drug and excipients.
TABLET PREPARATION METHOD [10 – 15]
controllable drug release can be built in using wet granulation without relying on the intrinsic properties of the drug or the excipients.
Batches formulated are shown in table 1.
Table 1: Formulation batches of Metformin hydrochloride tablets.
F0 and F1 were formulated using 12 mm die and punch. F2, F3, F4, F5, and F8 were formulated using 10 mm die and punch while, F6, F7, F9, F10, and F11 using 8 mm.
PRECOMPRESSION STUDY
Physicochemical properties of dry powder blend
The granulation characteristics are the most important for a formulation scientist and are universally measured. These basic measurements of the granulation have been used to develop and monitor the manufacture of many successful solid pharmaceutical dosage forms. Density: Granule density may influence compressibility, tablet porosity, dissolution and other properties. Bulk density and tapped density was measured.
Bulk density: The bulk density of a powder is the ratio of the mass of an untapped powder sample and its volume including the contribution of the interparticulate void volume. It can be calculated by following formula
Pour (or Bulk) density = Mass
Untapped volume
Batches Metformin
HCl (mg)
Avicel (mg)
Starch (mg)
PVP K30 (mg)
Croscarmellose sodium (mg)
Magnesium stearate (mg)
Gokhru (mg)
F0 500.00 62.50 40.00 50.00 12.50 6.25 -
F1 500.00 62.50 40.00 50.00 12.50 6.25 100
F2 300.00 37.50 24.00 30.00 7.50 3.75 100.00
F3 300.00 37.50 24.00 30.00 7.50 3.75 75.00
F4 200.00 25.00 16.00 20.00 5.00 2.50 100.00
F5 200.00 25.00 16.00 20.00 5.00 2.50 75.00
F6 200.00 25.00 16.00 20.00 5.00 2.50 50.00
F7 200.00 25.00 16.00 20.00 5.00 2.50 25.00
F8 175.00 21.88 14.00 17.50 4.38 2.19 100.00
F9 175.00 21.88 14.00 17.50 4.38 2.19 75.00
F10 175.00 21.88 14.00 17.50 4.38 2.19 50.00
Tapped density: The tapped density is an increased bulk density attained after 100 mechanically tapping a container such as graduated measuring cylinder or vessel containing the powder sample. It can be calculated by formula
Tapped density = Mass
Tapped volume
Flow properties
For the movement of granules from hopper to die cavity sufficient flow properties are essential. Improper flow cause weight variation and fails to content uniformity test. Flow properties of granules can be measured by Carr’s index, hausner ratio and angle of repose. Carr’s index
The Carr‘s index or Carr's Compressibility Index is an indication of the compressibility of a powder. It can be calculated by formula
Carr’s index = (Tapped density - Bulk density) * 100
Tapped density
Hausner ratio: The Hausner ratio is a number that is correlated to the flow ability of a powder or granular material. It can be calculated by formula
Hausner ratio = tapped density
bulk density
Angle of repose
It is maximum angle between the surface of a pile of powder and horizontal plane, when powders are allowed to flow freely from a certain height. Angle of repose can be determined by fixing the funnel in a stand at a height of exactly 2cm from the pile formed. Powder mixture was again slowly passed through the funnel. A heap of agglomerates was formed. Measure the height and radius of the heap and calculate the angle of repose by putting the values in the given equation:
Tan θ = h
r
Table 2: Scale of flowability (experimental considerations for the Carr’s index, hausner
ratio and angle of repose).
Carr’s index (%) Hausner ratio Angle of repose Type of flow
≤10 1.00-1.11 25-30 Excellent
11-15 1.12-1.18 31-35 Good
16-20 1.19-1.25 36-40 Fair
21-25 1.26-1.34 41-45 Passable
26-31 1.35-1.45 46-55 Poor
32-37 1.46-1.59 56-65 Very poor
˃ 38 ˃ 1.60 ˃ 66 Very very poor
POSTCOMPRESSION STUDY
General appearance: The general appearance of a tablet, its identity and general elegance is
essential for consumer acceptance and for control of tablet-to-tablet uniformity. These involves the measurement of size, shape, colour, presence or absence of odour, taste etc. Size and shape
It can be dimensionally described and controlled. The thickness of a tablet is only variables. Tablet thickness can be measured by micrometer or by a verneer calliper (For-bro Engineers, Mumbai, India). Tablet thickness should be controlled within a ±5% mean.
Organoleptic properties
Colour distribution must be uniform with no mottling. The presence of odour in a batch of tablet indicates a stability problem. Chipping, cracks, contamination from foreign solid substances (hair, drops of oil, dirt) should not be present. Surface texture (smooth vs rough) and appearance (shining vs dull) should have zero defects.
Tablet hardness
Tablets require a certain amount of strength or hardness and resistance to friability to withstand mechanical shakes of handling in manufacture, packing and shipping. Hardness generally measures the tablet crushing strength. The strength of a tablet was determined by either Monsanto Tester or Tablet breaking force tester (Electrolab, USP).
Tablet friability
deducted and accurately weighed. The percent weight loss was calculated. According to IP, it must be less than 1%.
Tablet weight variation
Twenty tablets were randomly selected and weighed individually. Calculate average weight and compare the individual tablet weight to the average. Tablet passed the test if no more than 2 tablets are outside the percentage limit given in the pharmacopoeia and none deviates by more than twice that percentage. IP limits for tablet weight variation are given in table 3. Table 3: Weight variation limit as per IP.
IP Limit
80 mg or less ± 10% More than 80 mg or
less than 250 mg ± 7.5% 250 mg or more ± 5% Disintegration study
This study was conducted by Electrolab disintegration tester (USP) at 37º ± 2ºC temperature using 900 ml of 6.8 pH phosphate buffer as a medium. Tablet should be disintegrated within 15 minutes. Test was conducted on 6 tablets. If 1 or 2 tablets or capsules fail to disintegrate, repeat the test on 12 additional tablets or capsules; not less than 16 of the total of 18 tablets or capsules tested should disintegrate within time limit.
Dissolution study
This study was conducted by basket type dissolution apparatus (Electrolab dissolution tester USP) at 37º ± 2ºC temperature using 900 ml of 6.8 pH phosphate buffer as a medium at 100 rpm for 45 minutes. Withdraw a suitable volume of the medium and filter, dilute suitably with buffer and measure the absorbance of the resulting solution at λmax 233 nm. Calculate the content of Metformin hydrochloride. Test was conducted on 6 tablets. Not less than 70 per cent of the stated amount of Metformin hydrochloride at specific absorbance (233 nm) in pH 6.8 phosphate buffer.
Drug assay
100 ml with Water and measure the absorbance of the resulting solution at λmax 232 nm. Calculate the content of Metformin hydrochloride at specific absorbance (232 nm) in water. Drug Permeation study [16, 17]
To perform the absorption studies Everted-Sac modification method was selected. Active transport occur unidirectional while passive transport occur bidirectional. In the case of intestine, it proceeds from the mucosa to the serosa side for active transport. For testing of absorption chicken intestine and everted chicken intestine are used. The normal intestine tied on both sides and filled with a drug solution is immersed into buffer solution. In the case of passive diffusion, the drug will diffuse into the outside liquid until equilibrium is obtained. In the case of active transport more or less all of the drug will be transported to the outside solution.
Physical stability study
Physical stability studies were conducted according to international conference on harmonization (ICH) guidelines. The best formulations were enclosed in desiccator containing calcium chloride. The desiccator was kept at 40˚C for 45 days. At specific time intervals, the tablets were examined for differences in their organoleptic property, hardness and friability, disintegration, dissolution and permeation characteristics.
RESULT AND DISCUSSION
PREFORMULATION STUDIES
Organoleptic properties: The sample of Metformin hydrochloride was found to be white, odourless, crystalline powder. This complies with IP.
Melting point: The melting point of Metformin hydrochloride was found to be 223˚C to 224˚C which corresponds to the IP value range of 222˚C to 224˚C that proves the identity and purity of drug.
Solubility: Solubility of Metformin hydrochloride is shown in table 4.
Table 4: Solubility in different solvent system
S. No. Solvent Discription
1 Water Highly soluble 2 Ethanol Sparingly soluble 3 Chloroform Insoluble
Table clearly show that Metformin hydrochloride was highly soluble in water which showed a property of BCS class III drug. Metformin hydrochloride was sparingly soluble in ethanol while insoluble in chloroform, acetone, and ether.
Determination of λmax of Metformin hydrochloride
The scanned λmax in water were found to be 232 nm which was similar to reported λmax i.e. 232 nm and in 6.8 pH phosphate buffer were found to be 233 nm which was similar to reported λmax i.e. 233 nm while in 7.4 pH phosphate buffer were found to be 234 nm which was similar to reported λmax i.e. 234 nm.
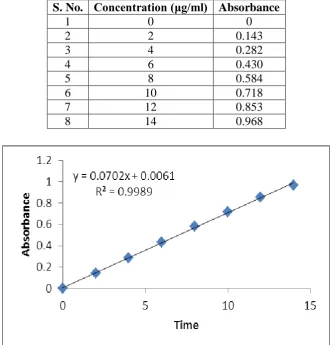
[image:10.595.131.465.292.638.2]Table 5: Calibration curve of Metformine hydrochloride in water at λmax 232 nm
Fig 2: calibration curve of Metformin hydrochloride in water. S. No. Concentration (μg/ml) Absorbance
1 0 0
2 2 0.143
3 4 0.282
4 6 0.430
5 8 0.584
6 10 0.718
7 12 0.853
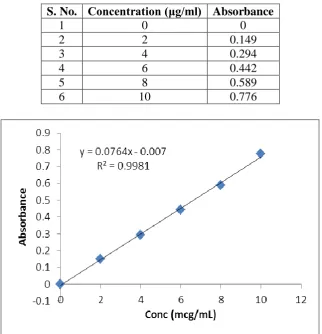
Table 6: Calibration curve of Metformine hydrochloride in 6.8 pH phosphate buffer at
λmax 233 nm.
Fig 3: calibration curve of Metformin hydrochloride in 6.8 pH phosphate buffer.
Table 7: Calibration curve of Metformine hydrochloride in 7.4 pH phosphate buffer at
λmax 234 nm.
S. No. Concentration (μg/ml) Absorbance
1 0 0
2 2 0.149
3 4 0.294
4 6 0.442
5 8 0.589
6 10 0.776
S. No. Concentration (μg/ml) Absorbance
1 0 0
2 2 0.197
3 4 0.390
4 6 0.567
5 8 0.730
[image:11.595.177.419.548.649.2]Fig 4: Calibration curve of Metformin hydrochloride in 7.4 pH phosphate buffer.
Table 8: Metformine HCl calibration curves in various solvent and its validation
parameters
Solvent system λmax r2 Equation of line
Water 232 nm 0.999 y=0.070x+0.006 Phosphate buffer pH 6.8 233 nm 0.998 y=0.076x-0.007 Phosphate buffer pH 7.4 234 nm 0.999 y=0.090x+0.013
Calibration curves of Metformine hydrochloride were prepared in various solvents as shown in the Figure 2, 3 and 4. Equation of line and correlation coefficient of calibration curve was determined and given in the table 8.
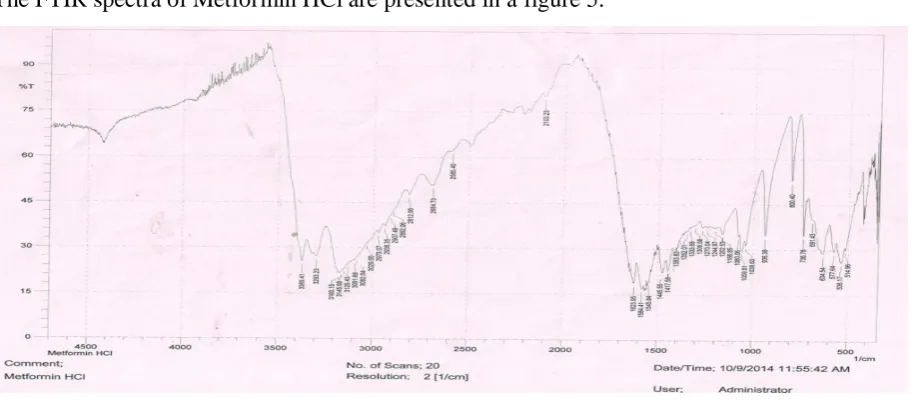
Fourier transforms infrared (FTIR) spectroscopy
The FTIR spectra of Metformin HCl are presented in a figure 5.
Fig 5: FTIR of Metformin HCl
[image:12.595.76.533.490.690.2]Table 9: The interpretation of FTIR spectra of drug.
Functional group Reported frequency (cm-1) Observed frequency (cm-1)
CH3:C-H Stretching 3000-2850 2973.07
C-H bending 1470-1450 1445.55
C-H rocking 1370-1350 1352.68
C-N stretching 1250-1020 1244.97
1⁰ amine: N-H stretching 3400-3300 and 3330-3250 3369.41 and 3293.23
N-H bending 1650-1580 1623.95
N-H wagging 910-665 800.40
Partition coefficient: Partition coefficient was obtained by calculating with the formula;
Po/w = Coil
Cwater
Po/w =
28.90
= 0.061344 471.11
Log P= -1.21
Log P of the sample was found to be -1.21.
Hence, the drug sample (Metformine HCl) was hydrophilic (log P ≤1). Drug excipients compatibility study
[image:13.595.75.523.538.719.2]FTIR specta of the physical mixture was compared with the FTIR spectra of pure drug to find out the evidence of any incompatibility between drug and excipients. FTIR spectra of physical mixtures of Metformin hydrochloride and excipients are presented in Figure 6.
Table 10: The interpretation of FTIR spectra of drug with excipients.
Functional group Reported frequency (cm-1) Observed frequency (cm-1)
CH3:C-H Stretching 3000-2850 2920.99
C-H bending 1470-1450 1448.44
C-H rocking 1370-1350 1357.79
C-N stretching 1250-1020 1244.00
1⁰ amine: N-H stretching 3400-3300 and 3330-3250 3371.34 and 3293.23
N-H bending 1650-1580 1623.95
N-H wagging 910-665 801.37
PRECOMPRESSION STUDIES
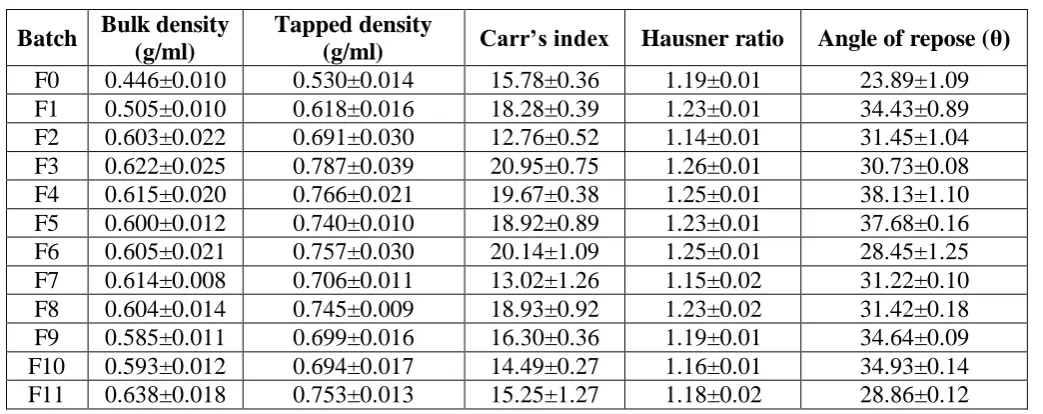
Precompression study is performed before compression process of granules. In this, physicochemical property of powder mixture, granules property and their tests were studied. Prepared granules was evaluated for bulk characterization (bulk density, tapped density), flow properties (angle of repose) and compression characteristics (Carr‘s index, Hausner ratio).
Table 11: Physicochemical properties of dry powder blend.
Batch Bulk density
(g/ml)
Tapped density
(g/ml) Carr’s index Hausner ratio Angle of repose (θ)
F0 0.446±0.010 0.530±0.014 15.78±0.36 1.19±0.01 23.89±1.09 F1 0.505±0.010 0.618±0.016 18.28±0.39 1.23±0.01 34.43±0.89 F2 0.603±0.022 0.691±0.030 12.76±0.52 1.14±0.01 31.45±1.04 F3 0.622±0.025 0.787±0.039 20.95±0.75 1.26±0.01 30.73±0.08 F4 0.615±0.020 0.766±0.021 19.67±0.38 1.25±0.01 38.13±1.10 F5 0.600±0.012 0.740±0.010 18.92±0.89 1.23±0.01 37.68±0.16 F6 0.605±0.021 0.757±0.030 20.14±1.09 1.25±0.01 28.45±1.25 F7 0.614±0.008 0.706±0.011 13.02±1.26 1.15±0.02 31.22±0.10 F8 0.604±0.014 0.745±0.009 18.93±0.92 1.23±0.02 31.42±0.18 F9 0.585±0.011 0.699±0.016 16.30±0.36 1.19±0.01 34.64±0.09 F10 0.593±0.012 0.694±0.017 14.49±0.27 1.16±0.01 34.93±0.14 F11 0.638±0.018 0.753±0.013 15.25±1.27 1.18±0.02 28.86±0.12 In all batches F0 had lowest bulk and tapped density while F11 had highest bulk density and
F3 had highest tapped density. The batches exhibited 1.14 ± 0.01 to 1.26 ± 0.01 Hausner
[image:14.595.39.561.376.583.2]had fair flow property. F0 had lowest angle of repose while F4 had highest showed that F0 had best flow property.
POSTCOMPRESSION STUDIES
After preparation of tablets following physical characteristics of tablets were studied which are given in the table 12.
Table 12: Physical characterization of formulation.
[image:15.595.26.568.218.441.2]Batch
Tablet hardness
(kg/cm2)
Tablet thickness (mm) Tablet weight (mg) Tablet friability (%) Disintegration time Dissolution
(%) Assay (%)
F0 5.17±0.06 5.07±0.04 681.05±1.73 0.19±0.10 13.38±0.08 72.98±0.43 100.19±0.68 F1 4.70±0.10 5.75±0.03 780.70±2.89 0.12±0.09 12.67±0.29 73.10±0.32 101.62±0.44 F2 4.13±0.06 5.21±0.03 511.40±3.07 0.21±0.14 10.10±0.05 72.61±0.66 101.71±0.38 F3 4.53±0.06 4.94±0.03 480.70±2.18 0.21±0.10 12.08±0.08 77.17±0.68 98.95±0.64 F4 4.17±0.06 3.72±0.04 370.80±1.79 0.35±0.18 11.07±0.06 77.16±0.98 98.52±0.30 F5 4.23±0.06 3.51±0.03 350.65±2.01 0.40±0.15 10.40±0.09 73.21±0.47 99.33±0.44 F6 4.57±0.06 5.13±0.02 320.60±1.82 0.34±0.23 13.07±0.03 72.27±0.58 97.95±0.59 F7 5.07±0.06 4.61±0.02 301.30±2.15 0.43±0.22 12.85±0.30 71.44±0.61 98.76±0.36 F8 3.87±0.06 3.53±0.03 340.55±2.13 0.32±0.22 11.12±0.10 79.39±0.68 100.57±0.52 F9 4.10±0.10 5.36±0.02 310.50±1.99 0.32±0.21 11.35±0.05 75.88±0.48 97.52±0.64 F10 4.27±0.06 4.73±0.02 290.65±1.81 0.31±0.25 12.08±0.10 71.44±0.52 99.24±0.36 F11 4.53±0.06 4.04±0.07 260.50±2.19 0.50±0.36 12.18±0.03 73.54±0.28 97.95±0.50
content of all batches range was acceptable. F2 had highest drug presented in the batch i.e. 101.71 ± 0.38 whereas F9 had lowest i.e. 97.52 ± 0.64.
Drug Permeation Study
In this work, chicken intestinal segment was used as a model for permeability studies. Drug permeation study is carried out by everted sac method.
[image:16.595.66.562.248.423.2]The permeability of Metformin hydrochloride across the excised intestinal segment is shown in table 13.
Table 13: Permeation data of tablets using everted sac method.
Time
(min) F0 F1 F2 F3 F4 F5 F6 F7 F8 F9 F10 F11
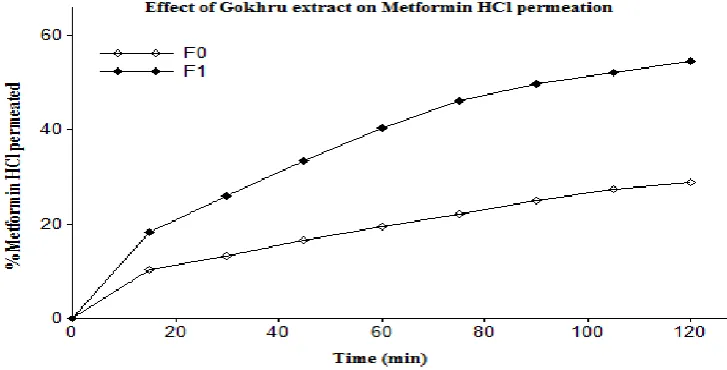
[image:16.595.115.479.470.655.2]0 0.0 0.0 0.0 0.0 0.0 0.0 0.0 0.0 0.0 0.0 0.0 0.0 15 51.8 91.0 78.0 74.7 37.6 37.2 33.0 30.7 30.9 27.5 24.1 24.1 30 66.3 129.8 114.5 113.9 67.4 66.9 62.5 61.4 65.4 62.3 58.7 51.0 45 83.1 166.4 148.7 146.0 95.6 93.7 92.3 87.4 83.1 78.6 77.5 73.0 60 97.5 201.4 173.4 171.5 117.1 116.5 114.1 111.9 104.0 99.7 96.2 94.0 75 110.0 230.9 197.6 195.4 133.6 131.0 128.5 122.7 115.4 114.0 109.7 104.2 90 124.6 248.8 217.6 215.4 144.5 140.7 137.3 131.6 127.2 123.8 119.6 115.6 105 136.6 260.4 231.2 228.5 153.7 148.5 144.8 140.0 136.7 133.1 128.2 123.1 120 144.5 271.9 243.3 240.7 161.7 156.6 152.7 147.2 144.4 140.5 135.2 130.5 When gokhru extract was added in the formulation than drug was permeated in higher amount in comparision to control batch as shown in figure 7.
Fig 7: Effect of Gokhru extract on Metformin HCl permeation.
Gokhru concentration also played important role in drug permeation. Figure 8 clearly shown permeation increases with increase in Gokhru concentration.
Fig 8: Effect of change in concentration of Gokhru extract in Drug permeation.
Figure 8 is based on permeation data of batch F4, F5, F6, and F7 each having Metformin hydrochloride 200 mg with 100 mg, 75 mg, 50 mg, and 25 mg of Gokhru extract respectively.
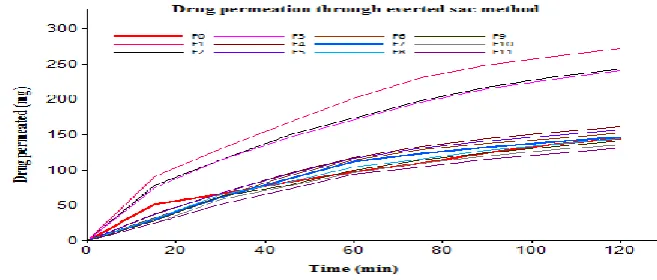
Metformin hydrochloride is BCS class III drug. Hence, it has low permeability property by which its bioavailability is low. Metformin HCl is used in high dose. My aim is to overcome this issue. Tablets were formulated with different concentration of Gokhru extract and compared all batches for permeation in quantity near about control batch. Permeation data is represented in figure below.
[image:17.595.131.460.507.647.2]
Fig 9: Drug permeation through everted sac method of all batches.
The increased permeability was found due to the ability of permeation enhancer (Gokhru fruit extract) by promoting permeability in the absorptive direction by opening the tight junctions and/or by inhibiting the active efflux system. Thus, by use of Gokhru fruit extract the problem of less permeability can be solved which may lead to increased absorption of Metformin hydrochloride in tablet formulation which in turn may increase its bioavailability. Stability study
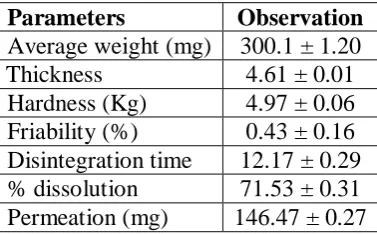
[image:18.595.204.393.347.464.2]Stability of the optimized tablet batch was studied after 45 days according to reference. There was no capping and lamination was observed in optimized tablet batch. For the stability study of the optimized formulation; hardness, physical appearance, friability and drug content were studied within prescribed limit as per IP and there was not so much difference found in disintegration, dissolution and permeability study. The results are shown in table 14.
Table 14: Result of stability studies.
Parameters Observation
Average weight (mg) 300.1 ± 1.20 Thickness 4.61 ± 0.01
Hardness (Kg) 4.97 ± 0.06 Friability (%) 0.43 ± 0.16 Disintegration time 12.17 ± 0.29 % dissolution 71.53 ± 0.31 Permeation (mg) 146.47 ± 0.27
There was no significant change in all parameters which was studied in stability study. CONCLUSION
In this work, an antidiabetic tablet containing natural permeation enhancer was formulated which enhanced the absorption of poorly absorbable antidiabetic drug from intestine. In-Vitro everted sac method using chicken intestine was selected for the absorption studies. The
was formulated by wet granulation method with different concentration of gokhru extract and metformin hydrochloride. Granules were evaluated for various parameters like particle size distribution, densities and flow property. Tablets were evaluated for various parameters like weight variation, hardness, friability, disintegration, dissolution, assay, permeation and stability. Results showed batch F7 and F8 was permeated in amount similar to control batch F0. But after studying all evaluation parameter F7 was found to be optimized batch because tablet hardness was acceptable for this batch and it does not take moisture from environment while F8 easily taken moisture from environment. F7 was formulated with 200mg metformin hydrochloride while F0 with 500mg. This result showed that with the use of natural permeation enhancer like saponin part of gokhru plant extract 2.5 times lesser amount of drug is required to get same permeated amount of drug.
Future Scope of the Study
Results obtained from everted sac studies may be correlated with other permeation models using e.g. Caco 2 model, in vivo study besides the drug permeation behaviour. Preclinical studies and clinical study of the formulation can be done for safety of the formulation. Hence, scale up issue of this study can be established at industrial level.
ACKNOWLEDGEMENT
Authors gratefully acknowledge the gift of Metformin hydrochloride from Abhilasha Pharma Pvt. Ltd. (Ankleshwar, Gujrat).
Authors also acknowledge the Department of Botany, Meerut Collage, Meerut for authentication of plant Gokhru.
REFERENCES
1. Singh D, Sharma PK and Singh UV. Enhancement of intestinal absorption of poorly absorbed drugs by using various permeation enhancers: An overview. WJPPS, 2013; 2 (1): 179-98.
2. Shaikh MSI, Nikita DD and Bhamber R. Permeability enhancement techniques for poorly permeable drugs: A review. J. Appl. Pharm. Sci., 2012; 02 (06): 34-9.
4. Pradeep S, Manthena VSV, Harmander PSC and Ramesh P. Absorption enhancement, mechanistic and toxicity studies of medium chain fatty acids, cyclodextrins and bile salts as peroral absorption enhancers. Farmaco, 2005; 60: 884–93.
5. Carsten B, Adrian F, Urte K, Torsten W. Comparison of permeation enhancing strategies for an oral factor Xa inhibitor using the Caco-2 cell monolayer model. Eur. J. Pharm. Biopharm., 2006; 64: 229–37.
6. Jacob MC, Favre M and Bensa JC. Membrane cell permeabilisation with saponin and multiparametric analysis by flow cytometry. Cytometry, 1991; 12 (6): 550-8.
7. Asadulla S. Anti-arrthritic activities of Tribulus terristris Linn fruits (gokhru) in albino rats. Int. J. Res. Phar. Chem., 2011; 1(3): 334-7.
8. Ayyanna C, Rao CM, Sasikala M, Somasekhar P, Kumar AN and Kumar P. Absorption enhancement studies of metformin hydrochloride by using Tribulus Terrestris plant extract. Int. J. Pharm. Technol., 2012; 4 (1): 4118-25.
9. Block LC, Schmeling LO, Couto AG, Silva MAS, Tagliari MP, Bresolin TMB and Mourao SC. Effect of binders on 500mg metformin hydrochloride tablets produced by wet granulation. Rev. Cienc. Farm. Basica Apl., 2009; 30 (2): 145-52.
10.Indian Pharmacopoeia. New Delhi; Controller of publication: 2007 11.British Pharmacopoeia. London; The Stationary Office: 2009.
12.Chandira M, Venkateswarlu BS, Shankarrao JA, Bhowmik D, Jayakar B and Narayana TV. Formulation and evaluation of extended release tablets containing metformin HCl. Int. J. Chem. Tech. Res., 2010; 2 (2): 1320-9.
13.Jadhav CM, Tekade BW, Thakare VM and Patil VR. Formulation and evaluation of sustain release matrix tablet of metformin hydrochloride. WJPPS., 2012; 1 (2): 717-30. 14.Lacman L, Lieberman HA and Kang JL. The theory and practice of industrial pharmacy.
3rd ed., Mumbai; Varghese publishing house: 1987.
15.Aulton ME. Pharmaceutics: The science of dosage form design. 2nd ed., London; Churchill Livingstone: 2001.
16.Dias R, Sakhare S and Mali K. In vitro absorption studies of mucoadhesive tablets of acyclovir. Indian J. Pharm. Educ. Res., 2010; 44(2): 183-8.