FORMULATION AND EVALUATION OF SUSTAINED RELEASE
MATRIX TABLETS OF PIOGLITAZONE
Sanjay Batra*1, Mahesh Kumar Kataria2, Ajay Bilandi 3
1
Research Scholar, M. Pharm (Pharmaceutics) Sem IV, Seth G. L. Bihani S. D. College of
Technical Education, Sri Ganganagar, Rajasthan, India.
2
Professor and Head, Dept. of Pharmaceutics, Seth G. L. Bihani S. D. College of Technical
Education, Sri Ganganagar, Rajasthan, India.
3
Assistant Professor, Dept. of Pharmaceutics, Seth G. L. Bihani S. D. College of Technical
Education, Sri Ganganagar, Rajasthan, India.
ABSTRACT
Pioglitazone Hydrochloride is an oral anti-diabetic agent, which acts
primarily by increasing insulin dependent glucose disposal. There is a
need for sustained release Pioglitazone formulations, which overcome
the various problems associated with the use of this drug in the
prevention and treatment of diabetes. The floating tablets were
prepared by wet granulation method. In the present work efforts have
been made to develop floating drug delivery system for Pioglitazone
Hydrochloride with hydrophilic and hydrophobic polymer in different
ratios to achieve a sustained release for 24 hrs. The in vitro drug
release profile of Pioglitazone hydrochloride tablets containing Ethyl
Cellulose, Xanthan gum and Eudragit RS100 gave desired drug release
profile. The tablets of all formulation were subjected to various
physicochemical evaluation parameters such as thickness, diameter, weight variation,
hardness, friability, drug content, in-vitro buoyancy lag time, total floating time, tablets
density, swelling index and in-vitro dissolution study. The results of all these tests were found
to be satisfactory within the prescribed limits. The formulations showed higher R2 values for
zero order plots indicating that drug release followed zero order kinetics.
KEYWORDS: Pioglitazone hydrochloride, Ethyl Cellulose, sustained release matrix tablets.
Volume 4, Issue 8, 2891-2912. Research Article ISSN 2277– 7105
Article Received on 19 June 2015,
Revised on 10 July 2015, Accepted on 05 Aug 2015
*Correspondence
For Author
Sanjay Batra
Research Scholar, M.
Pharm (Pharmaceutics)
Sem IV, Seth G. L. Bihani
S. D. College of Technical
Education, Sri
Ganganagar (Raj.) INDIA
INTRODUCTION
Enteral route is the most oldest and convenient route for the administration of therapeutic
agents because of low cost of therapy and ease of administration leads to higher level of
patient compliance. Approximately 50% of the drug products available in the market are
administered orally and historically, oral drug administration has been the predominant route
for drug delivery. Tablets are the most commonly and widely used dosage form. This type of
drug delivery system is called conventional drug delivery system and is known to provide an
immediate release of drug. Such immediate release (IR) products results in relatively rapid
drug absorption and onset of accompanying pharmacodynamic effects. However, after
absorption of drug from the dosage form is complete, plasma drug concentrations decline
according to the drug‟s pharmacokinetics profile. Eventually, plasma drug concentrations fall
below the minimum effective plasma concentration (MEC), resulting in loss of therapeutic
activity. Before this point is reached another dose is usually given if a sustained therapeutic
effect is desired. Conventional formulations are required to be administered in multiple doses
and therefore have several disadvantages.[1]
Sustained release dosage forms have been demonstrated to improve therapeutic efficiency by
maintenance of a steady drug plasma concentration. Sustained release, prolonged release,
modified release, extended release or depot formulations are terms used to identify drug
delivery systems that are designed to achieve or extend therapeutic effect by continuously
releasing medication over an extended period of time after administration of a single dose.
The goal in designing sustained delivery system is to reduce the frequency of the dosing or to
increase effectiveness of the drug by localization at the site of action, reducing the dose
required or providing uniform drug delivery. So, sustained release dosage form is a dosage
form that release one or more drugs continuously in a predetermined pattern for a fixed
period of time, either systemically or to a specified target organ. Sustained release dosage
forms provide a better control of plasma drug levels, less dosage frequency, less side effect,
increased efficacy and constant delivery. Various approaches are used to Sustained Release
Drug Delivery System. These are: Diffusion sustained systems, Dissolution sustained
systems, Dissolution and diffusion sustained systems, Ion exchange resin- drug complexes,
pH dependent formulation, Osmotic pressure controlled systems, Swelling and expansion
systems, Floating systems and Bioadhesive or Mucoadhesive systems. Matrix tablet is one of
the most widely used approach to sustained the drug action. Matrix tablets may be defined as
dispersed throughout the hydrophilic or hydrophobic matrices which serves as release rate
retardants”. Matrix drug delivery systems release the drug in continuous manner. These
release the drug by both dissolution controlled as well as diffusion controlled mechanisms.[2]
Pioglitazone belongs to BCS class-II and a member of the thiazolidinedione class (TZD) with
hypoglycemic action. Pioglitazone selectively stimulates the nuclear receptor peroxisome
proliferator-activated receptor gamma (PPAR-γ) and to a lesser extent PPAR-α.Pioglitazone
is used for the treatment of diabetes mellitus type 2 in monotherapy and in combination with
a sulfonylurea, metformin, or insulin. Pioglitazone has also been used to treat non-alcoholic
steatohepatitis, but this use is presently considered experimental. Pioglitazone has also been
found to reduce the risk of conversion from prediabetes to diabetes mellitus type 2 by 72%.
Pioglitazone also lowers the level of glucose in the blood by reducing the production and
secretion of glucose into the blood by the liver.[3] Pioglitazone hydrochloride has short half
life (3- 7 hrs).To reduce the frequency of administration and to improve patient compliance,
sustained release formulation is desirable. The most commonly method of modulating the
drug release is to include it in a matrix system. Because of their flexibility, hydrophilic
polymer matrix systems are widely used in oral controlled drug delivery to obtain a desirable
drug release profile, cost effectiveness and broad regulatory acceptance.[4, 5] Hence in the
present work an attempt has been made to develop sustained release matrix tablets of
Pioglitazone using hydrophilic and hydrophobic matrix materials like xanthan gum, ethyl
cellulose, eudragit RS 100 etc. Several sustained release formulation have been prepared for
Pioglitazone by different polymers and techniques.
MATERIALS
Pioglitazone hydrochloride was obtained as a gift sample from Ananta Medicare Ltd., Sri
Ganganagar (Raj). Xanthan gum, Eudragit RS 100, Ethyl cellulose, Carbopol 974 etc. All
excipients were of laboratory reagent grade.
METHODS
Drug Identification (λmax) [6]
By absorption spectrum method
Accurately weighed 1mg of Pioglitazone and dissolved in 10ml 0.1N HCl (100μg/ml). 2.5 ml
solution was taken and diluted up to 10 ml (25μg/ml). This solution was scanned between
By infra-red spectra method
Accurately weighed 10mg of Pioglitazone and polymers taken in vials and scanned in FTIR
immediate and after 15 days (kept at 50°C) for drug polymer identification.
Drug Excipient Compatibility Studies by FTIR
Drug and different excipients were taken in 1:1 ratio. The excipients used xanthan gum, ethyl
cellulose, carbopol 974 and Eudragit RS- 100. Drug and excipients were accurately weighed
and mixed and the resulting mixtures were scaled in screw glass vials and kept at 50°C for 15
days . Observations of samples were taken for observing change in their appearance, colour
and odour. These studies performed from faculty of pharmaceutical sciences Jodhpur
National University. The samples of pure drug and physical mixture of polymer and drug
were taken and subjected to FTIR study.[7]
Standard Calibration Curve of Pioglitazone in 0.1N HCl
100mg of Pioglitazone was accurately weighed and dissolved in 100ml 0.1N HCl to give a
solution of 1000 µg/ml concentrations and this served as the first standard stock solution.
From this stock solution 10 ml was taken and diluted to 100 ml using buffer to get a solution
of 100 µg/ml concentrations and this solution served as the second standard stock solution.
From this second stock solution, the solution containing concentration of (i.e.) 0.5 ml
(5µg/ml), 1 ml (10 µg/ml), 2 ml (20 µg/ml), 3 ml (30 µg/ml), 4 ml (40 µg/ml ), 5 ml (50
µg/ml) were prepared. Absorbances of these solutions were measured at the obtained λmax
using UV- Visible Spectrophotometer and standard graph was plotted.[6]
Formulation of Floating Tablet
The required quantities of Pioglitazone, sodium alginate, ethyl cellulose, xanthan gum,
eudragit RS 100, carbopol 974 were thoroughly mixed in a mortar by following geometric
dilution technique. The granulating fluid (a mixture of starch paste) was added and mixed
thoroughly to form dough mass. The mass was passed through mesh No.12 to obtain wet
granules. The wet granules were dried at 60oC for 2 h. The dried granules were passed
through mesh No. 16 to break the aggregates. The lubricants talc (2%) and magnesium
stearate (2%) were passed through mesh No. 60 on to the dry granules and blended in a
closed polythene bag. The tablet granules were compressed into tablets on a 16 station rotary
multi-station tablet punching machine to a hardness of 8-10 Kg/cm2 using 8 mm round and
Evaluation parameters Percentage Practical Yield
Thoroughly dried granules were collected and weighed accurately. The percentage practical
yield was calculated using formula given below,
Percentage Practical Yield = × 100
Determination of drug content
Twenty tablets were weighed and powdered the powder weight equivalent to 100mg of
Pioglitazone was dissolved in 100ml of 0.1N HCl and filtered. 5ml of this was diluted to
50ml with 0.1N HCl and drug contents were estimated with UV-Visible spectrophotometer at
269nm.
Drug content (%)=
In vitro dissolution test
Drug release from the matrix tablets was studied using 8-station dissolution rate test
apparatus (Lab India, Disso 2000) employing a paddle stirrer at 50 rpm and at temperature 37
± 0.5oC. Hydrochloric acid, 0.1 N (900 ml) was used as dissolution fluid. A 5 mL sample of
dissolution fluid was withdrawn at different time intervals through a filter (0.45μm) over a
period of 24h. Each sample withdrawn was replaced with an equal amount of fresh
dissolution medium. The samples withdrawn were assayed spectrophotometrically by
measuring the absorbance at 269 nm.[9]
Pre-compression parameters[10] Micromeritic evaluation
Prior to the compression, the formulation granules were evaluated for their bulk and tapped
density and from these values compressibility index and Hausner‟s ratio were calculated.
While the flow properties of the granules were accessed from the angle of repose.
Bulk density
The bulk density of the formulated granules was evaluated using a bulk density apparatus. It
is the ratio of total mass of powder to the bulk volume of powder. It was measured by
pouring the weighed powder into a graduated measuring cylinder and the volume was noted.
It was expressed in gm/ml and is given by
Tapped density
It is the ratio of total mass of powder to the tapped volume of powder. The tapped volume
was measured by tapping the powder to constant volume. It was expressed in gram/ml and is
given by
Tapped Density (ρt) =
Compressibility Index and Hausner Ratio
The Compressibility index and Hausner‟s ratio are measures of the propensity of a powder to
be compressed and the flow ability of granule. As such, they are measures of the relative
importance of inter-particulate interactions. Carr‟s index and Hausner‟s ratio were calculated
using following formula
Carr‟s Index (I) = × 100
Where, ρt – Tapped density of the powder
ρb – Bulk density of the powder
Hausner‟s ratio =
Table 1: Range of compressibility index and Hausner ratio
Compressibility index (%) Flow character Hausner ratio
≤ 10 Excellent 1.00-1.11
11-15 Good 1.12-1.18
16-20 Fair 1.19-1.25
21-25 Passable 1.26-1.34
26-31 Poor 1.35-1.45
32-37 Very poor 1.46-1.59
>38 Very, very poor >1.60
Angle of repose
The frictional forces in a loose powder can be measured by the angle of repose. This
is the maximum angle possible between the surface of a pile of powder and the horizontal
plane. Sufficient quantities of Pioglitazone granules were passed through a funnel from a
particular height onto a flat surface until it formed a pile, which touched the tip of the funnel.
The height and radius of the pile were measured. The angle of repose was calculated using
Tan θ = h/r
θ = tan-1
(h/r)
[image:7.595.167.427.168.312.2]Where, θ is the angle of repose, h = height of pile, r = radius of the pile base
Table 2: Range of angle of repose
Flow Property Angle of Repose
(Degrees)
Excellent 25-30
Good 31-35
Fair-aid not needed 36-40
Passable-may hang up 41-45
Poor-must agitate,
vibrate 46-55
Very poor 56-65
Very, very poor >66
Post compression parameters [11]
Shape of Tablets
Compressed tablets were examined under the magnifying lens for the shape of the tablets.
Tablet Dimensions
Thickness and diameter of tablets were measured using Vernier Callipers. It was determined
by checking ten tablets from formulation. It was expressed in mm.
Hardness
Hardness indicates the ability of a tablet to withstand mechanical shocks while handling. The
hardness of the tablets was determined using Pfizer hardness tester. It was expressed in
kg/cm2. Ten tablets were selected and hardness of the tablets was measured.
Friability
For tablets with an average weight of 0.65 g or less take a sample of whole tablets
corresponding to about 6.5 g and for tablets with an average weight of more than 0.65 gtake a
sample of 10 whole tablets. Dedust the tablets carefully and weigh accurately the required
number of tablets. Place the tablets in the Roche friabilator. The friabilator was operated at
25 rpm for 4 minutes (100 revolutions) then remove any loose dust from them and weigh
them accurately. A maximum loss of weight not greater than 1.0 per cent was acceptable for
most tablets .The percent friability was calculated using equation. [12]
Where, % F = friability in percentage
W = Initial weight of tablet
W0 = weight of tablets after revolution
Weight variation test
Weigh individually 20 units selected at randomly and calculate the average weight. Not more
than two of the individual weights deviate from the average weight by more than the
[image:8.595.144.452.263.340.2]percentage and none deviates by more than twice that percentage as shown in Table 3.
Table 3: Weight variation ranges as per I.P.
Average weight Percentage deviation
80 mg or less 10
More than 80 mg but less than 250 mg
7.5
250 mg or more 5
In vitro buoyancy studies
The test for buoyancy was usually performed in USP dissolution apparatus containing 900ml
0.1 N HCl at 370 C as the testing medium. The time required for the tablet to rise to the
surface and float was determined as Floating Lag Time (FLT) and the time period up to
which the tablet remained buoyant is determined as Total Floating Time (TFT).
Swelling index
The floating tablets were weighed individually (designated as W0) and placed separately in
glass beaker containing 200 ml of 0.1 N HCl and incubated at 37°C±1°C. At regular
1h time intervals until 24h, the floating tablets were removed from beaker and excess surface
liquid was removed carefully using the tissue paper. The swollen floating tablets were then
re-weighed (Wt), and % swelling index was calculated using the following formula.[12, 13]
Swelling Index (%)=
Dissolution of final formulation
In vitro dissolution study was carried out for optimized formulation of floating tablet in 0.1N
Release kinetics
Release kinetic models, which described the overall release of drug from the dosage forms.
Because qualitative and quantitative changes in a formulation may alter drug release and in
vivo performance, developing tools that facilitate product development by reducing the
necessity of bio-studies is always desirable. In this regard, the use of in vitro drug dissolution
data to predict in vivo bio-performance can be considered as the rational development of
controlled release formulations. Data obtained from the in vitro release studies were fitted to
various model dependent kinetic equations such as zero order, first order, Higuchi model and
Korsmeyer- Peppas model.[14]
Zero-order model
First order model Log C= log C0- Kt/2.303
Higuchi model Q= KH×t1/2
Korsmeyer-Peppas model Q/Q0 = Ktn
Where, K0 to KH were release rate constants, Q/Q0 was fraction of drug released at time t, K
was a constant and n was diffusion constant that indicates general operating release
mechanism. For Fickian (diffusion controlled), n ≤ 0.5; for non- Fickian (anomalous) release,
„n‟ value is in between 0.5 to 1.0; for zero order release, n=1.0; for super case transport II, n
> 1.040. Based on the slope and the R2 values obtained from the above models the
mechanism of drug release was determined.
RESULTS AND DISCUSSIONS PREFORMULATION STUDIES Drug Identification (λmax)
By absorption spectrum method
The accurately weighed quantity of drug was dissolved in sufficient volume of 0.1N HCl and
scan was obtained on UV-VIS spectrophotometer. The wavelength at which maximum
absorbance obtained was considered as maximum wavelength (λmax) i.e 269.4 nm for the
Figure 1: Spectra of Pioglitazone HCl in 0.1 N HCl
By infra-red spectrum method
Drug and polymers identified by infra-red spectrum which was compared with its standard
IR. The IR spectrum given below shown that the peaks obtained in the test spectrum was
similar to that given in standard.
D:\backup\BRUKER\16.2.2015\18.2.2054 18.2.2015.60 Instrument type and / or accessory 18/02/2015
29 24 .2 0 26 08 .2 9 17 37 .7 3 16 80 .9 5 15 06 .4 0 13 10 .6 0 12 32 .7 1 11 46 .3 0 10 32 .3 7 84 3. 82 70 8. 62 65 3. 89 1000 1500 2000 2500 3000 3500 Wavenumber cm-1 96 .0 96 .5 97 .0 97 .5 98 .0 98 .5 99 .0 Tr an sm itt an ce [ % ] Page 1/1
D:\backup\BRUKER\16.2.2015\16.2.2015 16.2.2015.1 Instrument type and / or accessory 16/02/2015 38 76 .4 9 37 44 .7 8 25 82 .4 2 17 40 .2 3 16 79 .6 9 15 10 .5 1 13 12 .5 6 12 33 .5 0 11 46 .2 9 10 32 .6 5 84 2. 35 70 9. 89 1000 1500 2000 2500 3000 3500 Wavenumber cm-1 97 .5 98 .0 98 .5 99 .0 99 .5 T ra ns m itt an ce [ % ] Page 1/1
Figure 3: FT IR spectrum of Pioglitazone (After 15 days )
The Infrared spectra of Pioglitazone hydrochloride were recorded between 600to3500cm-1 on
FTIR. From the FTIR studies at 1605.1 and 1742.23 are the characteristics peaks of
Pioglitazone Hydrochloride. Peaks obtained in spectrum of pure drug (fresh & after 15 days)
were similar to that given in standard.
Drug- excipients compatibility study by FTIR
Drug and excipients were accurately weighed and mixed and the resulting mixtures were
scaled in screw glass vials and kept at a 50°C for 15 days The possible interaction between
the drug and excipients were studied by Infra-red spectroscopy. Below spectrum shows the
peaks of pure drug sample and polymers as compare to standard drug sample i.e. no chemical
reaction occurs between polymers and drug samples.
Table 4 : Drug – Excipient Compatibility Studies
S. No. API and Excipient
Quantity per vial
(mg)
No. of Vials Drug :
Excipient Ratio
Initial
500C After 15 days
1 Pioglitazone + Eudragit RS 100 1:1 10 1 1
2 Pioglitazone + Ethyl cellulose 1:1 10 1 1
D:\backup\BRUKER\16.2.2015\18.2.2052 18.2.2015.57 Instrument type and / or accessory 18/02/2015 26 07 .3 9 17 37 .4 9 16 80 .7 1 15 05 .4 0 13 09 .9 2 12 32 .0 2 11 45 .9 6 10 31 .5 8 84 2. 35 70 8. 52 65 2. 13 1000 1500 2000 2500 3000 3500 Wavenumber cm-1 93 94 95 96 97 98 Tr an sm itt an ce [% ] Page 1/1
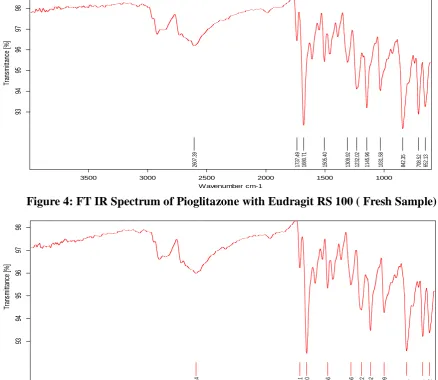
Figure 4: FT IR Spectrum of Pioglitazone with Eudragit RS 100 ( Fresh Sample)
D:\backup\BRUKER\16.2.2015\16.2.2017 16.2.2015.4 Instrument type and / or accessory 16/02/2015
[image:12.595.86.516.76.265.2]26 07 .1 4 17 37 .1 1 16 80 .1 0 15 04 .5 6 13 09 .6 6 12 21 .2 2 11 45 .6 2 10 30 .9 9 84 2. 81 70 7. 24 65 1. 42 1000 1500 2000 2500 3000 3500 Wavenumber cm-1 93 94 95 96 97 98 Tr an sm itt an ce [% ] Page 1/1
Figure 5: FT IR Spectrum of Pioglitazone with Eudragit RS 100 ( After 15 days )
D:\backup\BRUKER\16.2.2015\16.2.2019 16.2.2015.6 Instrument type and / or accessory 16/02/2015
[image:12.595.82.521.80.460.2]28 68 .7 7 16 80 .7 0 10 34 .2 2 84 3. 25 70 7. 72 65 1. 20 1000 1500 2000 2500 3000 3500 Wavenumber cm-1 94 95 96 97 98 Tr an sm itt an ce [% ]
D:\backup\BRUKER\16.2.2015\18.2.2050 18.2.2015.55 Instrument type and / or accessory 18/02/2015 16 82 .1 0 13 08 .9 5 12 35 .0 5 10 35 .0 6 84 2. 28 70 8. 29 64 9. 56 1000 1500 2000 2500 3000 3500 Wavenumber cm-1 95 96 97 98 99 Tr an sm itt an ce [% ] Page 1/1
Figure 7: FT IR Spectrum of Pioglitazone with Ethyl cellulose ( After 15 days )
D:\backup\BRUKER\16.2.2015\18.2.2038 18.2.2015.43 Instrument type and / or accessory 18/02/2015
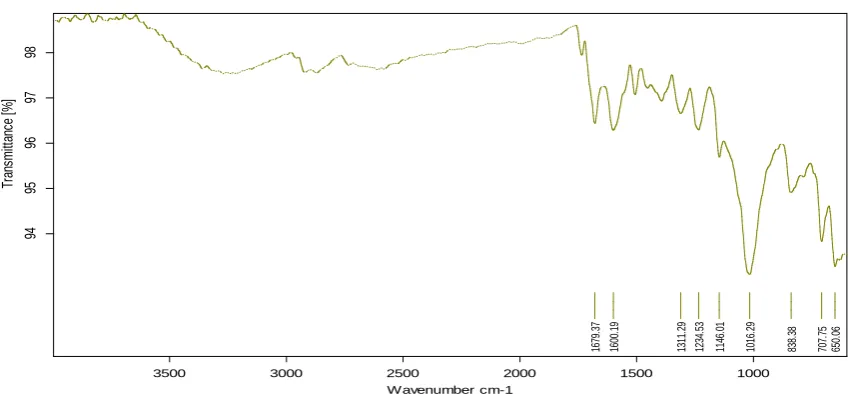
[image:13.595.86.512.307.504.2]16 79 .3 7 16 00 .1 9 13 11 .2 9 12 34 .5 3 11 46 .0 1 10 16 .2 9 83 8. 38 70 7. 75 65 0. 06 1000 1500 2000 2500 3000 3500 Wavenumber cm-1 94 95 96 97 98 Tr an sm itt an ce [% ] Page 1/1
Figure 8: FT IR Spectrum of Pioglitazone with Xanthan Gum ( Fresh Sample )
D:\backup\BRUKER\16.2.2015\18.2.2016 18.2.2015.22 Instrument type and / or accessory 18/02/2015
16 81 .2 6 12 46 .0 7 10 14 .6 9 64 9. 66 1000 1500 2000 2500 3000 3500 Wavenumber cm-1 94 .5 95 .5 96 .5 97 .5 98 .5 Tr an sm itt an ce [% ]
[image:13.595.85.521.528.741.2]Preparation of standard calibration curve: Obtained absorbance was shown in the tables and standard calibration curves of Pioglitazone in different solvents of varying pH were
[image:14.595.115.481.282.568.2]shown in figures 10-11.
Table 5: Standard calibration curve in 0.1N HCl at λmax 269.4nm
Concentration(μg/ml) Absorbance ( nm )
5 0.168
10 0.205
20 0.446
30 0.706
40 0.976
50 1.251
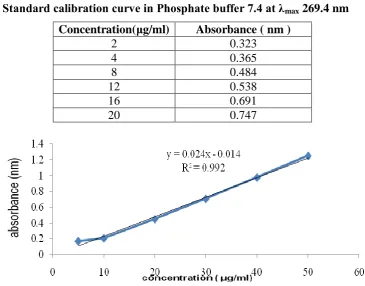
Table 6: Standard calibration curve in Phosphate buffer 7.4 at λmax 269.4 nm
Concentration(μg/ml) Absorbance ( nm )
2 0.323
4 0.365
8 0.484
12 0.538
16 0.691
[image:14.595.145.475.612.743.2]20 0.747
Figure 10: Standard calibration curve in 0.1N HCl at λmax 269.4 nm
Table 7: Composition floating matrix tablets of Pioglitazone
Formulation Batch ( mg ) F1 F2 F3 F4 F5 F6 F7 F8 F9 F10
Pioglitazone 30 30 30 30 30 30 30 30 30 30
Carbopol 974 - 20 20 20 10 - 20 20 - -
Eudragit RS100 - - 20 20 10 30 20 20 25 35
Ethyl cellulose 20 20 20 - 10 30 - - 35 25
Xanthan gum 30 20 - - 20 - 5 10 10 10
Sodium alginate 20 20 - - 10 - - - - -
Sodium bi carbonate - - 20 30 30 20 25 20 10 10
Lactose 44 34 34 44 24 34 44 44 34 34
Magnesium Stearate 3 3 3 3 3 3 3 3 3 3
Talc 3 3 3 3 3 3 3 3 3 3
Table 8: Percentage Practical yield of the prepared granules Formulation
Batch
Initial Weight of Ingredients
(mg)
Theoretical Yield
(mg)
Yield of Formulation
(mg)
% Yield
F1 500 500 356 71.20
F2 500 500 232 46.40
F3 500 500 206 41.20
F4 500 500 404.7 80.94
F5 500 500 370.6 74.12
F6 500 500 412.4 82.50
F7 500 500 352.9 70.58
F8 500 500 417.7 83.54
F9 500 500 445.6 89.12
F10 500 500 415.7 83.14
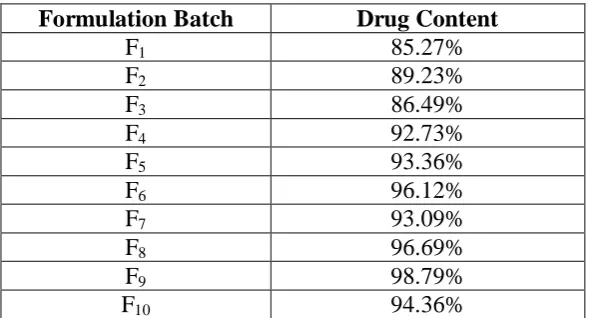
[image:15.595.151.446.525.684.2]Determination of Drug Content
Table 9: Drug content of formulation batches
Formulation Batch Drug Content
F1 85.27%
F2 89.23%
F3 86.49%
F4 92.73%
F5 93.36%
F6 96.12%
F7 93.09%
F8 96.69%
F9 98.79%
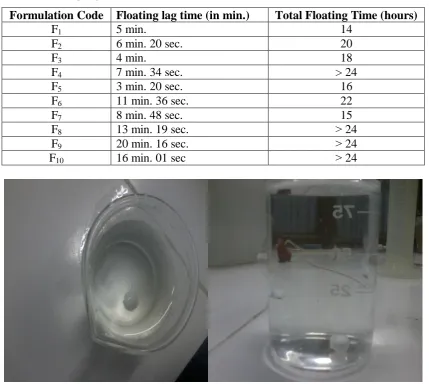
In vitro buoyancy studies
Table 10: Floating lag time of formulation batches
Formulation Code Floating lag time (in min.) Total Floating Time (hours)
F1 5 min. 14
F2 6 min. 20 sec. 20
F3 4 min. 18
F4 7 min. 34 sec. > 24
F5 3 min. 20 sec. 16
F6 11 min. 36 sec. 22
F7 8 min. 48 sec. 15
F8 13 min. 19 sec. ˃ 24
F9 20 min. 16 sec. ˃ 24
F10 16 min. 01 sec ˃ 24
Figure 12: Floating lag time of formulation Precompression Parameters Micromeritic evaluation
Table 11: Flow properties of the powder blend Formulatio
n Batch
Tapped
Density (g/ml)
Bulk Density (g/ml)
Compressibility Index
× 100)
Angle of Repose Hausner’s Ratio
F1-F5 0.397-0.405 0.341-0.352 13.08-14.10±0.47 28°10”- 29°33”±1.48 1.15-1.16±0.010
F6-F10 0.713-0.716 0.622-0.625 12.46-12.84±0.20 26°05”- 27°05”±0.52 1.14–1.15±0.022
Table 12: Post Compressions parameters Formulation
Batch
Diameter* (mm)
Thickness* (mm)
Hardness* (kg/cm2)
% weight Variation* (mg)
Friability* (%)
F1 6.10±0.28 3.83±0.18 7.20±0.25 155.00±3.00 0.78
F2 6.08±0.53 3.65±0.10 8.00±0.45 162.20±2.81 0.83
F4 6.06±0.45 3.73±0.08 7.50±0.24 158.25±3.24 0.65
F5 6.09±0.22 3.83±0.02 6.30±0.11 148.55±4.11 0.58
F6 6.09±0.28 3.46±0.21 8.20±0.30 159.80±2.16 0.86
F7 6.08±0.51 3.74±0.40 7.25±0.15 162.30±3.83 0.61
F8 6.10±0.35 3.79±0.32 6.35±0.22 143.45±4.01 0.42
F9 6.09±0.04 3.81±0.30 8.16±0.40 155.50±3.12 0.64
F10 6.08±0.10 3.86±0.26 8.25±0.35 156.23±2.16 0.80
* Average of three ± Standard Deviation
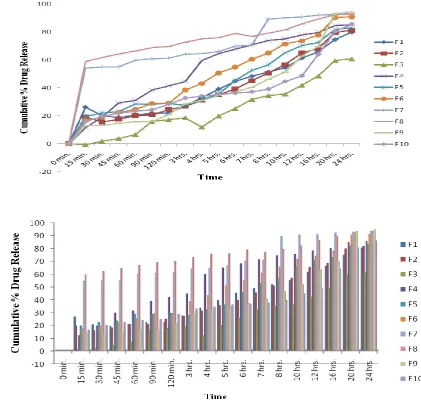
Table 13: In vitro Dissolution Profile of Pioglitazone Floating Tablet in 0.1 N HCl Cumulative % Release at Different Time Intervals
Time F1 F2 F3 F4 F5 F6 F7 F8 F9 F10
0 min. 0 0 0 0 0 0 0 0 0 0
15 min. 26.25 19.25 1.75 11.62 19.50 16.87 54.25 59.00 13.00 15.87
30 min. 20.14 15.60 1.76 19.43 22.23 19.09 55.05 61.70 13.19 19.83
45 min. 19.00 17.69 3.75 29.29 23.10 22.32 54.98 64.29 14.77 21.82
60 min. 20.61 20.29 6.52 31.20 28.48 24.69 59.78 66.52 15.97 23.44
90 min. 21.97 20.65 15.93 38.50 28.38 28.83 60.85 68.76 16.18 24.32
120 min. 22.21 24.51 17.27 41.46 29.04 28.99 61.19 69.63 21.15 28.32
3 hrs. 27.21 26.89 18.62 44.56 27.57 38.39 64.01 72.63 28.64 32.73
4 hrs. 33.23 31.04 11.97 59.56 31.85 43.10 64.49 75.15 30.92 34.28
5 hrs. 39.16 35.08 19.78 64.50 35.64 50.71 66.08 75.80 34.59 35.59
6 hrs. 44.87 39.27 25.14 67.73 45.33 54.86 69.94 78.83 37.15 36.28
7 hrs. 48.36 45.11 31.65 70.85 52.45 60.41 70.56 76.75 40.35 37.23
8 hrs. 51.37 50.60 34.45 73.98 56.49 64.98 89.18 79.03 46.19 39.18
10 hrs. 54.53 56.62 35.64 75.12 65.04 71.46 90.16 81.45 51.32 44.63
12 hrs. 61.32 64.93 41.83 77.90 70.26 73.72 90.63 85.75 62.84 48.62
16 hrs. 65.90 68.15 48.55 79.69 72.52 77.73 91.99 89.20 69.62 64.01
20 hrs. 74.62 79.39 59.44 84.48 81.65 90.27 92.47 92.16 93.04 80.35
24 hrs. 79.89 81.19 60.76 85.18 82.96 90.88 93.08 92.89 94.33 85.65
In vitro dissolution studies of all the formulations of floating tablets were carried out in 0.1N
HCl solution. It was observed that the type of polymer influences the drug release pattern.
These polymers showed sustained release and gastric retention of drug. This showed that
increase the concentration of hydrophobic polymer give sustained release. The plot of
cumulative percentage drug release V/s time (hr.) for all formulations was plotted and
Figure 13: Comparative Dissolution Profile Data of all Formulations
As per as the percentage yield, drug content and dissolution studies was concerned, it
indicated that F9 formulation gives best percentage practical yield, and drug content shows
best dissolution release. By the result observation, it can conclude that F9 formulation should
be a better candidate for floating tablet with best output.
Swelling study
Swelling study was peformed on F9 formulation and the results of swelling index is given in
table while the plot of % swelling index vs. time (hrs) is depicted in Figure 14.
From the results it was concluded that when time increases, the swelling index was also
increased, because weight gain by tablet increased proportionally with rate of hydration. The
optimized formulations F9 show maximum swelling index hence retarded the release of the
[image:18.595.107.495.77.262.2]Table 14: Results of Swelling Index Studies of Pioglitazone Floating Tablets Swelling index (%) at Different Time Intervals
Time (hrs.) 1 2 3 4 5 6 7 8 9 10 11 12
F9 23 34 42 48 58 64 69 76 84 92 96 98
Figure 14: % Swelling Index
Release kinetics
Pioglitazone release from the floating tablets was studied in 0.1N hydrochloric acid.
Pioglitazone release from all the floating tablets prepared was slow and spread over 24 h and
depended on the polymer used and composition of the tablets. Release data were analyzed by
zero order, first order, Higuchi and Peppas equation models as shown in table 15 and fig 15.
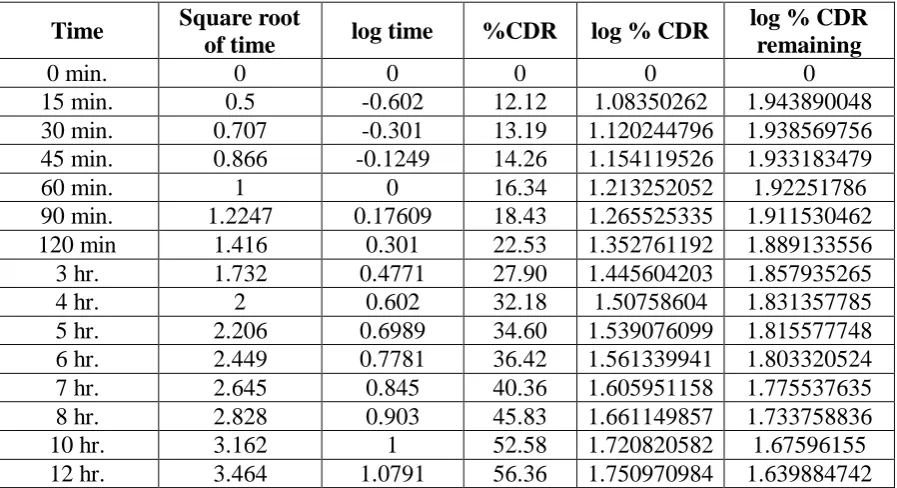
Table 15: Release kinetics of Pioglitazone tablet from formulation F9
Time Square root
of time log time %CDR log % CDR
log % CDR remaining
0 min. 0 0 0 0 0
15 min. 0.5 -0.602 12.12 1.08350262 1.943890048
30 min. 0.707 -0.301 13.19 1.120244796 1.938569756
45 min. 0.866 -0.1249 14.26 1.154119526 1.933183479
60 min. 1 0 16.34 1.213252052 1.92251786
90 min. 1.2247 0.17609 18.43 1.265525335 1.911530462
120 min 1.416 0.301 22.53 1.352761192 1.889133556
3 hr. 1.732 0.4771 27.90 1.445604203 1.857935265
4 hr. 2 0.602 32.18 1.50758604 1.831357785
5 hr. 2.206 0.6989 34.60 1.539076099 1.815577748
6 hr. 2.449 0.7781 36.42 1.561339941 1.803320524
7 hr. 2.645 0.845 40.36 1.605951158 1.775537635
8 hr. 2.828 0.903 45.83 1.661149857 1.733758836
10 hr. 3.162 1 52.58 1.720820582 1.67596155
[image:19.595.74.523.516.760.2]16 hr. 4 1.204 69.66 1.84298347 1.482015576
20 hr. 4.472 1.301 87.91 1.94403828 1.082426301
[image:20.595.73.487.69.322.2]24 hr. 4.898 1.3802 95.26 1.978910577 0.675778342
Figure 15 : Zero order release kinetics of Formulation F9
The presently preferred route of administration for Pioglitazone hydrochloride was oral route.
In the present work efforts have been made to develop floating drug delivery system for
Pioglitazone hydrochloride containing Ethyl cellulose and Eudragit RS 100. The FTIR
spectral analysis showed that there was no appearance or disappearance of any characteristic
peaks of pure drug in the physical mixture of drug and polymer which confirms the absence
of chemical interaction between drug and polymers. The granules were prepared by wet
granulation method and the granules of all formulation were evaluated for angle of repose,
loose bulk density, tapped bulk density, compressibility index and drug content. The result
indicates the granules were having a good free flowing property suitable for tablet
formulation. The tablets of all formulation were subjected to various evaluation parameters
such as thickness, diameter, weight variation, hardness, friability, drug content, in-vitro
buoyancy lag time, total floating time, tablet density, swelling index and in-vitro dissolution
study. The results of all these tests were found to be satisfactory. The results of in vitro drug
release studies show that F9 has better-sustained release than the other formulations. The
formulations showed higher R2 values for zero order plots indicating that drug release
followed zero order kinetics.
CONCLUSION
The present study showed that F9 formulation (Ethyl Cellulose, Xanthan gum and Eudragit
was conclude that F9 formulation should be a better candidate for floating tablet with best
output. It can be conclusively stated that the gastric floating tablet appears to be a promising
system for the delivery of sustained release Pioglitazone for the treatment of diabetes.
REFERENCES
1. Seth M, Goswami DS, Dhaliwal H, Uppal N, Kashyap S and Sharma KD. Design and
characterization of floating tablets of anti – diabetic drug. Int. J. Pharm., 2013; 3(3):
2231-2781.
2. Gedar S, Kataria MK, Bilandi A. An overview on techniques implemented for sustain
release matrix tablet of glipizide. Int J Advances in Pharma., 2014; 93-98.
3. Devi GC, Chowdary KPR. Formulation and in vitro evaluation of floating tablets of
Pioglitazone for oral sustained release employing olibanum gum and HPMC. Int. J Chem
Sci., 2012; 10(1): 281-290.
4. Gad SC. New Dosage Forms, In pharmaceutical manufacturing handbook production and
processes. John Wiley and Sons, Canada., 2008; 348.
5. Wen H and Park K. Oral targeted drug delivery systems, gastric retention devices, In: oral
controlled release formulation design and drug delivery. John Wiley and Sons, Canada.,
2010; 185.
6. USP 31 / NF 26. Asian ed. Volume – 2, Official Monographs. 2008, pg. 1820 – 1822.
7. Rao YS, Ranga E, Sandeep V, Chowdary KPR. Design and evaluation of Pioglitazone hcl
gastroretentive floating matrix tablet. Asian J Pharm Clin Res., 2012; 225-231.
8. John RD. Infrared Spectroscopy, In : John R. Dyer. Editors. Applications of absorption
spectroscopy of organic compounds. Eastern Economy Edition. Prentice – Hall of India.
New Delhi, 22 – 57.
9. Singh SK, Pandit JK and Mishra DN. Formulation and in vitro evaluation of carbopol
934p matrix tablets. J Pharm Res., 2007; 6(1): 20-23.
10.Sahu H, Jain V, Upmanyu N. Formulation and evaluation of effervescent floating tablet
of levofloxacin. Scholars Research Library Der Pharmacia Lettre., 2011; 3(6): 272-279.
11.Jain NK. Gastroretentive drug delivery systems, In: progress in controlled and novel drug
delivery system. CBS Publishers and Distributors, New Delhi , Ist Edn., 2004; 76-97.
12.Rangapriya M, Manigandan V, Natarajan R, Mohankumar K. Formulation and evaluation
of floating tablets of Pioglitazone hydrochloride. Int J Pharma Chem Sci., 2013; 1(3):
13.Goswami DS, Seth M. Formulation and evaluation of Pioglitazone floating tablet. Int J
Res Pharma Biomedical Sci., 2013; 4(2): 628 – 632.
14.Higuchi T. Mechanism of sustained action medication: theoretical analysis of rate of