Joint Probability Prediction Model of Rainfall Triggered
Landslides and Debris Flows
Guilin Liu, Defu Liu*, Tianfu Li, Fengqing Wang, Tao Zou
Disaster Prevention Research Institute, Ocean University of China, Qingdao, China Email: {liuguilin73, *liu, }@ouc.edu.cn, [email protected],
[email protected], [email protected]
Received February 6, 2012; revised March 6, 2012; accepted April 1, 2012
ABSTRACT
The rainfall induced landslides and debris flows are the major disasters in China, as well in Europe, South America, Japan and Australia. This paper proposes a new type of joint probability prediction model—Double Layer Nested Mul-tivariate Compound Extreme Value Distribution (DLNMCEVD) to predict landslides and debris flows triggered by rainfall. The outer layer of DLNMCEVD is predicting the joint probabilities of different combinations for rainfall char-acteristics, air temperature and humidity, which should be considered as external load factors with geological and geo-technical characteristics as resistance factors for reliability analysis of slope stability in the inner layer of model. For the reliability and consequence analysis of rainfall-induced slope failure, the Global Uncertainty Analysis and Global Sen-sitivity Analysis (GUA & GSA) should be taken into account for input-output iterations. Finally, based on the statistics prediction by DLNMCEVD, the geological hazards prevention alarm and regionalization can be provided in this paper.
Keywords: Prediction; Rainfall; Landslides and Debris Flows; DLNMCEVD; GUA & GSA
1. Introduction
The rainfall-induced landslides and debris flows are the major disasters in South American, Europe as well as in China due to the following facts:
The climate of South American, some European coun-ties and China mainly possess the features of hurricane/ typhoon/tropical cyclone, monsoon type and precipita-tion is concentrated in summer, forming stormy rainfall which is the main inducing factor for landslide and debris flow.
The resident in mountainous area mainly distributes along valleys on river terraces, diluvia fans and taluses. The land reclamation often leads to soil erosion and slope failure which threaten the safety of life and property.
Highway and railway in mountainous area are mostly arranged along river valley and gulley and often con-structed by slope cutting, by which the stability condition of natural slopes is disturbed. Slope collapse, landslides and debris flows influence the traffic and threaten the life safety.
The construction of hydro-power stations, nuclear power plants and mines, new resettle regions, slope cut-ting, earth filling and waste piling have destroyed the primary land form; the ground water extraction and waste water infiltration change the original groundwater
condition. All these changes of natural conditions can lead to the change of slope stability.
Due to the above mentioned reasons, the rainfall in-duced landslides and debris flows should be investigated further.
Since the geological environment and the geotechnical characteristics are complicated and changeable, the rain-fall-induced landslide and debris flow possess localized features and complicated types. In the world wide the study of slope stability is concentrated in slope classifi-cation, failure mechanism, failure mode, investigation techniques, method of stability analysis, monitoring tech-niques and treatment measures [1]. During these studies the rainfall is treated as an acting factor to the slope sta-bility. The study on regional features of slope is espe-cially lack, which is more important for development planning, earth use planning and risk management.
The study on rainfall-induced slope failures is more developed in a few countries, such as Italy of Europe, Hong Kong District of PRC, Japan, and Australia [2]. However the study in this countries or districts mainly is performed in combination with the study on certain slope or landslide, so the approaches vary from pure statistics to mechanical analysis. Among these studies only the landslides in Hong Kong are predicted and assessed by using the rainfall as the only indicator. With developed economy and dense population, landslide in Hong Kong
may cause higher risks; therefore, the government pays great attention to the study of landslide. The geological and geo-morphological conditions and the slope failure low have been studied in detail since the territory of Hong Kong is small, and the slope movement and the rainfall are monitored by a net equipped with automatic apparatus. On this basis the correlation of slope failure with rainfall could be established.
In China, the local authorities and the large industrial or construction units pay more attention to the monitor-ing and treatment of certain slopes but the correlation between rainfall and happening of landslide or debris flow is less investigated. In the mainland of China the study on distribution of landslides in some area is well carried out. For example there is a scientific work “Land-slides in Gansu Province”, one of the results of which is the landslide hazard map for East Gansu based on geo-morphology, geology and past landslide activity. This map has been used as basic guideline in land-use plan-ning. However the study on correlation between the land- slide and the rainfall is still very rough. Since the lack of such scientific investigation, errors in development plan-ning or land usage planplan-ning for new constructed or ex-tended area are frequently have made. For example, there are many building damages due to creep, deformation or tension cracks in foundation induced by the first rainfall after the completion of a new resettle point. However if this area was planned for a square or a traffic line, the loss would be less or even be avoided. Another example, there was an accident of powerhouse inundation of a hy-dropower station by a debris flow induced by an extra storm rainfall, since during construction the constructor has piled the solid waste in a gulley just located at the upstream of the power house [3]. For the landslides pre-vention the national design code was established [4]. As the important triggering factor for landslides and debris flow in 16 coastal and inland provinces of China typhoon induced storms and flood and its probability model was studied [5].
Targets of the study are focused on scheme of zoning of a certain region according to the relative homogeneity of the geological and geo-morphological conditions as well as the similarity of the failure mechanism and fail-ure type of slopes and establish a theoretically based and practically applicable joint probability prediction model for rainfall induced landslides and debris flows.
2. Scheme Rainfall-Induced Landslides and
Debris Flows Disasters Zoning
In case that the possibility model is used for prediction and assessment of rainfall-induced landslides and debris flows in a large area, the condition of occurrence of these disasters and the similarity of their mechanism should be taken into consideration. Under different geological and
geo-morphological conditions a rainfall with a same in-tensity, a same prolonged time and a same accumulate precipitation may result in an inducing event or a non- inducing event; in case of an inducing event, disasters of landslide or debris flow with different degrees may take place. In view of these facts we must discuss the mecha-nism of the rainfall-induced disasters and a necessary simplified treatment should be made.
2.1. Slope Type and the Stability Situation
For the study of slope failures induced by rainfall the slopes should be classified at first into rock slopes and earth (including unconsolidated materials) slopes. The reasons are: 1) The people living in mountainous and hilly regions is mainly settled along river valley on the terraces, diluvia fans and taluses, slopes in which can be distinguished as earth slopes; 2) the slopes in the sites of large hydro-power stations, strip mines and along main traffic lines are mainly rock slopes.
1) Earth slopes
The infiltration of rain water changes the physical situation of earth. Under the natural moisture situation earth exists in a solid or hard-plastic state. With the in-creasing of moisture content resulted from infiltration during rainfall earth turns into a soft-plastic state or even to a flow state. So the failure of an earth slope starts from creep to slump or to plastic flow and finally evolves to a mud flow or debris flow.
This failure mode is fit to slopes composed of earth mixed with rock fragments in natural deposits, such as slope wash, talus, residual slides in mountainous and hilly region or man-made fills, as well as to slopes com-posed of homogeneous soil.
2) Rock slope
The infiltration of rain water imparts pore-water pres-sure in rock mass, reduces the shear strength of the dis-continuities in rock mass, especially of the weak struc-ture planes, and induces landslide. The strength reducing is less important in wet area of heavy rainfall since the moisture content of weak structure planes in rock mass are near to saturation; the main role is increased water pressure.
Rock-slides are almost exclusively conditioned by discontinuities dipping outwards. A storm rainfall may induce rock fall in superficial highly weathered rock.
3) Stability situation of slope [6]
land-slide frequently occurs are mostly in deforming or poten-tially unstable situation while rock slopes in an arid area are mostly in long term stable situation.
2.2. Secondary Disasters Induced by Human Activities
Human activities often break the natural balance of slopes, making the slope stability worse, decreasing the thresh-old value of inducing rainfall and increasing the prob-ability of slope failure. Many landslides and debris flows are induced by construction of highway or railway and distribute along traffic lines. The factor of human activity should be considered in zoning of a region as well as in determination of rainfall threshold values. The secondary disasters brought by human activities are mainly as fol-lows:
Engineering cutting steepness slopes or undercuts rock slopes at their toes making the slip surface daylight at slope surface. The examples of these situations are slopes along highway or railway, slopes at rock quarries and open-pit mines.
The waste water infiltrates into ground raising the ground water table and decreasing the stability of slope. This situation is often met in new resettlement area for reservoir immigrant or in newly constructed or extended town.
Damage of natural vegetation leads to soil erosion, for example, along traffic lines or in construction sites.
Piling of waste solid obstructs the discharge channel. For example, the waste rock and earth materials are piled in gulley inducing debris flow in rainy season.
The secondary disasters may be induced by hydraulic works. For example, water leakage from diversion tunnel, rapid drawdown of river or reservoir water level and arti-ficial rainfall induced by flood discharge during rainy season may induce landslides along river banks.
3. The Double Layer Nested Multivariate
Compound Extreme Value Distribution
(DLNMCEVD) and Its Application to
Prediction of Rainfall-Induced
Landslides and Debris Flows
The DLNMCEVD model is developed based on theory of “Multivariate Compound Extreme Value Distribution” (MCEVD), which is compounding a discrete distribution with a multivariate joint probability distribution [9-11].
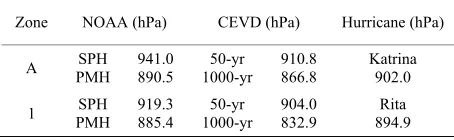
MCEVD was firstly published in USA as form of Compound Extreme Value Distribution (CEVD) for ty-phoon disaster prediction [12] and applied in long term prediction of hurricane Characteristics along US Gulf and Atlantic sea areas in which the hurricane central pressure predicted by CEVD and NOAA (National Oce-anic & Atmospheric Administration) was shown in
Fig-ure 1 [13]. The comparison shows the significant differ-ences between CEVD and NOAA predicted results in Gulf east area A and east Florida area 1 [14], where CEVD predicted 50 yr and 1000 yr return period hurri-cane intensity much more severe than NOAA proposed SPH (Standard Project Hurricane) and PMH (Probable Maximum Hurricane) respectively. 2005 hurricane Katrina and Rita attached mentioned above areas and brought 2000 deaths, 4000 million US$ in New Orleans and 110 offshore platforms collapsed. The SPH was used as de-sign criteria for New Orleans defense structures and lead to historical severest disasters in USA [15-17]. Table 1
shows the comparison between CEVD, NOAA predicted results and hurricane Katrina and Rita data.
[image:3.595.310.537.427.607.2]Many application of MCEVD in engineering design and risk analysis show the scientific and reasonable of its predicted results in China and abroad [18-23]. As men-tioned in “Summary of flood frequency analysis in the United States” [18]: “The combination of the event- based and joint probability approaches promises to yield significantly improved descriptions of the probability laws of extraordinary floods”. MCEVD is the model which follows the development direction of the extraor-dinary floods prediction hoped for by Kirby and Moss. Since 2005 hurricane Katrina and Rita disasters proved accuracy of 1982 predicted hurricane characteristics and after disaster calculated results. It stands to reason that
Figure 1. Comparison between the results of CEVD and NOAA (10, figure 6).
Table 1. Comparison between NOAA and CEVD.
Zone NOAA (hPa) CEVD (hPa) Hurricane (hPa)
A PMHSPH 941.0890.5 1000-yr 50-yr 910.8 866.8 Katrina 902.0
[image:3.595.309.536.664.734.2]MCEVD is a practicable model for prediction of ty-phoon/hurricane/tropical cyclone induced extreme events. Our proposed methods in [10-13] are used as design cri-teria of wind-structure interaction experimentation for mitigating hurricane-induced coastal disasters in US [19].
Dewrivation of PNLTCED
As mentioned above, the frequency of extreme events occurrence (typhoon, hurricane, tropical cyclone or win-ter storm) can be fitted to Poisson distribution
! i i e P i
(1)
where is the mean value of the extreme events
oc-currence per year.
The PNLTCED can be obtained as
1
3
1 2 3
1
1 1 2 2
1 2 1 2 1 3 3 3 3 , ,
exp 1 1
1
F x x x
x x x 2 1 (2)
3
1 2 3
1 2 3
1 2 3
, ,
, , F x x x
f x x x
x x x
(3)
in which j, j, j are the shape, location and scale
parameters of marginal distributions F x
j to xj (j =1, 2, 3), respectively. And dependent parameters α, can be obtained through moment estimation
13 23 12 1 1 2 1 r r r (4)
where i j, is correlation coefficient, i j, i, j = 1, 2, 3. Tri-variate layer structure (α—outside, —inside layer) shows that the correlation between 1
r
x and x2 is stronger than those among x1, x3 and x2, x3.
According to the stochastic simulation method for the
test of CEVDand importance sampling procedure using
design point (ISPUD) [24], a new type of stochastic simulation procedure based on MCEVD—Poisson-IS-PUD (P-ISP) is developed, which can be used in the multivariate joint probability analysis of annual typhoon frequency and other six typhoon characteristics [25]. In the simulation procedure, it is needed to input the mean value of typhoon frequency (λ), marginal distribution of
the six kinds of typhoon characteristics (P-ISP is suitable for different kinds of distributions, such as normal, uni-form, exponential, Rayleigh, Gumbel, Weibull, log-normal, Gamma Frechet distributions, and so on), the mean value and standard deviation of each variable group, matrix correlation coefficients among the variables and the limit state equation. Then the joint probability of different ty-phoon characteristics with some tyty-phoon occurrence frequency can be calculated as the output. Comparing with the basic Monte Carlo method, P-ISP performs more quickly and accurately, so it has been successfully applied to the joint probability analysis of typhoon in-duced extreme sea environmental loads such as wind, wave storm surge, current, rainfall, etc., also to different kinds of offshore engineering structures, risk assessment of fixed platform, coastal defense for Nuclear Power Plant, hydraulic structures of Olympic sailing games and design floods [26-30]. It should be noticed that the solu-tion of the multi-dimensional joint probability problem is a contour surface with some probability value. In appli-cations, aiming at different objectives, for instance, ΔP
reflects typhoon intensity, Rmax reflects area influenced
by typhoon, s reflects intensity of typhoon induced
surges and waves, and t reflects inland areas affected intensity, the dominated factor should be selected respec-tively to calculate the unique solution of the joint pro- bability for different disaster consequences. This proce-dure is taken as the first layer of the double-layer nested multi-objective probability model, which offers the basis for typhoon disaster zoning.
According to the calculated results using 50-yr ob-served typhoon data, the marginal distributions of dif-ferent typhoon characteristics of sea area of China can be described by following distributions: ΔP—Gumbel, Wei-
bull, Log-normal; Rmax—Normal, Log-normal; s—Gum-
bel, Normal; δ—Uniform, Log-normal; θ—Log-noraml;
t—Gumbel, Log-normal, Normal.
The mean value and standard deviation of each ty-phoon characteristic factor, and matrix correlation coef-ficients among the variables should be calculated for different areas.
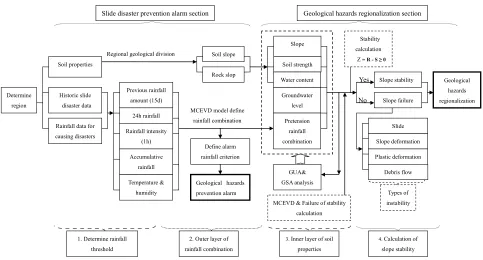
Figure 2. Double layer nested multi-objective probability model of typhoon disaster zoning and prevention criteria.
Regional geological division
MCEVD model define rainfall combination
No Yes
Determine region
Soil properties
Historic slide disaster data
Rainfall data for causing disasters
Temperature & humidity
Soil slope
Rock slop
Soil strength
Water content Previous rainfall
amount (15d)
24h rainfall
Rainfall intensity (1h)
Accumulative rainfall
Groundwater level
Pretension rainfall combination
Slope stability
Slope failure
Types of instability
Geological hazards regionalization Stability
calculation Z = R - S ≥ 0
GUA& GSA analysis
Slope
2. Outer layer of rainfall combination
3. Inner layer of soil properties 1. Determine rainfall
threshold
4. Calculation of slope stability Slope deformation
Plastic deformation Slide
Debris flow
MCEVD & Failure of stability calculation Define alarm
rainfall criterion
Geological hazards prevention alarm
Geological hazards regionalization section Slide disaster prevention alarm section
Figure 3. The float chart of DLNMCEVD application of slide disaster research.
[image:5.595.56.539.458.718.2]ure 2, where λ is frequency per year of rainfall volume over threshold level rainfall volume triggering landslides or debris flow in beginning state.
4. Application GUA & GSA for Prediction of
Rainfall Induced Landslides and Debris
Flow
GUA & GSA are useful to accomplish a number of tasks and provide guidance to improve the quality of environ-mental assessment practices and decision support sys-tems employed in environmental policy, ultimately im-proving their reliability, transparency and credibility. For instance GUA & GSA can help to understand whether the current state of knowledge on input data and related uncertainties is sufficient to enable a decision to be taken. If not, it helps identify which data or parameters require resources to be allocated for knowledge improvement, in
order to achieve the desired level of confidence for the results [31]. For the complex input-output processes for prediction of rainfall induced landslides and debris flows the combination of uncertainty and sensitivity analysis in an iterative procedure of DLNMCEVD should be taken advantage of their complementary aspects:
1) Rainfall uncertainty
Uncertainty through the calculation of threshold level for rainfall induced landslides or debris flow in begin-ning state; Uncertainty of rainfall characteristics; Data sampling uncertainty.
2) Geological and geotechnical parameters uncertain-ties.
3) Uncertainties through the slope stability analysis. 4) Uncertainties related to human activities.
5) Based on the predicted results by DLNMCEVD in an iterative procedure the landslides and debris flow dis-
Regional geological division
MCEVD model define reasonable combination Soil slope
Rock slop
Soil strength
Water content
Potential rainfall combination
GUA& GSA analysis
Slope
Groundwater level Research area
Rainfall factor combination &λ
No Yes
Slope stability Slope failure
Types of instability
Geological hazards regionalization
0
S R
cos sin tan ] ( sin cos ) 0
[W UV ClFW V
Limit state equation Stress factor (S)
Slide
Slope deformation
Debris flow Plastic deformation Resistance factor (R)
(a)
MCEVD calculate causing disaster rainfall combina- tion Soil properties
Historic slide disaster data
Rainfall data for causing disasters
Definite rainfall samples threshold
Geological hazards prevention
alarm
Temperature & humidity Previous rainfall amount
(15 d)
1 day rainfall (24 h)
Rainfall intensity
(1 h) Total rainfall Determine
region
Define alarm rainfall criterion or combina- tion
(b)
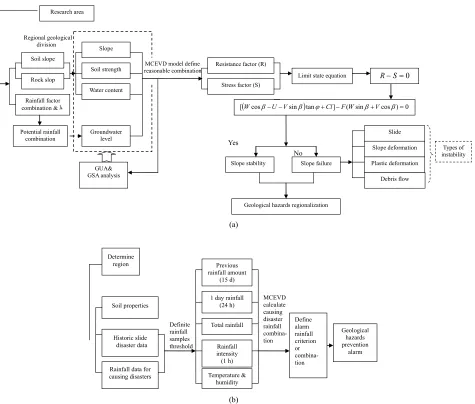
Figure 4. (a) Joint probability assessment of hazards regionalization and types of instability; (b) The float chart of geo-ogical hazards prevention alarm.
[image:6.595.64.539.305.709.2]aster prevention alarm and regionalization can be
pro-aper are focused on scheme of z
REFERENCES
[1] R. Fell, O. Hu . Riemer, “Keynote
Petrucci, “Rainfall as a Lands
ng, “Landslide Hazards in Gans
n Specification for Slope of
Hy-ction of Long
of Rock Slope , 1996, pp.
46-49.
orthwest Water Power, Vol. 3, 2002, pp. 8-11.
in
6. vided.
The float chart of DLNMCEVD application of slide disaster research can be seen in Figure 3.
In Figure 4(a): F-Factor of safety; W-dead weight of the sliding rock mass; β-dip angle of the slide surface; U- water pressure acting on the slide surface; V-water pres-sure acting on the rear edge crack; φ-friction angle of the slide surface; C-cohesion of the slide surface; l-length of the slide surface.
5. Conclusions
The targets of the p oning
of a certain region according to the relative homogeneity of the geological and geo-morphological conditions as well as the similarity of the failure mechanism and fail-ure type of slopes and establish a theoretically based and practically applicable joint probability prediction model for rainfall induced landslides and debris flows. Based on the double layer nested multi-objective probability model, landslides and debris flows disasters prediction, preven-tion, alarm and regionalization system can be proposed. It has important practical value and will bring great eco-nomic and social benefits.
The Multivariate Compound Extreme Value Distribu-tion and DLNMCEVD model widely used in coastal, offshore and hydraulic engineering design and safety assessment. We hope that proposed joint probability pre-diction model of rainfall triggered landslides and debris flows also can be used in disaster prevention and mitiga-tion.
nger, S. Leroueil and W
Lecture—Geotechnical Engineering of the Stability of Natural Slopes, and Cuts and Fills in Soil,” Invited Lec-ture, GeoEng 2000.
[2] M. Polemio and O. lide
Triggering Factor: An Overview of Recent International Research,” Landslides in Research, Theory and Practice, Vol. 3, 2000, p. 1219.
[3] W.-J. Wu and N.-Q. Wa u
Province of China,” Lanzhou University Publishing Com-pany, Lanzhou, 2006.
[4] T. F. Li, et al., “Desig
dropower and Water Conservancy Project,” National De-velopment and Reform Commission, 2007.
[5] B.-T. Xie, D.-F. Liu, et al., “Statistical Predi
Term Characteristics for Typhoon Induced Rainstorm and Inundation in China,” Proceedings of 27th International Conference on Offshore Mechanics and Arctic Engineer- ing, Estoril, 15-20 June 2008, pp. 19-26.
[6] T.-F. Li, et al., “The Failure Mechanism with Bedding Structure,” Hydropower, Vol. 1
[7] T.-F. Li, “Treatment Targets and Design Principle for
Destabilized Bank Slopes of the Three Gorges Reser- voir,” N
[8] T.-F. Li, “On Toppling Failure of Bedded Slope,” North-west Water Power, Vol. 3, 2006, pp. 4-6.
[9] D.-F. Liu, L. Pang and B.-T. Xie, “Typhoon Disaster
China-Prediction, Prevention and Mitigation,” Natural
Hazards, Vol. 49, No. 3, 2009, pp. 421-43
doi:10.1007/s11069-008-9262-2
[10] D.-F. Liu, L. Pang, Y.-K. Wu and B.-T. Xie, “Typhoon
Disaster Zoning and Prevention Criteria—
Layer Nested Multi-Objective Probability Model and Its A Double Application,” Science in China, Series E, Vol. 51, No. 7, 2008, pp. 1038-1048. doi:10.1007/s11431-008-0053-5
[11] D.-F. Liu, H.-D. Shi and L, Pang, “Disaster Prevention
Design Criteria for the Estuarine Cities: New Orleans and Shanghai,” Acta Oceanologica Sinica, Vol. 25, No. 4, 2006,
and Ocean Division, Vol. 106, No. 4, 1980,
, pp. 305-313.
ind Fields, Gulf and East
t Accountability Office GAO-06-244T,
Assessment & Management: Lessons pp. 131-142.
[12] D.-F. Liu and F.-S. Ma, “Prediction of Extreme Wave
Heights and Wind Velocities,” Journal of the Waterway
Port Coastal pp. 469-479.
[13] D.-F. Liu, “Long Term Distributions of Hurricane Char-
acteristics,” Offshore Technology Conference, Houston, 3-6 May 1982
[14] R. W. Schwerdt, F. P. Ho and R. R. Watking,
“Meteoro-logical Criteria for Standard Project Hurricane and Prob-able Maximum Hurricane W
Coast of the United States,” NOAA Technical Report
NWS 23, 1979.
[15] Army Corps of Engineers, “History of Lake Pontchartrain and Vincinity Hurricane Protection Project,” Report of US Governmen
2005, pp. 1-4.
[16] GAO, “Lake Pontchartrain and Vicinity Hurricane
Pro-tection Project,” GAO-05-1050T, Washington DC, 2005. [17] R. Bea, “Reliability
from Hurricane Katrina,” ASME 2007 26th International Conference on Offshore Mechanics and Arctic Engineer- ing, San Diego, 10-15 June 2007, pp. 467-478.
[18] W. H. Kirby and M. E. Moss, “Summary of Flood-Fre-
quency Analysis in the United States,” Journal of Hy-
drology, Vol. 96, No. 1-4, 1987, pp. 5-14.
doi:10.1016/0022-1694(87)90139-9
[19] A. G. Chowdhury and E. Huang, “Novel Full-Scale Wind-
Structure Interaction Experimentation for m ricane-Induced Coastal Disasters,” Far East Jo
itigating Hur- urnal of
. Ocean Research, Vol. 2, 2009, pp. 1-27.
[20] R. M. Langley and A. H. El-Shaarawi, “On the Calcula-
tion of Extreme Wave Height: A Review,” Ocean Engi-
neering, Vol. 13, No. 1, 1986, pp. 93-118
doi:10.1016/0029-8018(86)90006-5
[21] M. G. Naffa, A. M. Fanos and M. A. Elganainy, “Char-
acteristics of Waves off the Mediterran Egypt,” Journal of Coastal Research
[22] S. T. Quek and H. F. Cheong, “Prediction of Extreme 3- Sec Gusts Accounting for Seasonal Effects,” Structure Safety, Vol. 11, No. 2, 1992, pp. 121-129.
doi:10.1016/0167-4730(92)90004-7
P. H. W.
Pren-echanical Engineers, University
onal Offshore and Polar
En-[23] M. K. Ochi, “Stochastic Analysis and Probabilistic Pre-
diction of Random Seas,” Advanced Hydrologic, Vol. 13, 1982, pp. 5-14.
[24] U. Bourgund, W. Ouypornprasert and
ninger, “Advanced Simulation Methods for the Estima- tion of Systems Reliability,” Internal Working Report No.
19, Institution of M of
Innsbruck, Innsbruck, 1986.
[25] L. Pang, D.-F. Liu and Y.-F. Yu, “Improved Stochastic
Simulation Technique and Its Application to the Multi- variate Probability Analysis of Typhoon Disaster,” Pro- ceedings of the 17th Internati
gineering, Portugal, 1-6 January 2007, pp. 1800-1805. [26] D.-F. Liu, L. Pang, G. Fu and H.-D. Shi, “Joint
Probabil-ity Analysis of Hurricane Katrina 2005,” Proceedings of the International Offshore and Polar Engineering Con- ference, San Francisco, Vol. 3, 2006, pp. 74-80.
[27] D.-F. Liu, B,-T. Xie and H.-J. Li, “Study on the Flood
Volume of the Three Gorges Dam Project,” Journal of
Hydrologic Engineering, Vol. 16, No. 1, 2011, pp. 71-80.
doi:10.1061/(ASCE)HE.1943-5584.0000287
[28] D.-F. Liu, H.-J. Li, G.-L. Liu and F.-Q. Wang, “Design
Code Calibration of Offshore, Coastal and Hydraulic En-
f Coastal Defense against Typhoon Attacks
olume, Wave
r the Implementa-
ergy Development Infrastructures, World Science and
Engineering Academy Society (WSEAS) International Journal of Energy and Environment, Vol. 5, No. 6, 2011, pp. 733-747.
[29] D.-F. Liu, G.-L. Liu, H.-J. Li and F.-Q. Wang, “Risk
Assessment o
for Nuclear Power Plant in China,” Proceedings of ICAPP 2011, Nice, 2-6 May 2011, pp. 2484-2492.
[30] D.-F. Liu, Y.-P. Jiang and H.-D. Shi, “Uncertainty Analy- sis of Breakwater Wave Overtopping V
Forces and Structure Stability,” Proceedings of the Inter- national Offshore and Polar Engineering Conference, San Francisco, 28 May-2 June 2006.
[31] S. Tarantola, N. Giglioli, N. J. Jesinghaus and A. Saltelli, “Can Global Sensitivity Analysis Stee
tion of Models for Environmental Assessments and Deci-
sion-Making?” Stochastic Environmental Research and