DOPING DEPENDENCE OF OPTICAL AND ELECTRICAL PROPERTIES OF Fe
METHACRYLIC ACID – ETHYLACRYLATE (MAA:EA) COPOLYMER ELECTROLYTES
*Madhava Kumar, Y., Ramu
Department of Physics, Vikrama
ARTICLE INFO ABSTRACT
Methacrylic Acid concentration of Fe
was measured with impedance analyzer in the frequency range of 1 Hz to 1 MHz and in the temperature range of 303
the increase in the salt concent
indicates a variation in both intensity and optical energy gap with different concentration of doping level. Both values of direct and indirect energy gaps are calculated and discussed.
shows a defect formation which increases with increasing Fe
FeCl3, as a dopant, is a good choice to improve the electrical properties of MAA:EA copolymer electrolytes.
Copyright©2016, Madhava Kumar et al. This is an open access article distributed under the Creative Commons Att use, distribution, and reproduction in any medium, provided the original work is properly cited.
INTRODUCTION
Considerable attention has been focused recently on the synthesis of conducting organometallic polymers. One of the most interesting areas of metal-containing polymers is that of electrically conducting organometallic polymers. The most promising conducting polymer should demonstrate good solution or melt processability, in addition to environmental stability, mechanical integrity and controllab
Because the ability to tailor the electrical properties of these materials is one of the most attractive features and coupled with improved stability and processability relative to the original conducting polymer systems. Applications of
include Remotely Readable Indicators, Biosensors, Storage Battery and Fuel Cell Electrodes, Capacitors, Electrochromics, Chemical and Biochemical Sensors, Ion Exchange release devices and Neutron detection. Methacrylic Acid
Acrylate (MAA:EA) copolymer has drawn special attention amongst the copolymers because of its good environmental stability, easy process and transparency. MAA:EA copolymer is a potential material having good charge capacity and dopant dependent electrical and optical properties. Bajaj
*Corresponding author: Madhava Kumar, Y.
Department of Physics, Vikrama Simhapuri University PG Centre, Kavali 524201, India.
ISSN: 0975-833X
Article History:
Received 17th May, 2016
Received in revised form 18th June, 2016
Accepted 05th July, 2016
Published online 31st July,2016
Key words:
Copolymer electrolyte, Electrical conductivity and Optical energy band gap.
Citation: Madhava Kumar, Y., Ramu, Ch., Bhagyasree, K., Hussain Basha, Md and Gopal, N. O. Fe3+ doped Methacrylic acid – Ethylacrylate (MAA:EA) copolymer electrolytes
RESEARCH ARTICLE
DOPING DEPENDENCE OF OPTICAL AND ELECTRICAL PROPERTIES OF Fe
ETHYLACRYLATE (MAA:EA) COPOLYMER ELECTROLYTES
Y., Ramu, Ch., Bhagyasree, K., Hussain Basha, Md and
Department of Physics, Vikrama Simhapuri University PG Centre, Kavali 524201, India
ABSTRACT
Methacrylic Acid – Ethylacrylate (MAA:EA) copolymer electrolytes concentration of Fe3+ were prepared using the casting technique.
was measured with impedance analyzer in the frequency range of 1 Hz to 1 MHz and in the temperature range of 303–348 K. It was observed that the magnitude of conductivity increased with the increase in the salt concentration as well as the temperature. UV
indicates a variation in both intensity and optical energy gap with different concentration of doping level. Both values of direct and indirect energy gaps are calculated and discussed.
shows a defect formation which increases with increasing Fe3+
, as a dopant, is a good choice to improve the electrical properties of MAA:EA copolymer electrolytes.
is an open access article distributed under the Creative Commons Attribution License, which use, distribution, and reproduction in any medium, provided the original work is properly cited.
Considerable attention has been focused recently on the synthesis of conducting organometallic polymers. One of the containing polymers is that of electrically conducting organometallic polymers. The most promising conducting polymer should demonstrate good solution or melt processability, in addition to environmental stability, mechanical integrity and controllable conductivities. Because the ability to tailor the electrical properties of these materials is one of the most attractive features and coupled with improved stability and processability relative to the original conducting polymer systems. Applications of these polymers include Remotely Readable Indicators, Biosensors, Storage Battery and Fuel Cell Electrodes, Capacitors, Electrochromics, Chemical and Biochemical Sensors, Ion Exchange release Methacrylic Acid- Ethyl (MAA:EA) copolymer has drawn special attention amongst the copolymers because of its good environmental stability, easy process and transparency. MAA:EA copolymer is a potential material having good charge capacity and dopant cal properties. Bajaj et al. (1994)
Department of Physics, Vikrama Simhapuri University PG Centre,
studied the thermal behavior of MAA:EA copolymers. Wang
et al. (2003) studied the interaction between MAA:EA
copolymer and bromide dopant. The method of choice for producing conducting organometallic polymers involves complexing transition metals with conjugated bridging ligands. The ability to alter the oxidation state of
the charge density along the polymer backbone, provides an alternative route to charge carrier creation as opposed to redox doping. Its electrical conductivity depends on the thermally generated carriers and the addition of suitable
(Mehendru et al., 1997; Shinka
as an attractive candidate for this doping process because of its interesting physical properties. It should be noted that formation of stable metal particles inside the polymer syste also of interest for potential application such as 3D storage of optical data, shielding of electromagnetic radiation flexible elements for resistive heating (
2008), laser systems, optical lenses and integrated wave gu Based on the importance and relevance of the MAA:EA copolymer as a suitable matrix for transition metal ion such as Fe3+ ions, the combined optical, and electrical conductivity investigations of MAA:EA films doped with different concentrations of Fe3+ ions represent an important task of this work. Moreover, so far no work was reported on Fe doped MAA:EA films. Hence, the authors have aim at the present investigation.
International Journal of Current Research
Vol. 8, Issue, 07, pp.34924-34929, July, 2016
Madhava Kumar, Y., Ramu, Ch., Bhagyasree, K., Hussain Basha, Md and Gopal, N. O. 2016. “Doping dependence of optical and electrical properties of Ethylacrylate (MAA:EA) copolymer electrolytes”, International Journal of Current Research, 8, (0
DOPING DEPENDENCE OF OPTICAL AND ELECTRICAL PROPERTIES OF Fe
3+DOPED
ETHYLACRYLATE (MAA:EA) COPOLYMER ELECTROLYTES
., Hussain Basha, Md and Gopal, N. O.
, Kavali 524201, India
Ethylacrylate (MAA:EA) copolymer electrolytes doped with different Electrical conductivity of the films was measured with impedance analyzer in the frequency range of 1 Hz to 1 MHz and in the 348 K. It was observed that the magnitude of conductivity increased with . UV-Vis. optical absorption spectrum indicates a variation in both intensity and optical energy gap with different concentration of doping level. Both values of direct and indirect energy gaps are calculated and discussed. Obtained data 3+ concentration. This suggests that
, as a dopant, is a good choice to improve the electrical properties of MAA:EA copolymer
ribution License, which permits unrestricted
studied the thermal behavior of MAA:EA copolymers. Wang studied the interaction between MAA:EA copolymer and bromide dopant. The method of choice for producing conducting organometallic polymers involves complexing transition metals with conjugated bridging ligands. The ability to alter the oxidation state of the metal ion, and thus the charge density along the polymer backbone, provides an alternative route to charge carrier creation as opposed to redox doping. Its electrical conductivity depends on the thermally generated carriers and the addition of suitable dopants Shinka et al., 1989). Fe3+ was selected as an attractive candidate for this doping process because of its interesting physical properties. It should be noted that formation of stable metal particles inside the polymer system is also of interest for potential application such as 3D storage of optical data, shielding of electromagnetic radiation flexible (Tauihri et al., 2002; Abdelaziz, , laser systems, optical lenses and integrated wave guides. Based on the importance and relevance of the MAA:EA copolymer as a suitable matrix for transition metal ion such as ions, the combined optical, and electrical conductivity investigations of MAA:EA films doped with different ions represent an important task of this work. Moreover, so far no work was reported on Fe3+ ions doped MAA:EA films. Hence, the authors have aim at the OF CURRENT RESEARCH
MATERIALS AND METHODS
Methacrylic acid - ethyl acrylate (1:1) dispersion 30 percent copolymer with molecular weight 2,50,000 was purchased from Merck Millipore India Ltd. MAA:EA copolymer films (14μm thickness) doped with Fe3+ in various concentrations were prepared at room temperature by solution casting method. The desired concentrations of FeCl3 solution (1, 2, 3, 4 and 5 mol%) were prepared by using distilled water. 5ml of MAA:EA copolymer was dissolved in distilled water separately. Different amounts of (1, 2, 3, 4 and 5 mol%) Fe3+ ions were added into the copolymer solution. The solution was magnetically stirred for 10-12 hours to get homogeneous mixture and then cast onto plastic dishes. The film was slowly evaporated at room temperature to obtain free standing copolymer film at the bottom of the dishes. UV-Vis absorption spectra of the prepared samples were recorded in the range 200-800 nm at room temperature using JASCO UV-VIS-NIR spectrophotometer (model- V.700). From these data the optical constants such as band edge, optical band gap (both direct and indirect) were determined. The impedance measurements were performed using a computer controlled phase sensitive multimeter (PSM 1700) in the frequency range of 1 Hz–1 MHz and in the temperature range of 303–348 K. The samples were vacuum dried at 313 K for 1 h and the measurements were done by sandwiching the electrolyte film between two aluminum electrodes in a temperature controlled INDFURR furnace.
RESULTS AND DISCUSSION
Impedance analysis
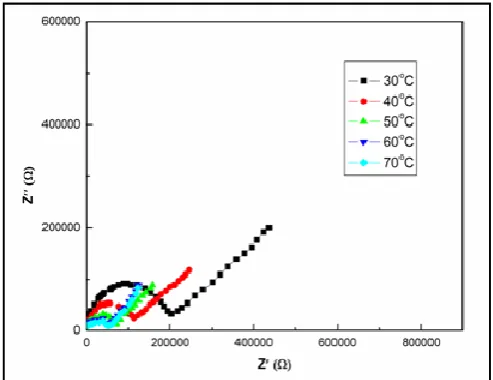
AC impedance spectroscopy has become a powerful tool for the investigation of ionic conductivity of solid electrolyte films. Fig. 3 shows the typical impedance plot of Fe3+ doped MAA:EA copolymer (5 mol%) at different temperatures in the frequency range of 1Hz–1MHz below75 0C. It has been found that the idealized impedance plane plots of Zll as a function of Zl, i.e. Cole–Cole plots of the films (Zl and Zll denote the real and imaginary parts of the complex impedance Z*), contain a semi circular arc and inclined spike, which together are characteristic behavior of ionically conducting solids with blocking electrodes (Prabu et al., 2010). The semicircle is due to the parallel combination of bulk resistance (due to the migration of ions) and bulk capacitance (due to the immobile polymer chains). Hence the frequency response of the given sample could be represented by an equivalent circuit consisting of a parallel combination of the circuit elements R (resistance) and C (capacitance).The presence of the depressed semi circle reveals the non-Debye nature of the sample (Lanfredi and Saia, 2002) due to the potential well for each site, through which the ion transport takes place, not being equal. The inclined spike represents formation of double layer capacitance at the electrode–electrolyte interface due to the migration of ions at low frequency. The capacitance values are in the range of pF, which represents the bulk response of the sample (Bohnke
et al., 1999). The electrode double layer at each interface
possesses increasing impedance against ion transfer with decrease in frequency, which, in the Nyquist plot of impedance spectra, was represented by an inclined spike (Li and Hsu,
1984). Furthermore the inclination of the spike at an angle less than 90 0C to the real axis is due to the roughness of the electrode–electrolyte interface (Ramya et al., 2008).
The ionic conductivity of pure and Fe3+ MAA:EA copolymer electrolytes is calculated from the relation
A R I
b
[image:2.595.310.557.223.413.2]where I, is the thickness of the film, A, the area of the film and Rb, the bulk resistance of the film material which is obtained from the intercept on the real axis at the high frequency end of the Nyquist plot of complex impedance (Macdonald, 1987).
Fig.1. Cole–Cole plots for (MAA:EA/Fe3+) (5mol%)) copolymer electrolyte at different temperatures
Composition dependence of conductivity
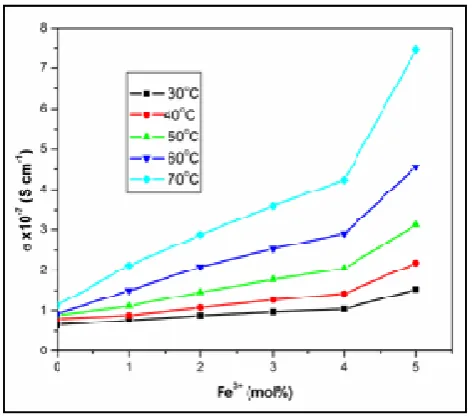
free Fe3+ ions transfer into the electrolyte. The increment in conductivity with dopant concentration due to the rise in the number of charge carriers is shown in Fig. 4. The conductivity data of pure and Fe3+ doped MAA:EA copolymer at room temperature are presented in Table 1.
Fig.2. Conductivity vs. dopant concentration plots of (MAA:EA/Fe3+) copolymer electrolyte system at different
temperatures
Temperature dependence of conductivity
The bulk conductivity has been calculated from the impedance plot, and logarithms of conductivity were plotted against the inverse of temperature to observe the temperature dependence of conductivity. Fig.5 shows the linear dependence of log σ on inverse temperature (1000/T) for pure and Fe3+ doped MAA:EA copolymer films. The linear variation in log σ vs. 1000/T plot suggests an Arrhenius-type thermally activated process represented by
)
/
exp(
0
E
aKT
dc
where σo is the pre-exponential factor, Ea the activation energy, k the Boltzmann constant and T the absolute temperature. The magnitude of ionic conductivity was found to increase with increase in temperature in all compositions of the polymer blend electrolyte system including pure film. This may be explained on the basis of an increase in either ionic mobility or the concentration of carrier ions (MacCallum and Vincent, 1987). In polymer electrolytes, change of conductivity with temperature is due to segmental motion, which results in an increase in the free volume of the system (Druger et al., 1985). When temperature is increased, the vibrational energy of a segment is sufficient to push against the hydrostatic pressure imposed by its neighbouring atoms and create a small amount of space surrounding its own volume in which vibrational motion can occur (MacCallum and Vincent, 1987). Therefore, the free volume around the polymer chain causes the mobility of ions and polymer segments and, hence, the conductivity increases. The increase of temperature causes the increase in conductivity due to the increased free volume and their
respective ionic and segmental mobilities. This increase in free
volume would facilitate the motion of ionic charges (Park
[image:3.595.46.283.121.330.2]et al., 2003).
Fig.3. Inverse temperature dependent conductivity of pure MAA:EA and Fe3+ doped copolymer electrolyte films of different
concentration
Activation energies
The activation energies were calculated from the slope of the Arrhenius plots and the values are shown in Table 1. The activation energy is a combination of energy of charge carrier creation (defect formation) and the energy of ion migration that can be evaluated by linear fitting of the log σ vs 1000/T plots (Famiza et al., 2006; Reddy et al., 1999). Therefore, it can be suggested that the activation energy is due to the energy that is required to provide a conductive condition for the migration of ions. From the table it was found that the activation energy values decreased with increasing concentration of Fe3+. This may be due to the fact that the addition of small amounts of dopant forms charge transfer complexes in the host lattice (Rama Mohan et al., 2011). These charge transfer complexes increase the electrical conductivity by providing additional charges in the lattice, resulting in a decrease of activation energy.
Table 1. Conductivity and activation energies of undoped and Fe3+ doped MAA:EA copolymer electrolyte films.
Concentration
Mol% Fe3+:MAA:EA Conductivity at 303 K (S/cm) Activation energy E a (eV)
Pure 8.25 x 10⁻⁹ 0.53
1 3.26 x 10⁻⁸ 0.50
2 5.78 x 10⁻⁸ 0.48
3 6.25 x 10⁻⁸ 0.46
4 0.22 x 10⁻⁷ 0.43
5 1.14 x 10⁻⁷ 0.41
UV-Vis Absorption studies
[image:3.595.310.555.610.690.2]interaction between electromagnetism and the sample, which can be interpreted through variations in the absorption spectra. An absorption spectrum is a fingerprint of a molecule or polymer material. UV-Vis absorption is a commonly used analytical tool for studying the interactions between electrons and radiation. The absorptions of copolymer electrolytes for pure and Fe3+ doped are shown in the Fig. 1. The maximum absorption for all the samples is in the range of 200–800 nm. According to the graph, The doped of Fe3+ in MAA:EA introduces a new absorption peak at 284 nm, in addition to the peak at 221 nm characteristic of pure MAA: EA were observed, these new peak may be attributed to the formation of charge transfer complex (Uma Devi et al., 2002). The amount of absorbance at each peak position increasing with dopant concentration, this drop in absorption edge is the result of the
decreased band gap which improves the sample
semiconducting behaviour.
The absorption coefficient α is directly determined from the spectra by
α = 2.303 (2)
Where A is the absorbance and d is the thickness of the film. The variation in the absorption coefficient with incident photon energy for undoped as well as doped MAA: EA copolymer (Fig. 2) shows that the absorption edge for undoped MAA:EA lies at 4.97 eV while for doped films the values are found to decrease from 4.88 to 4.55 eV (Table. 2).
When a direct band gap exists, the absorption coefficient has the following dependence on the energy of the incident photon (Davis and Shalliday, 1960; Thutupalli and Tomilin, 1976).
21
g
E
h
c
h
(3)where Eg is the band gap, c is a constant, ν is the frequency of light and h is the Planck’s constant.
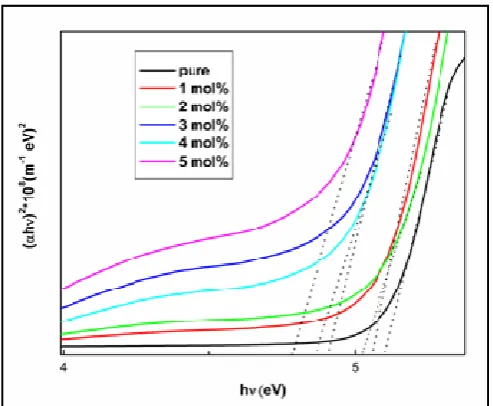
A plot of (αhν)2 vs hν (photon energy) as shown in Fig 3 is observed to be linear. The intercept on the energy axis by extrapolating the linear portion of the curve to zero absorption value may be interpreted as the value of the band gap. For pure (MAA:EA) film, the direct band gap lies at 5.09 eV while for doped films the values vary from 5.05 to 4.79 eV which are given in Table 2. For indirect transition which requires phonon assistance, absorption coefficient has the following dependence on the photon energy (Davis and Shalliday, 1960; Thutupalli and Tomilin, 1976).
2
2p g p
g
E
B
h
E
E
Eh
h
A
h
(4)
Where Ep is the energy of phonon associated with transition and A, B are constants depending on the band structure.
The indirect band gaps were obtained from the plots of (αhν)1/2 vs hν (Fig. 4). For pure (MAA:EA) copolymer film the indirect band gap lies at 4.85 eV, while for doped films the values vary from 4.73 to 4.19 eV (Table 1). From Table 2, it is clear that
[image:4.595.305.561.187.481.2]the band edge, direct band gap and indirect band gap values showed decrease with the increase of dopants. The decrease in optical band gap on doping may be explained on the basis of the fact that incorporation of small amount of dopants form charge transfer complexes in the host lattice. The band edge, direct band gap and indirect band gap values shifted to lower energies on doping with Fe3+ ions, this is due to inter band transitions (Reddeppa et al., 2013).
Table 2. Absorption edge optical band gap values of pure and Fe3+ ionsdoped (MAA: EA)copolymer electrolytes
Concentration Mol% Fe3+: MAA:EA
Absorption edge (eV)
Direct band gap energy(eV)
Indirect band gap energy(eV)
Pure MAA: EA 4.97 5.09 4.85
1 4..88 5.05 4.73
2 4.80 5.02 4.67
3 4.71 4.90 4.47
4 4.65 4.86 4.33
[image:4.595.309.557.525.726.2]5 4.55 4.79 4.19
Fig. 4. Ultra Violet absorption spectra for MAA: EA copolymer electrolytes containing Fe3+ (a) pure (b) 1 mol% (c) 2 mol% (d)
3mol%. (e) 4 mol% (f) 5 mol%
Fig. 6. (αhν)2 vs hν plots of pure and Fe3+ doped MAA:EA copolymer electrolytes
Fig. 7. (αhν)1/2 vs hν plots of pure and Fe3+ doped MAA:EA copolymer electrolytes
Conclusion
Polymer electrolytes based on MAA:EA copolymer with FeCl3 as the dopant at different concentrations were prepared using solution casting technique. The impedance study showed that the addition of Fe3+ ions to the polymer electrolyte enhanced the ionic conductivity. The increase in the conductivity with an increase in concentration of Fe3+ was attributed to an increase in the amorphosity. Optical absorption edge and optical band gaps (both direct and indirect) showed a decreasing trend with increased concentration of the dopant. These data suggest that the present electrolyte system is a worthy candidate for electrochemical device applications.
REFERENCES
Abdelaziz, M. 2008. ‘Electron spin resonance and optical studies of poly(methylmethacrylate) doped with CuCl2’, J.
Appl. Polym. Sci., 108 1013.
Bajaj, P. 1994. Meenakshi Goyal and R. B. Chavan, ‘Thermal behavior of methacrylic acid–ethyl acrylate copolymers’, J.
Appl. Poly. Science, 51 423.
Bohnke O., S. Ronchetti, D. Mazza, 1999. ‘Conductivity measurements on nasicon and nasicon-modified materials’,
Solid State Ion. 122, 127.
Davis P.W. and T. S. Shalliday, 1960. ‘Some Optical Properties of Cadmium Telluride’, Phys. Rev. 118 1020. Druger S.D., A. Nitzan and M.A. Ratner,’ 1985. Generalized
hopping model for frequency-dependent transport in a dynamically disordered medium, with applications to polymer solid electrolytes’, Phys. Review B, 31 3939. Famiza L., A. Madzlan, K. Nasir, A.M.M. Ali and Z.Y. Muhd,
2006.‘The role and impact of rubber in poly(methyl methacrylate)/lithium triflate electrolyte’, J. Power
Sources, 1591401.
Lanfredi S., P.S. Saia, R. Lebullenger, 2002. ’Electric conductivity and relaxation in fluoride, fluorophosphate and phosphate glasses: analysis by impedance spectroscopy
Solid State Ion. 146, 329.
Li X, S.L. Hsu,1984. ‘An analysis of the crystallization
behavior of poly (ethylene oxide)/poly(methyl
methacrylate) blends by spectroscopic and calorimetric techniques’, J. Polym. Sci. Polym. Phys.: Ed. 22, 1331. MacCallum J.A. and C.A. Vincent, 1987. in: “Polymer
Electrolyte Reviews-1”, Elsevier, London.
Macdonald J.R. 1987. in: “Impedance Spectroscopy”, John Wiley & Sons, New York, p.23
Mehendru P.C., K. Pathak, K. Jain, P. Mehendru, 1997. ‘Ransport of iodine in poly (ethyleneterephthalate) Phys.
Stat. Sol. 42, 403.
Noor S.A.M., A. Ahmad, I.A. Talib, M.Y.A. Rahman, 2010. ‘Morphology, chemical interaction, and conductivity
of a PEO-ENR50 based on solid polymer
electrolyte’, Ionics 16 161.
Park C.H., D.W. Kim, J. Prakash, Y.K. Sun, 2003. ’Electrochemical stability and conductivity enhancement of
composite polymer electrolytes’, Solid State Ion. 159 111. Prabu M., S. Selvasekarapandian, A.R. Kulkarni, G. Hiran
Kumar, A. Sakunthala, ‘Ionic conductivity studies on LiSmO2 by impedance spectroscopy’, Ionics 16(4) 317 (2010).
Rama Mohan K., V.B.S. Achari, V.V.R.N. Rao and A.K. Sharma, 2011. ‘Electrical and optical properties of (PEMA/PVC) polymer blend electrolyte doped with NaClO4’, Polymer Testing, 30, 881.
Ramya C.S., S. Selvasekarapandian, G. Hiran Kumar, T. Savitha, P.C. Angelo, 2008. ‘Investigation on dielectric relaxations of PVP–NH4SCN polymer electrolyte’, J.
Non-Cryst. solids 354 1494.
Reddeppa N., A.K. Sharma, V.V.R. Narasimha Rao, Wen Chen, 2013. ’Preparation and characterization of pure and KBr doped polymer blend (PVC/PEO) electrolyte thin films’, Microelectronic Engineering, 112 57.
Reddy M.J., T. Sreekanth and U.V.S. Rao, 1999. ’ Study of the plasticizer effect on a (PEO+NaYF4) polymer electrolyte and its use in an electrochemical cell’, Solid State Ionics, 126 55.
[image:5.595.40.287.52.255.2] [image:5.595.36.290.56.501.2]Tauihri S., J. C. Bernede, P. Molinie, D. Legoff, 2002. ‘Modification of poly(N-vinyl-carbazole) thin films by bromine doping’, Polymer 43 3123.
Thutupalli G.M. and S.G. Tomilin, 1976. ‘The optical properties of thin films of cadmium and zinc selenides and tellurides’ J. Phys. D. App. Phys., 9 1639.
Uma Devi C., A.K. Sharma, and V.V.R.N. Rao, 2002. ‘Electrical and optical properties of pure and silver nitrate-doped polyvinyl alcohol films’, Materials Letters, 56, 167. Wang C., K. C. Tam, R. D. Jenkins and C. B. Tan, 2003.
‘Interactions between Methacrylic Acid/Ethyl Acrylate Copolymers and Dodecyltrimethylammonium Bromide’, J.
Phys. Chem. B, 107 4667.