doi:10.4236/jsip.2011.24045 Published Online November 2011 (http://www.SciRP.org/journal/jsip)
Fast Encoding-Decoding of 3D Hyperspectral
Images Using a Non-Supervised Multimodal
Compression Scheme
Mourad Lahdir1, Amine Nait-ali2*, Soltane Ameur1
1
Laboratoire d’Analyse et de Modélisation des Phénomènes Aléatoires (LAMPA), Département d’Electronique, Faculté Génie Electrique et Informatique, Université Mouloud Mammeri, Tizi-Ouzou, Algérie; 2Laboratoire Images, Signaux et Systèmes Intelligents (LiSSi), Université Paris-Est Créteil, Créteil, France.
Email: *[email protected], [email protected], [email protected]
Received June 8th, 2011; revised August 14th, 2011; accepted August 26th, 2011.
ABSTRACT
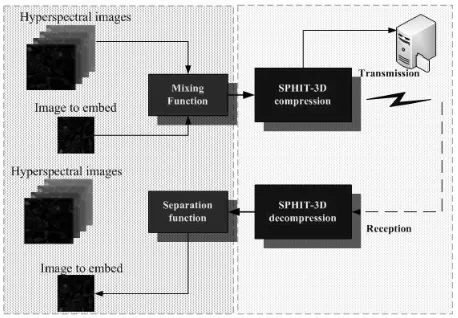
We introduce in this paper an extension of the Multimodal Compression technique (MC) for the purpose of coding hy-perspectral image sequences. The main idea requires few steps, namely: 1) reducing the size of the sequence by insert-ing smooth images containinsert-ing less information into the remaininsert-ing images of the same sequence,2) then coding the new compacted sequence using 3D-SPIHT algorithm. In this new scheme, called MC-3D-SPIHT, the insertion is achieved only in the contour of each image, according to a non-supervised way, so that one can preserve the Region of Interest (ROI) quality. For this purpose, a mixing function is employed. After the decoding process, inserted images are ex-tracted by a separation function and the original sequence is reconstructed. By considering data from AVIRIS database, we will show how one decrease significantly the computing time for both coding and decoding.
Keywords: Multimodal Compression, Hyperspectral Images,3D-SPIHT
1. Introduction
Hyperspectral images provide finer spectral information then traditional multispectral images. However the volume of generated data is dramatically huge. Consequently, data compression becomes essential for economical distribution when spaceborn hyperspectral data are regularly available. The term hyperspectral is generally used for spectral data containing hundreds of samples of spectra. The hyperspec- tral images thus present specific characteristics that require to be exploited by some specific compression algorithms [1]. Since hyperspectral sequence images consider a set of images, they can be regarded somehow as volumetric data requiring specific techniques of compression.
Based on the techniques available in the literature, var- ious algorithms and standards have been developed to deal with this type of data. For instance, wavelet transform has been efficiently used for 2D image coding [2,3]. Besides, it is considered as the kernel of the standard JPEG2000 [4]. Extended to volumetric images, JPEG2000 standard has been widely applied to 3D hyperspectral images encoding [5]. Afterwards, the 3D wavelet transformation has been efficiently employed for various types of data through [6],
[7] and [8]. Recently, a 3D anisotropic wavelet decompos- ition which includes an adaptation of the zerotree structure [1] highlighted the potential of using such scheme to com- press 3D hyperspectral images.
In this paper, we propose a new approach to pre-pro- cess 3D hyperspectral images before using any compres-sion scheme. The idea consists in compacting (i.e. redu- cing the number of images of a sequence to compress) any volume/sequence in a context of Multimodal Com-pression based on the concept introduced in [9] related to image-signal merging and video-signal merging of bio-medical data. The scheme presented in this work is con-sidered as a variant and an extension since it deals with 3D images.
Generally speaking, the idea of MC consists in merging data using an insertion function (non-supervised scheme) into an image or a set of images, before the encoding pr- ocess. Afterwards, a separation function is used to extract the required information from the decoded data.
the CCSDS and JPEG 2000 standards. Consequently, a fast encoding/decoding is achieved without any signifi-cant loss of information.
This paper is organized as follows: in Section II, the methodology of Multimodal Compression extended to hyperspectral volumetric data, is presented. Results and performance analysis evaluated on AVIRIS database are presented in section III. Finally, a conclusion is provided in section IV.
2. Methodology
We consider an hyperspectral image sequence, denoted by iwhere i = 1,···,K refers to channels. Each channel corresponds to an
S
MN image.
The Multimodal Compression of this sequence re-quires various phases, namely, 1) analysis, 2) insertion and 3) encoding. The process is inverted for the decoding purpose (see Figure1).
2.1. Analysis Phase
In this phase, hyperspectral images to be compressed are sorted so that those containing less information are con-sidered potentially appropriate to be merged in the re-maining images. For this purpose, an objective criterion should be defined. This criterion can perform a simple statistical analysis along the image channels. In this work, we consider that the smooth images are relatively poor in terms of information. Therefore, the variance is used as indicator to sort images from the highest variance to the lowest one. Consequently, the number of images L that can potentially be merged depends on the global size of the Region of Interests in the whole sequence.
global ROI
L N N MN
K
(1)
where Nglobal M N and ROIis to the number of pixels corresponding only to the Region of Interests in
[image:2.595.58.287.536.695.2]N
Figure 1. Multimodal Compression scheme applied to hy-perspectral images.
the sequence to be compressed. is the floor func-tion.
2.2. Mixing Phase (Non-Supervised Scheme)
Definition: we call a non-supervised scheme of mixing function, a procedure which consists in replacing some pixels of a host image by other useful pixels provided by another source [10] according a rule defined by the user and matching the application.
In this case, we consider that L smooth images have been selected. Corresponding pixels are interleaved in the contours of the KL remaining images after a down-sampling process. In other words, in the interleav-ing process, each pixel over two pixels that belong to the ROIN, is replaced by another one that belong to the smooth images to be embedded, as specified in Figure2. In such a case, we define two regions, namely, 1) Region of Interest (ROI) and 2) Region of Insertion (ROIN). Only ROINs should be down-sampled since we consider that central regions (ROIs) contain the main information that should not be distorted. As it is shown in Figure 2, the central region which forms an ROI for the compres-sion phase is left without sampling.
In order to reduce the size of the volumetric image to be compressed, L images should be embedded within
KL images by considering the following condition:
0 L K 2
In the extreme case (i.e. LK 2) no ROIs are used and the volumetric image to be compressed is exactly half the initial size.
If the size of the ROI in each image is M1N1, the number of samples (called here, the capacity) that could be embedded in each image will be given by:
1 1
2
M N M N
C (2)
Hence, knowing the capacity of insertion, the number of images that could be dispatched is given by:
ins
K C K
M N
(3)
Finally, the size of volumetric image is reduced to:
ins
SKK (4)
2.3. Encoding Phase
Figure 2. Compacting process. Pixels interleaving in the mixing phase.
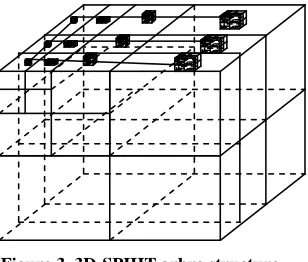
Figure 3. 3D-SPIHT arbre structure.
encoding, regarded as an important functionality. Since this algorithm is well known, it will not be de-scribed in this paper. For this purpose, detailed informa-tion can be found in [9-11].
2.4. Decoding Phase
One of the 3D-SPIHT properties is that the algorithm allows progressive decoding of codestreams. At this ph- ase, a reduced volume containing the data mixture is ob-tained.
2.5. Separation Phase
After the decoding phase, this step consists in extracting the embedded images from the contours of each image corresponding to a decoded reduced volume. Afterwards, an interpolation is performed on the contours in order to estimate missing pixels values. The interpolation used here is linear. It is calculated from the neighbourhood of each missing pixel. Hence, the interpoled pixel pi(m,n)is given by:
2
1 1
, , 1 1
4
l l
i
l
p m n p m n p m n
, (5)where (m,n) defines the interpoled pixel position.
3. Simulation Results
To evaluate the performance of a Multimodal Com-pression scheme using 3D-SPIHT on a sequence of hy-perspectral images, experiences have been performed according to the following three phases:
1) Comparison phase: 3D-SPIHT is compared to stan-dards such as: CCSDS (The Consultative Committee for Space Data Systems) [12] and JPEG 2000 [4,6]. The aim of this phase is to show the superiority of 3D based-en- coders, namely 3D-SPIHT, compared to 2D based-en- coders.
2) Analysis phase.
3) Multimodal Compression based 3D-SPIHT: the 3D-SPIHT is included in the context of Multimodal Compression as described in Section 2.
For this purpose, we have used several hyperspectral sequences from AVIRIS database (Airborne Visible In-frared Imaging spectrometer). We have used a dataset of the Yellowstone scene, acquired in 2006 and having a size of 512 × 614 over 224 optical bands. This AVIRIS calibrated radiance images can be downloaded from http://aviris.jpl.nasa.gov/html/aviris.freedata.html.
Comparison phase
As evoked above, 3D-SPIHT is compared in terms of bit-distortion to both CCSDS standard and JPEG 2000. For this purpose, a sequence of 16 images has been used. Since these coders are wavelet-based, three levels of decomposition have been considered using bi-orthogonal filters 9/7, as recommended by the CCSDS. Simulations were performed using the software TER 2.02, which is an implementation of the recommendations of CCSDS image compression (Recommended Standard CCSDS 122.0-B-1 Blue Book). http://gici.uab.es/TER/
For JPEG2000 coder, we have used Kakadu Version 5.11 which implements the Part 1 and the Part 2 of JPEG2000 standard.
For a range [0.25 - 2] bpppb (bits per pixel per band), the averaged Peak Signal-to-noise, Ratio ( ) is calculated, where is commonly defined by:
A PSNR PSNR
16
210
2 1
10 log
PSNR
MSE
(6)
where MSE is the mean square error between the original and reconstructed image.
As it can be shown on Figure4, the performance cur- ves show that the averaged increases with the bit-rate (bpppb) according to a law which can be appro- ximately logarithmic. On the other hand, one can point out that 3D-SPIHT outperforms, within the analyzed range, both JPEG2000 and CCSDS. This was somehow expected since 3D-SPIHT takes into account the correla-
0.2 0.4 0.6 0.8 1 1.2 1.4 1.6 1.8 2 40
45 50 55 60 65 70
Bit-rate(bpppb)
PSN
RA
(d
B
)
[image:4.595.62.280.87.282.2]CCSDS 3D-SPIHT JPEG2000
Figure 4. Comparison between CCSDS, JPEG 2000 and 3D-SPHIT in terms of bite-rate distortion curve. Results show that the 3D-SPHIT outperforms the other codecs.
tion along the sequence images to be compressed.
Based on this result, the Multimodal Compression scheme will integrate 3D-SPIHT for the encoding and decoding purpose.
3.1. Analysis Phase
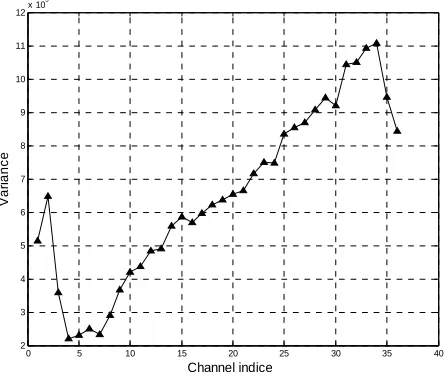
In this phase, the initial hyperspectral sequence i is analyzed in terms of statistics so that one can determine the images that potentially can be embedded into other images. For this purpose, using a sequence of 36 images extracted of the Aviris basis acquired on Yellowstone WY in 2006, the variance of each channel has been cal-culating leading to the curve shown in Figure5.
S
0 5 10 15 20 25 30 35 40
2 3 4 5 6 7 8 9 10 11 12x 10
5
Channel indice
Var
iance
Figure 5. The variance evolution of the hyperspectral se-quence.
From this variance evolution, one can point out an important increasing tendency along the channels. Mor- eover, one can sort the channels so that those presenting low values are potentially interested to be mixed with the remaining channels in the context of Multimodal Compr- ession.
3.2. Multimodal Compression Based 3D-SPIHT Phase
By setting the filling area to 20%, producing hence a ROI of 80%; in such a case, four images can be inserted in the remaining images (initially 36) of hyperspectral sequ- ences. After this reduction, a sequence of 32 images is obtained. This new sequence has been compressed using 3D-SPIHT within a range [0.01 - 1.75] bpppb. For each bit-rate, the averaged , denoted by A, the root mean squared error (RMSE) and percentage error (%E) are evaluated [13]. They are given by the Equations (7) and (8), respectively:
PSNR PSNR
36 614 512 2
, ,
1 1 1
1
36 614 512 k i j i j i j
RMSE I k R k
(7)
36 614 512
, ,
1 1 1 ,
( ) ( )
1 %
36 614 512 ( )
i j i j
k i j i j
I k R k
E
I k
(8)whereIi j,
k andRi j,
k are the pixel values theorigi-nal and the reconstructed base respectively at the spatial location
i j, of the band k.36: number of sequences to be compressed.
[image:4.595.311.539.316.400.2]512 × 614: size of each image from the dataset of the Yellowstone scene.
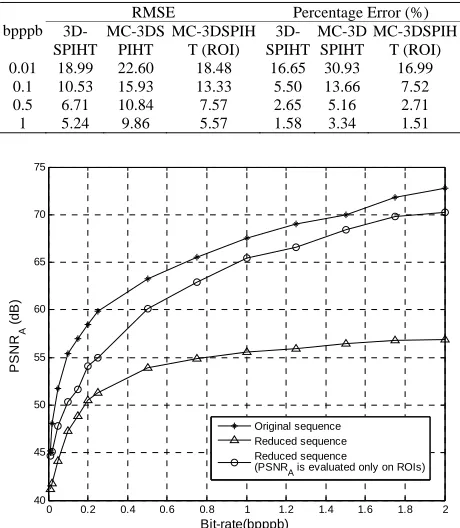
Table 1 lists the RMSE and %E of the reconstructed data for different bpppb.
In Figure6, only the A evaluated on the whole sequence is shown. Therefore, three performance curves are provided, corresponding, respectively to 1) the origi-nal sequence compressed by 3D-SPIHT; 2) reduced se-quence using the Multimodal Compression; 3) reduced sequence using the Multimodal Compression for which the A is evaluated only on ROIs. By analyzing these curves, based only on the A, one should note that for low bpps, the quality of the decompressed im-ages is objectively almost the same, whereas for high bpppbs, the quality remains subjectively the same (based on the visual quality). This can be explained by the fact that when dealing with PSNRs greater than 50 db (which is the case here), it becomes very difficult to distinguish, visually between image qualities.
PSNR
PSNR
PSNR
On the other hand, when comparing the performance curve corresponding to the direct compression (3D-SPI- HT) to the MC-3D-SPIHT by considering the A at the level of ROIs, one can notice that almost the same
[image:4.595.60.283.507.693.2]results are obtained. By considering the other criteria of quality evaluation, namely the RMSE and E%, the concl- usion is the same as it is highlighted in Table 1. Very close values are obtained.
In terms of quality, one can conclude that the MC-3D- SPIHT preserve the information without any significant distortion (see Figure7). In terms of computing time, the proposed technique becomes particularly interesting since the encoding or the decoding are both achieved on a reduced number of images. As shown in Table2, en-coding/decoding time is compared for various bpppbs. The evaluation has been performed on a computer run-ning at 1.6 GHz. Table2 highlights the computing time for both techniques and show clearly that the MC-3D- SPIHT outperforms the direct compression technique which is even obvious since only 32 images are consid-ered. From these 32 images, 4 extra images are extracted by the proposed approach without significant loss of qua- lity.
[image:5.595.309.537.85.274.2]On the other hand, the mixing/separation functions are not time consuming since these tasks can be achieved using a DMA “Direct Memory Access” which doesn’t
Table 1. Statistical based measures of reconstructed data for different bpppb (with and without multimodal com-pression).
RMSE Percentage Error (%)
bpppb 3D-
SPIHT MC-3DS
PIHT
MC-3DSPIH T (ROI)
3D- SPIHT
MC-3D SPIHT
MC-3DSPIH T (ROI)
0.01 18.99 22.60 18.48 16.65 30.93 16.99
0.1 10.53 15.93 13.33 5.50 13.66 7.52
0.5 6.71 10.84 7.57 2.65 5.16 2.71
1 5.24 9.86 5.57 1.58 3.34 1.51
0 0.2 0.4 0.6 0.8 1 1.2 1.4 1.6 1.8 2 40
45 50 55 60 65 70 75
Bit-rate(bpppb)
PSN
RA
(d
B
)
Original sequence Reduced sequence Reduced sequence
(PSNRA is evaluated only on ROIs)
Figure 6. Comparison between the direct compression using 3D-SPHIT, MC-3D-SPIHT. In low bpppbs the quality is objectively almost the same. In high bpppbs the visual qual-ity is also almost the same (>55 dB). Moreover, MC-3D- SPIHT is faster in the encoding/decoding process.
(a) (b)
(c) (d)
[image:5.595.305.538.372.457.2]Figure 7. Reconstitution of image channel 30. (a) Original image; (b) Same image embedding other pixels from an-other image (in the contours); (c) Reconstructed image at 0.5 bpp; (d) Reconstructed image at 1 bpp.
Table 2. Comparison of the encoding and decoding times evaluated for different bpppb (with and without multimo-dal compression).
Without M-Compression With M-Compression
bpppb
Tc Tdec Tc Tdec
0.01 9.55 3.16 9.45 3.15
0.1 10.221 3.36 10.08 3.25
0.25 10.31 3.70 10.38 3.55
0.5 10.98 4.22 10.95 4.01
1 12.61 5.30 12.09 5.05
1.5 14.17 6.80 13.53 6.28
2 15.67 7.61 15.08 7.39
Tc: encoding times on seconds. Tdec: decoding times on seconds.
require to use any processor cycle. Finally, the proposed technique requires an interpolation to be applied on each image contour, but the time required to achieve this task is insignificant (<500 Milliseconds) compared to the whole decoding time process.
Objectively, using the multimodal compression one can encode a given volume by preserving the same qual- ity as obtained with the direct techniques but using, es- sentially, less computing time which is an important ad- vantage.
4. Conclusions
[image:5.595.57.287.397.661.2]ndards. In the second phase, the size of the sequence to be compressed has been reduced by approximately 20% using the mixing function then compressed using 3D- SPIHT. After the decompression and separation process, we showed that the quality of the decoded images using various criteria are objectively and subjectively very close to the one obtained by a direct compression. The major advantage is that the MC-3D-SPIHT reduces sig-nificantly the coding/decoding time and improves the compression ratio in comparison to a direct compression using JPEG 2000 or CCSDS. This makes this approach very appropriate to deal with huge data. In the future work, optimizing the mixing function could be an inter-esting perspective.
REFERENCES
[1] E. Christophe, C. Mailhes and P. Duhamel, “Hyperspec-tral Image Compression: Adapting SPIHT and EZW to Anisotropic 3D Wavelet Coding,” IEEE Transactions on Image Processing, Vol. 17, No. 12, 2008, pp. 2334-2346. doi:10.1109/TIP.2008.2005824
[2] B. Penna, T. Tillo, E. Magli and G. Olmo, “Transform Coding Techniques for Lossy Hyperspectral Data Com-pression,” IEEE Transactions on Geoscience and Remote Sensing, Vol. 45, No. 5, 2007, pp. 1408-1421.
[3] M. Lahdir, S. Ameur and A. Adane, “Algorithme non ité- ratif basés sur les ondelettes biorthogonales et les fract- ales pour la compression des images satellitaires,” Té-lédétection, Vol. 6, No 4, 2006, pp. 345-360.
[4] D. S. Taubman and M. W. Marcellin, “JPEG2000: Image Compression Fundamentals, Standards and Practice,” Klu-wer Academic Publishers, Boston, 2002.
[5] Q. Du and J. E. Fowler, “Hyperspectral Image Compres-sion Using JPEG2000 and Principal Component Analy-sis,” IEEE Geoscience and Remote Sensing Letters, Vol.
4, No. 2, 2007, pp. 201-205. doi:10.1109/LGRS.2006.888109
[6] P. L. Dragotti, P. Giovanni and A. R. P. Ragozini, “Com-pression of Multispectral Images by Three Dimensional SPIHT Algorithm,” IEEE Transactions on Geoscience and Remote Sensing,Vol. 38, No. 1, 2000, pp. 416-428. doi:10.1109/36.823937
[7] J. E. Fowler and J. T. Rucker, “3D Wavelet-Based Com-pression of Hyperspectral Imagery,” In: C.-I. Chang, Ed., Hyperspectral Data Exploitation: Theory and Applica-tions, John Wiley & Sons, Inc., Hoboken, 2007.
[8] A. Naït-Ali and C. Cavaro-Menard (Ed.), “Compression of Biomedical Images and Signals,” ISTE-John Wiley and Sons, London, 2008, pp. 247-275.
[9] A. Naït-Ali, E. H. Zeybek and X. Drouot, “Introduction to Multimodal Compression of Biomedical Data,” In: A. Naït-Ali, Ed., Advanced Biosignal Processing, Springer, Berlin, 2009, pp. 353-375.
[10] X. Tang and W. A. Pearlman, “Three-Dimensional Wave-let-Based Compression of Hyperspectral Images,” Chap-ter in Hyperspectral Data Compression, Kluwer Aca-demic Publishers, Boston, 2005.
http://www.cipr.rpi.edu/ pearlman
[11] A. Said and W. A. Pearlman, “A New Fast and Efficient Image Codec Based on Set Partitioning in Hierarchical Trees,” IEEE Transactions on Circuits and Systems for Video Technology, Vol. 6, No. 3, 1996, pp. 243-250. doi:10.1109/76.499834
[12] P. S. Yeh, G. Moury and P. Armbruster, “The CCSDS Data Compression Recommendation: Development and Status,” Proceedings of SPIE Application of Digital Im-age Processing,Seattle, 7-10 July 2002.