MODELING
AND
SIMULATION
OF
1
Gessiel Newton Scheidt,
1Aloisio Freitas Chagas Junior,
1Sara Nepomuceno Patriota,
1, *
1
Bioprocess Engineering and Biotechnology Division, Federal University of Tocantins (UFT),
Campu
2
Professional Masters in Urban Environment and Industrial of the Federal University of Paraná (UFPR),
ARTICLE INFO ABSTRACT
This study aimed to modeling and mathematical simulation of immersion bioreactor by bubbles. Were used shoots
benzylaminopurine) 0.25 mg L
5.8. The cultures were maintained in growth room at 25 ± 2 ° C under cool white fluorescent lamps (35 mol.m
thirty shoots in stages. After 30 days
respirometry and hydrodynamics B.I.B.®. It was found that irradiance of 35 over 16 hours, determining the O
The relative electrical conductivity has a behavior consistent with what is expected of the mixture in the bioreactor, and is an appropriate measure to aeration of the culture medium promoting good stirring, causing a homogenization (180s to reach 95% of the
indicates that there exists beyond the aeration mass liquid transfer means between stages. The results of the kinetic variable, total number of shoots, total fresh mass and shoot height propitiated consistency in relation
Copyright©2017, Gessiel Newton Scheidt et al. This is an open access article distributed under the Creative Commons Att
unrestricted use, distribution, and reproduction in any medium, provided the original work is properly cited.
INTRODUCTION
Mathematical modeling has always followed the evolution of engineering, from the classic works of Fredrickson and Ramkrishna (1968) even the most recent, and constitutes a set of equations or mathematical structures, essential for the processing of data, as well as the rational formulation and understanding the complex interactions that occur in the physical, chemical and biological systems. However, the evolution of computers and the use of mathematical tools are of great value to the various fields of biotechnology processes with large impacts in areas ranging from functional genomics to the development of bioreactors (Unger et al.,
and Anspach, 2003). In line with the above assertion, Scheidt (2008) describes the modeling and simulation has heuristic value that allows us to formulate hypotheses about the relevant
*Corresponding author: Augustus CaeserFrankePortella
Professional Masters in Urban Environment and Industrial of the Federal University of Paraná (UFPR), Curitiba-PR, Brazil
ISSN: 0975-833X
Article History:
Received 08th October, 2016 Received in revised form 14th November, 2016 Accepted 15th December, 2016 Published online 31st January,2017
Key words:
Mathematical modeling, Bubbles bioreactor in vitro.
Citation: Gessiel Newton Scheidt, Aloisio Freitas Chagas Junior, Raimundo Wagner de Sousa Aguiar
immersion bioreactor by bubbles for culture plant tissue
RESEARCH ARTICLE
OF
IMMERSION
BIOREACTOR
BY
BUBBLES
TISSUE
Aloisio Freitas Chagas Junior,
1Raimundo Wagner de Sousa Aguiar,
Sara Nepomuceno Patriota,
2Debora Portella Bis,
1AlexSander Rodrigues Cangussu and
1, *
Augustus CaeserFrankePortella
Bioprocess Engineering and Biotechnology Division, Federal University of Tocantins (UFT),
Campus de Gurupi, Gurupi-TO, Brazil
Professional Masters in Urban Environment and Industrial of the Federal University of Paraná (UFPR),
Curitiba-PR, Brazil
ABSTRACT
This study aimed to modeling and mathematical simulation of immersion bioreactor by bubbles. Were used shoots Oncidiumleucochilum, liquid MS medium supplemented with 1 mg L
benzylaminopurine) 0.25 mg L-1 NAA (naphthaleneacetic acid) and 0.5
5.8. The cultures were maintained in growth room at 25 ± 2 ° C under cool white fluorescent lamps mol.m-2.s-1), with 16 hours photoperiod. The experimental design was randomized blocks, with thirty shoots in stages. After 30 days of culture were assessed growth parameters of explants of respirometry and hydrodynamics B.I.B.®. It was found that irradiance of 35
over 16 hours, determining the O2 consumption totaling 23.8 hours between photosynthetic cycles. relative electrical conductivity has a behavior consistent with what is expected of the mixture in the bioreactor, and is an appropriate measure to aeration of the culture medium promoting good stirring, causing a homogenization (180s to reach 95% of the
indicates that there exists beyond the aeration mass liquid transfer means between stages. The results of the kinetic variable, total number of shoots, total fresh mass and shoot height propitiated consistency in relation to the established model.
is an open access article distributed under the Creative Commons Attribution License, which use, distribution, and reproduction in any medium, provided the original work is properly cited.
Mathematical modeling has always followed the evolution of engineering, from the classic works of Fredrickson and (1968) even the most recent, and constitutes a set of equations or mathematical structures, essential for the processing of data, as well as the rational formulation and understanding the complex interactions that occur in the ical systems. However, the evolution of computers and the use of mathematical tools are of great value to the various fields of biotechnology processes with large impacts in areas ranging from functional genomics al., 2000; Castilho In line with the above assertion, Scheidt (2008) describes the modeling and simulation has heuristic value that allows us to formulate hypotheses about the relevant
CaeserFrankePortella
Professional Masters in Urban Environment and Industrial of the PR, Brazil.
processes and interactions, to quantify the impact of single variables on the performance of the systems.
engineering reactors, it is noted today a growing deployment bioreactor temporary immersion and/or permanent, which promote the production of tissues, cells or plant organs on a large scale (Konstas and Kinzios, 2003; Xie
Oniscu et al., 2003). Rodrigues
development of new temporary immersion prototypes and or permanent, and the study of its operation in different cultures is essential to reduce costs, increase productivity and maintain the genetic quality of plant material subjected to this technique. RechFilho (2004) describes the in vitro culture systems of plant cells in bioreactors were initially used in the United States, Cuba and France. Currently many countries have begun to develop this technology in order to produce seedlings on a large scale that agricultural interest, especially ornamental, fruit and forest species, with greater speed and efficiency compared to other conventional methods used in parallel, there is a reduction in process costs (So
International Journal of Current Research
Vol. 9, Issue, 01, pp.44692-44698, January, 2017
INTERNATIONAL
OF CURRENT RESEARCH
Gessiel Newton Scheidt, Aloisio Freitas Chagas Junior, Raimundo Wagner de Sousa Aguiar et al.,
immersion bioreactor by bubbles for culture plant tissue”, International Journal of Current Research, 9, (01), 44692-44698.
BUBBLES
FOR
CULTURE
PLANT
Raimundo Wagner de Sousa Aguiar,
AlexSander Rodrigues Cangussu and
Bioprocess Engineering and Biotechnology Division, Federal University of Tocantins (UFT),
Professional Masters in Urban Environment and Industrial of the Federal University of Paraná (UFPR),
This study aimed to modeling and mathematical simulation of immersion bioreactor by bubbles. Were , liquid MS medium supplemented with 1 mg L-1 BAP (6-NAA (naphthaleneacetic acid) and 0.5 µL Tween 20, pH adjusted to 5.8. The cultures were maintained in growth room at 25 ± 2 ° C under cool white fluorescent lamps ), with 16 hours photoperiod. The experimental design was randomized blocks, with of culture were assessed growth parameters of explants of respirometry and hydrodynamics B.I.B.®. It was found that irradiance of 35 mol.m-2.s-1 supplied consumption totaling 23.8 hours between photosynthetic cycles. relative electrical conductivity has a behavior consistent with what is expected of the mixture in the bioreactor, and is an appropriate measure to aeration of the culture medium promoting good stirring, causing a homogenization (180s to reach 95% of the concentration equilibrium), which indicates that there exists beyond the aeration mass liquid transfer means between stages. The results of the kinetic variable, total number of shoots, total fresh mass and shoot height propitiated
ribution License, which permits
processes and interactions, to quantify the impact of single variables on the performance of the systems. In the field of engineering reactors, it is noted today a growing deployment bioreactor temporary immersion and/or permanent, which promote the production of tissues, cells or plant organs on a large scale (Konstas and Kinzios, 2003; Xie et al., 2003; Rodrigues et al. (2006) describe the development of new temporary immersion prototypes and or permanent, and the study of its operation in different cultures is essential to reduce costs, increase productivity and maintain of plant material subjected to this technique. RechFilho (2004) describes the in vitro culture systems of plant cells in bioreactors were initially used in the United States, Cuba and France. Currently many countries have begun in order to produce seedlings on a large scale that agricultural interest, especially ornamental, fruit and forest species, with greater speed and efficiency compared to other conventional methods used in parallel, there is a reduction in process costs (Soccol et al., 2008;Scheidt et INTERNATIONAL JOURNAL
OF CURRENT RESEARCH
al., 2011). Given the above, this study aimed to develop a behavioral modeling and mathematical simulation of immersion in a bioreactor by bubbles in order to obtain parameters for scaling and improved cultivation process.
MATERIALS AND METHODS
Bioreactor
[image:2.595.35.292.240.424.2]The TE-B.I.B.® system (Fig. 1): "Immersion Bioreactor by bubbles" developed and patented by Soccol et al. (2008), the machine is marketed by (TECNAL), making it a viable and effective alternative in the production of seedlings and secondary metabolites, this system allows the air renewal in vitro environment.
Figure 1. Schematic immersion bioreactor design by bubbles. A): Air output; B): Fixing Kit; C): Stages; D): Porous plate; E) basis; F): Air Intake. Source: Soccol et al. (2008)
Explants
Plantlets of Oncidiumleucochilum from seeding in vitro in nutrient solution (MS) solidified (Scheidt et al., 2009).
Experimental design
In this experiment we used liquid MS nutrient solution (Murashige and Skoog, 1962) supplemented with 1 mg L-1 BAP, 0.25 mg L-1 NAA, 30 g L-1 sucrose and 0.5 µL Tween® 20 pH adjusted to 5.8. The cultivations were conducted in a growth chamber for 30 days under 16-hour photoperiod, temperature and irradiance 252ºC 35 mol.m-1.s-1 provided by fluorescent lamps of the "white-cold" with aeration every 2 hours for 40 minutes, a total of three repetitions and thirty explants for randomized blocks.
Respirometry
These parameters are monitored by sensors, whose values were storedin realtime data acquisition system developed based on the implementation platform supervisory La'chish (LCDS Brazil, 2008). For the measurement of the percentage amounts of O2 and CO2-O2 were used A2® Alphasense sensors UK Ltd.
and GMT220 Vaisala CARBOCAP® Finland, respectively. In this work we used two sets of these sensors, one for measuring O2 and CO2 in the aeration inlet and another at the output. The
flow through was determined by measuring sensor thermal
dispersion (Sturm, 2004), model GFM® Aalborg USA. This system was applied together with a data acquisition software, which allow to monitor and record the values of all the variables in real time as (Sturm et al., 2007). PID controllers Novus® universal model were used to locally monitor the values and also as an interface between the Modbus network and the computer where the data are processed and stored.
Hydrodynamics
In order to determine the degree of efficiency in the mixing and the mass transfer capability between the gas phase and the nutrient solution in the immersion bioreactor by bubbles, flow measurements and conductivity on the medium they were made for different Tween concentrations 20 ®, using as tracer a solution of sodium chloride. The hypothesis saturation can be effectively tested by analytical methods. However, it is possible to evaluate the gas exchange area, the superficial velocity and the gas holdup, indicative of the mass transfer from the height measurements of the bubble column, the liquid phase and average bubble size. This evaluation was made with the acquisition of images using camera (PertaxOptio E 20) and these immersion bioreactor images by bubbles on a permanent basis, without plants, using Image Pro Plus software.
Variables assessed
After 30 days of cultivation, the following variables were evaluated:
A) O2 concentration and CO2 (gas flow); B) Net height X flow
and Tween® 20; C) Conductivity on X and aeration time; D) bubble size and distribution of liquid; E) Total number of shoots (NTB); F) Total Fresh pasta (MFT); G) shoot height (APA).
Mathematical model
Prediction models: The models proposed below are intended to describe the kinetics of increase in fresh weight of Oncidiumleuchochilum tissues, total height and number of shoots. They are not structured models and not segregated. They are proposed models established for microbial kinetics (logistic and Gompertz). Both start from the assumption of a maximum level for the dependent variable in question. In addition to the classical models for microbial kinetics, it is considered a simple theoretical model with two parameters, proposing the following: "The growth rate of the dependent variable is proportional to the difference between a supposed maximum theoretical level and the current value of the dependent variable." For comparative purposes, the kinetics is modeled by a linear model (considering the growth rate constant dependent variable).
METHODOLOGY
Ordinary differential equations are the theoretical models. The initial condition was fixed based on the observed data, and the resulting initial value problem was solved with the help of Maple 9:50 software. Algebraic equations resulting had their parameters adjusted for the Solver tool of MS Excel 2003. The criteria used for the optimization of the parameters to minimize the value of the sum of squared deviations. Still, the respective values were calculated. The results of the various proposed designs were compared.
Imposed restriction
The parameter which indicates the maximum possible value for the height of the seedlings was bounded above by 5.0 cm (which corresponds to the height of each level of immersion bioreactor by bullae). When the parameter denoting theoretical maximum value for fresh pasta exceeded by more than an order of magnitude the value observed in the last experimental period (30 days), their model was considered as "not capable of optimization". In equations (1) to (5), N represents the dependent variable (fresh weight of the explants or height), and t represents time. The parameters are denoted by "a" and "b". In equations (2), (3) and (4) the parameter "b" can be interpreted as the maximum threshold for the variable "N". The parameter "a" in equation (1) is the increme
respect to "t" can be interpreted as the increase of specific velocity (constant) in (2) and as a specific maximum speed increment in (3), (4) and (5).
a
dt
dN
………...aN
dt
dN
………...N
b
N
a
dt
dN
1
………...
N
b
aN
dt
dN
ln
………...
b
N
a
dt
dN
………...Linear Model; (2) unlimited exponential model; (3) logistic model; (4) Gompertz model; (5) simplified model of two parameters.
Models of Proposed Solutions
For all models, it will be considered the initial condition, which will be a parameter to be optimized for each model. Solutions to the proposed models, when considering the above condition, are:
at
N
N
0
………...at
e
N
N
0 ………...at
e
N
N
b
b
N
0 01
………... at e N bbe
N
0 ln ………...
ate
b
N
b
N
0
………... The parameter which indicates the maximum possible value for the height of the seedlings was bounded above by 5.0 cm (which corresponds to the height of each level of immersion When the parameter denoting theoretical r fresh pasta exceeded by more than an order of magnitude the value observed in the last experimental period (30 days), their model was considered as "not capable In equations (1) to (5), N represents the of the explants or height), and t represents time. The parameters are denoted by "a" and "b". In equations (2), (3) and (4) the parameter "b" can be interpreted as the maximum threshold for the variable "N". The parameter "a" in equation (1) is the increment speed "N" with respect to "t" can be interpreted as the increase of specific velocity (constant) in (2) and as a specific maximum speed
……….... (1)
……….... (2)
……….... (3)
……….... (4)
……….... (5)
Linear Model; (2) unlimited exponential model; (3) logistic model; (4) Gompertz model; (5) simplified model of two
For all models, it will be considered the initial condition, ized for each model. Solutions to the proposed models, when considering the above
……….... (1.1)
……….... (1.2)
……….... (1.3)
……….... (1.4)
……….... (1.5)
(1.1) Solving the linear model; (1.2) Solution of unlimited exponential model; (1.3) Solution of the logistic model; (1.4) Solution of the Gompertz model; (1.5) Solution of the simplified model of two parameters.
RESULTS AND DISCUSSION
The results of the measurement of gas mass produced and consumed by explant Oncidiumleuchochilum
Figure. 2. It is noted that irradiance of 35 supplied over 16 hours, determining the O totaling 23.8 hours of photosynthetic cycle.
Figure 2. Data for the O2 consumption in real time developed based on supervisory deployment platf
Brazil, 2008)
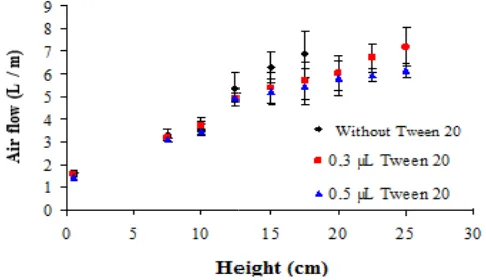
Because of the low volume of air transferred to the bioreactor, as well as reduced processing rate of oxygen into carbon dioxide and vice versa, there is a lack of sufficient sensitivity to recording such rates in the case of the presence of CO2. But the oxygen sensors showed sufficient sensitivity to record periods of respiration and photosynthesis, although with very low percentage given the volume of air introduced into the bioreactor and its ability to transform these gases by explants. The results regarding the flow estimates for different concentrations of Tween® 20 are shown in (Fig. 3). It was found by analysis that the air flow necessary to maintain a column of 15 cm of nutrient solution of high enough to cover the three stages ranging from 5 to 6L / min, d
amount of the surfactant.
Figure 3. Data of the air flow in real time developed based on supervisory deployment platform Lachish (LCDS Brazil, 2008)
The fact of using amounts of insufficient surfactant to stabilize foam, and to use relatively high flow rates of air to keep the foam in seedling height has two important consequences: a) presumably generates high O2
and b) causes homogenizing the liquid phase coalescence of bubbles, some of
entrained upwards again. Based on this hypothesis, it is (1.1) Solving the linear model; (1.2) Solution of unlimited exponential model; (1.3) Solution of the logistic model; (1.4) Gompertz model; (1.5) Solution of the simplified model of two parameters.
RESULTS AND DISCUSSION
The results of the measurement of gas mass produced and Oncidiumleuchochilum are shown in Figure. 2. It is noted that irradiance of 35 mol. m-2.s-1 supplied over 16 hours, determining the O2 consumption
totaling 23.8 hours of photosynthetic cycle.
Figure 2. Data for the O2 consumption in real time developed based on supervisory deployment platform Lachish (LCDS
of the low volume of air transferred to the bioreactor, as well as reduced processing rate of oxygen into carbon dioxide and vice versa, there is a lack of sufficient sensitivity to recording such rates in the case of the presence of CO2. But nsors showed sufficient sensitivity to record periods of respiration and photosynthesis, although with very low percentage given the volume of air introduced into the bioreactor and its ability to transform these gases by explants.
e flow estimates for different concentrations of Tween® 20 are shown in (Fig. 3). It was found by analysis that the air flow necessary to maintain a column of 15 cm of nutrient solution of high enough to cover the three stages ranging from 5 to 6L / min, depending on the
Figure 3. Data of the air flow in real time developed based on orm Lachish (LCDS Brazil, 2008)
The fact of using amounts of insufficient surfactant to stabilize relatively high flow rates of air to keep the foam in seedling height has two important consequences: a)
2 and CO2 transfer coefficients,
[image:3.595.307.549.213.317.2] [image:3.595.37.285.273.466.2] [image:3.595.311.554.544.684.2]postulated that the fluid level can be correlated to the flow of air and the concentration of surfactant according to an expression of theform:
A = a.Qb(1+c.[T])
Where (A) is the height of bubbles in cm (Q) is the air flow rate in mg / L, a, b and c are constants inherent to the bioreactor used and the temperature. In this case, the approximate coefficients a, b and c that best fit to the data are respectively a = 0.835; b = 1.608 and c = 0.162 with a regression coefficient R2 = 0.957 - which, considering the experimental error is acceptable. Thus, concentrations [t] below the CMC, the fluid level can be controlled by the concentration of surfactant or by aeration. The results of the estimates of nutrient solution height (cm) as flow function Q (L / min) and Tween® 20 concentration (mg / L), from the model are shown in (Fig. 4). The band used to plot is within the experimental limits.
Figure 4. Data relating to the time of nutrient solution flow as a function Q (L / min), and Tween® 20 concentration (mg / L) monitored by flowmeter
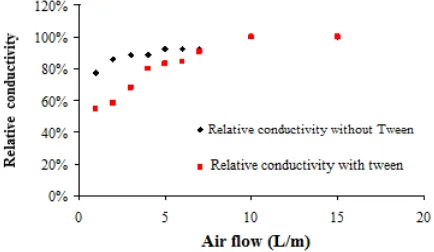
[image:4.595.315.548.126.265.2]The model analysis reveals that the variation of the air flow has a greater influence on the height of the nutrient solution that the concentration of Tween® 20. However, experimental work shows that air flows over 9 L / min generate excessive pressure the filtration system, and should be avoided. To check the mixing effect, we evaluated the electrical conductivity between the grid of the first and second stages, using as tracer a NaCl solution. To these electrolyte concentrations below 0.1M electrical conductivity is linearly proportional to the salt concentration. After injection of the tracer versus time conductivity measurements were carried out until stabilization. The results of the relative conductivity in the first stage are shown in (Figure 5).
Figure 5. Data of the electrical conductivity of the first stage as a function of aeration and aeration time were monitored by a digital multimeter (Minipa ET-1001)
The results concerning the behavior of the relative conductivity as a function of time, for the second stage are presented in (Figure 6). It is possible to verify that the relative electrical conductivity (S / Smáximum) increases rapidly with water, and is smaller for the same aeration when using Tween.
Figure 6. Electrical conductivity data of the first stage as a function of aeration and aeration time were monitored by a digital multimeter (Minipa ET-1001)
The analysis shows that there is stabilization of the conductivity (and hence the salt concentration) after 240 (s). However, the oscillation in the reading shows that the concentration does not very smoothly, even considering experimental errors, apparently the concentration in the second stage increases above the equilibrium point, before stabilizing. This behavior can be explained by a compartmentalized model of the bubble immersion bioreactor, with the following hypotheses:
Compartments: Although diffusion and mixing are variable within a stage, it is postulated that the physical division (stage screens) is a representative barrier. Thus, the bioreactor was divided into 4 compartments (Figure 7): one sub-stage, and the first, second and third stages.
Liquid distribution: At a flow rate of 6 L / min and a liquid height sufficient to reach all three stages, the distribution was approximately 44 mL below the first stage, 55 mL at stage (1), 86 mL at stage 2) and 16 mL in stage (3). In all cases this liquid is distributed in a "predominantly liquid" phase, in which the holdup gas is less than 0.5 and a "predominantly gaseous" phase, in which the holdup gas is much more than 0.5. For a 15 cm foam column, the average holdup gas is 0.79, a high value for bioreactors.
Bubble size: This size varies widely, but with observed values of 3 to 7 mm (mean 4.3 mm) for the sub-stage, from 2.6 to 12 mm (mean 6.9 mm) for stage 1, and 3.3 to 15.6mm (mean 7.5mm) for stage 2. At each stage, the bubbles begin in the lower range and undergo partial coalescence, which shows that the bars act as support of the stages and as diffusers, creating new bubbles. This relative independence of the stages also shows that it is possible, if the cultivation is done with permanent aeration, to use thelower diffuser as a "zero" stage with seedlings.
Gas-liquid interfacial area: From the average bubble sizes and predominantly gaseous phase volume in each section of the reactor, it is possible to estimate the interfacial areas. The area for the sub-stage (where the bubbles are smaller) is 480 cm2, the first stage is 270 cm2 and the second stage is 220 cm2.
[image:4.595.49.263.293.423.2] [image:4.595.41.258.637.763.2]The area of the third stage was not estimated due to the irregularity of the bubble layer, which coalesces oscillatingly. Therefore, even without considering the area of the third stage, it is possible to estimate the total interfacial area as being of the order of 1000 cm2 under the operating conditions. This interface has a mean liquid thickness of less than 200 mL / 1000 cm2 = 0.2 mm, if we remember that not all of the liquid is involved in the "bubble" fraction of the stages. This thickness is small andrenewed by agitation, which guarantees mass transfer.
The contribution of the tracer volume (5mL in 200mL of nutrient solution): does not cause significant difference in the distribution of liquid in the bubble immersion bioreactor, being considered for calculating the concentration in time 0, in the sub-stage, and then with A 2.5% increase in volumes at all stages.
From these data, we can equate the mass transfer between the stages or compartments through a mass balance, using transfer coefficients "k".
The balance for the 1st stage is:
V1.dC1/dt = FS1.CS + F21.C2 – F1S.C1 – F12.C1,
Where: V1 is the volume of liquid in the 1st stage;
CS, C1, C2, C3 are the salt concentrations in sub-stage 1, and in stages 1, 2 and 3, respectively;
FS1 = F1S = solution flow from sub-stage 1 (S) to stage 1, and vice versa;
F21 = F12 = solution flow from stage 2 to stage 1, and vice versa;
Simplifying the expression, dC1 / dt = FS1 (CS-C1) -F21 (C1-C2).
This system of equations is subjected to the following boundary conditions:
The initial concentrations are: CS = (5mL * 1mol / L) / (43.5mL + 5mL) = 0.103M (is the salt dilution), and C1 = C2 = C3 = O;-
The final concentrations are:
CS = C1 = C2 = C3 = (5mL * 1mol / L) / (200mL + 5mL) = 0.0244M
(By diluting the salt throughout the bioreactor)The volumes VS, V1, V2 and V3 are those already determined, with an increment of 2.5%, ie:
VS = 44.7 mL; V1 = 56.4 mL; V2 = 87.6 mL; And V 3 = 16.3 mL.
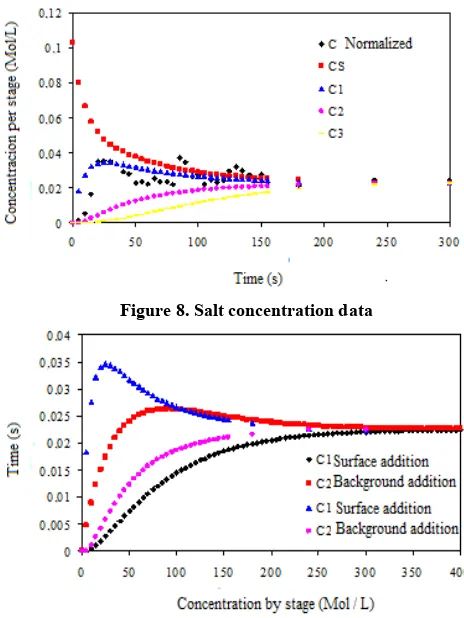
[image:5.595.80.514.57.340.2]From these values, it is possible to find a family of curves that illustrates the behavior of the system. One of the solutions is illustrated below, for FS1 = 2 mL / sec, F12 = 1 mL / sec and F23 = 0.3 mL / sec. The results of the salt concentration by stages, for FS1 = 2 mL / s, F12 = 1 mL / s and F23 = 0.3 mL / s, are presented in Figure 8. The analysis of the above figure allows concluding that the oscillation in the salt concentration can be explained by the compartmentalized model, although more measurements are needed to define what the actual values of inter-stage liquid flows are. It is also possible to conclude that the agitation promoted by aeration causes homogenization of the medium in a matter of minutes (180 s to reach 95% of the equilibrium concentration), which can be explained by the high mass transfer rates between stages (FS1, F12, F23).
Figure 8. Salt concentration data
Figure 9. Data related to the concentration of solutes in the stages
[image:6.595.100.503.232.312.2]The results concerning the simulation of the solute concentration in stages 1 and 2 of the bubble immersion bioreactor with addition of solute in sub-stage 1 (bottom) and in stage 3 (top) are presented in (Figure 9).Even in the case of addition of solutes at the top of the bubble immersion bioreactor, the concentration is stabilized at 265 (s) to achieve 95% equilibrium concentration. The results concerning the kinetic measurement for the fresh mass variable of Oncidiumleuchochilum are presented in (Table 1).
[image:6.595.39.271.353.662.2]Figure 10.Data referring to the total number of shoots
Figure 11. Fresh kinetic data (g) using the exponential model
The analysis of the results allows to conclude that, among the models tested, the exponential was the one that best fit the data of total fresh mass (R2 = 0.992 in the first stage of the bioreactor and R2 = 0.990 in the 2nd stage). These results suggest that mass gain by seedlings has not yet been inhibited by physical limitations of the bubble immersion bioreactor within the time horizon of the experiment. However, seedlings of the second stage have a specific mass increment lower than the first stage (1.93x10⁻²dia-1 and 1.56x10⁻²dia-1, respectively, considering the exponential model), which may indicate some
Table 1. Optimized parameters for fresh mass kinetics (MS) models of Oncidiumleuchochilum after 30 days of culture in bubble immersion bioreactor
Models
Parameters
1st stage 2nd stage
N0 a b R2 N0 a b R2
Linear 337.5 8.93 - 0.974 314.3 6.29 - 0.978
Exponential 346.4 1.93x10⁻² - 0.992 319.5 1.56x10⁻² - 0.990
*Logistic 346.4 1.93x10⁻²
0.992 319.5 1.56x10⁻²
0.990*Gompertz
346.4 0
0.992
319.5 0
0.990**Simplified
337.5 0
0.974
314.3 0
0.978* The Gompertz and logistic models tend to exponential; ** The simplified model tends to linear.
Table 2. Optimized parameters for Oncidiumleucochilum shoot height (APA) models after 30 days of culture in the bubble immersion bioreactor
Models
Parameters
1st Stage 2nd Stage
N0 A b R2 N0 a b R2
Linear 0.537 1.25x10⁻² - 0.970 0.513 6.64x10⁻³ - 0.979
Exponential 0.554 1.70x10⁻² - 0.953 0.518 1.08x10⁻² - 0.976
*Logístic 0.523 5.72x10⁻² 1.05 0.975 0.512 2.47x10⁻² 1.099 0.979
*Gompertz 0.520 4.11x10⁻² 1.12 0.977 0.512 1.49x10⁻² 1.27 0.979
**Simplified 0.517 2.48x10⁻² 1.24 0.979 0.511 5.29x10⁻³ 1.87 0.980
* The Gompertz and logistic models tend to exponential; ** The simplified model tends to linear.
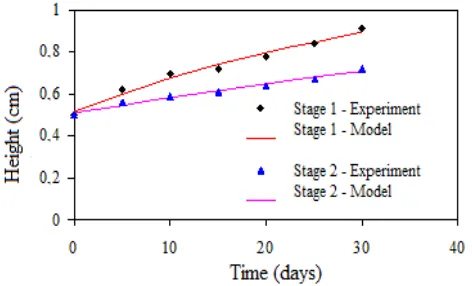
[image:6.595.317.537.355.485.2] [image:6.595.310.538.519.656.2]degree of impediment of growth in the second stage in relation to the first. The results concerning the estimates of the mean values for the variable, total number of shoots of Oncidiumleuchochilum explants are presented in (Figure 10). The results concerning the estimates of the mean values for the variable fresh mass of Oncidiumleuchochilum explants are presented in (Figure 11). In this cycle, the explants were immersed for forty minutes in the nutrient solution twelve times a day, which probably allowed a greater absorption and use of the medium. This higher fresh mass production in the first stage, observed in the bubble immersion system, is possibly due to a greater contact of the liquid medium with the explants, which gave a greater area of absorption and, consequently, a better utilization of the Nutritious solution.The kinetic results for the variable height of the aerial part of Oncidiumleuchochilum are presented in (Table 2). The models that best described the vertical growth were those that predicted limitation, namely: logistic (R2 = 0.975 in the 1st stage and R2 = 0.979 in the 2nd stage), Gompertz (R2 = 0.977 in the 1st stage and R2 = 0.979 in the 2nd Stage) and simplified two parameters (R2 = 0.979 in the 1st stage and R2 = 0.980 in the 2nd stage). The results regarding the estimates of the mean values for the variable, shoot height of Oncidiumleuchochilum explants are presented in Figure 12.
Figure 12. Data concerning the kinetics of shoot height (cm) using the simplified model
Similar to the kinetics of the fresh mass, it is possible to observe the greatest difficulty in the acquisition of height by the seedlings in the second stage in relation to the first stage. It is observed that the vertical growth kinetics exhibit different behavior with respect to the kinetics of mass gain, which motivates future work in order to investigate if this effect is due to the metabolism and physiology of the species under study, or due to the geometric properties And functional aspects of the bioreactor.
Conclusions
The analysis of the simulations showed that the compartmentalized model of the bioreactor was able to describe in a coherent way the hydrodynamics of the system. Regarding the kinetic models, the exponential model was the best fit for the fresh mass increment. However, the simplified model more accurately described the results for shoot height of Oncidiumleuchochilum seedlings.
REFERENCES
Castilho, L. R., e Anspach, F. B. CFD-aided design of a dynamic filter for mammalian cell separation. Biotechnology and Bioengineering. 83; 514-524, 2003. Konstas, J. e Kintzios, S. Developing a scale-up system for the
micropropagation of cucumber (CucumissativusL.): the effect of growth retardants, liquid culture and vessel size. PlantCellReports. 21; 538-548, 2003.
LCDS, Brasil. Leão Consultoria e Desenvolvimento de Sistemas LTDA. Disponível em http://www.lcds.com.br/ lcds.asp, Acesso em 10 de novembro de 2008.
Murashige, T. e Skoog, F. A revised medium for rapid growth and bioassays with tobacco tissue culture. PhysiologiaPlantarum. 15; 473-497, 1962.
Oniscu, C., Galaction, A. I., Cascaval, D.The characterization of mechanical mixing bioreactors efficiency.Revista de Chimie. 54; 241-249, 2003.
Rech Filho, A. Sistemas de imersão temporária e unidades encapsuláveis como ferramentas para a consolidação de protocolos para a micropropagação de bromélias. (Mestrado em Recursos Genéticos Vegetais) - Universidade Federal de Santa Catarina, p. 74, 2004. Rodrigues, P. H. V., Teixeira, F. M., Lima, A. M. L. P.,
Ambrosano, G. M. B. Propagationofhelicôniaplantlets in temporarilyimmersionbioreactor. Bragantia. 65; 29-35, 2006.
Scheidt, G. N., Desenvolvimento e validação de um biorreator do tipo imersão por bolhas para micropropagação de plantas. (Tese em Processos Biotecnológicos) - Universidade Federal do Paraná, p. 89, 2008.
Scheidt, G. N., Silva, A. L. L., Dronk, A. G., Biasi, L. A., Arakaki, A. H., Soccol, C. R. In vitro multiplication of Oncidiumleucochilum (Orchidaceae) in different culture system.Biociências, 17; 82-85, 2009.
Scheidt, G. N.; Silva, A. L. L., Oliveira, Y.; Costa, J. L.; Biasi, L. A.; Soccol, C. R.In vitro growth of MelaleucaalternifoliaCheel in bioreactor of immersion by bubbles. Pakistan Journal of Botany, 43; 2937-2939, 2011. Soccol, C. R., Scheidt, G. N., Mohan, R. Biorreator do tipo
imersão por bolhas para as técnicas de micropropagação vegetal. Universidade Federal do Paraná. Patente (DEPR. 01508000078). 03/03/ 2008.
Sturm, W. Sensores Industriais - Conceitos Teóricos e Aplicações Práticas. Papel Virtual Editora: Rio de Janeiro, 2004.
Sturm, W., Dergint, D. E. A., Soccol, C. R., Pandey, A. Instrumentation and Control in SSF (Chapter 07) In: Current Developments in Solid-State Fermentation. 1, 146-168. 1 Ed, New York: Springer Science+Business Media, LLC, 2007.
Unger, D. R., Muzzio, F. J., Aunins, J. E., Zinghvi, R. Computational and experimental investigational of flow and fluid mixing in roller bottle bioreactor.Biotechnology and Bioengineering.70; 117-130, 2000.
Xie, L. Z., Metallo, C., Warren, J., Pilbrough, W., Peltier, J., Zhong, T., Pikus, L., Yancy, A., Leung, J., Aunins, J. G., Zhou, W. C. Large-scale propagation of a replication-defective adenovirus vector in stirred-tank bioreactor PER.C6 (TM) cell culture under sparging conditions. Biotechnology and Bioengineering.83; 45-52, 2003.