ISSN Online: 1947-394X ISSN Print: 1947-3931
DOI: 10.4236/eng.2018.108036 Aug. 8, 2018 505 Engineering
Analysis on River Bed Changes in Weir
Downstream by Real-Scale Experiment
Dongwoo Ko, Joongu Kang
*Korea Institute of Civil Engineering and Building Technology (KICT), Goyang-Si, Gyeonggi-Do, Korea
Abstract
Flood damage has aggravated recently owing to artificial structures in high flow rare areas such as small rivers, which can lead to secondary damage. In this regard, studies are required to examine the conventional design criteria formulas to secure the stability of structures such as weirs and drop struc-tures. Although studies on the stability of these structures have been con-ducted through small-scale experiments, few empirical studies have investi-gated the hydraulic phenomena occurring near actual artificial structures. In this study, we fabricated real-size models of weir and drop structure at the Andong River Experiment Center and investigated the flow patterns around the structures by applying the particle image velocimetry analysis technique with a flow tracker. We also measured the scour length in the waterspout sec-tion when the structures are overflowing, and compared it with the values calculated using the formula. Consequently, as the supply flow increases, the result is different from the value calculated using the formula given in the ex-isting design standard, and it is judged to be inappropriate for a small stream area with high flow rate. Thus, it is necessary to consider the design factors such as energy gradient and the flow amount per unit width into weir and drop structure as well as the existing design factors in designing an apron sec-tion for a weir and drop structure.
Keywords
Weir, Drop Structure, Real-Scale Experiment, River Bed, Scour Characteristic
1. Introduction
It is crucial to evaluate the stability of the design section in a weir and drop structure design for determining the stability. The stability evaluation should be precisely performed for every item if possible, considering the conditions such as How to cite this paper: Ko, D. and Kang,
J. (2018) Analysis on River Bed Changes in Weir Downstream by Real-Scale Experi-ment. Engineering, 10, 505-513.
https://doi.org/10.4236/eng.2018.108036
Received: July 26, 2018 Accepted: August 5, 2018 Published: August 8, 2018
Copyright © 2018 by authors and Scientific Research Publishing Inc. This work is licensed under the Creative Commons Attribution International License (CC BY 4.0).
DOI: 10.4236/eng.2018.108036 506 Engineering turning, activity, and settlement. However, the current domestic River Design Standard provides only the regulations for the design segment and the shape in the design of weirs and drop structures, while specifying no criteria for external force and internal force calculation for each stability evaluation item. Therefore, the design depends on judgments based on past experiences of structure installa-tion. Thus, it is difficult to determine how stable the currently installed weirs and drop structures are against floods.
Quantitative and qualitative analyses have been conducted on the scour pro-tection length and scouring characteristics of the apron at a weir downstream part according to the change in river bed slopes through the conventional small weir model experiment [3]-[8]. However, to derive a feasible improvement plan of the design standard, which is the objective of our study, the model scale effect must be minimized. Furthermore, to verify the reliability of previous model test results, comparative verification is required through empirical experiments. Thus, this study investigated the specifications and bed slopes of typical weirs and drop structures in small rivers through the existing literature review and field survey to apply the data to experiments. This study further examined the scour characteristics of the apron section at the downstream part depending on the real-size model fabrication and the actual flow rate. This study ultimately aims to propose an improvement plan for the scour protection length at the downstream parts of weirs and drop structures through experiment-based re-search.
2. Real-Scale Experiment
2.1. Experimental Setup
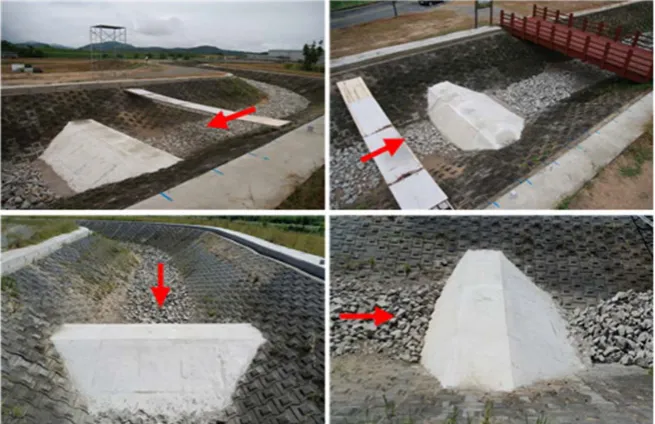
To investigate the scour protection length of the apron according to the bed slope, real-scale experiments on weirs and drop structures were conducted. The real-size weirs and drop structures were fabricated by the research team on the steep slope channel at the Andong River Experiment Center (A1), and the expe-riment was conducted in the range 1.7 m3/s to 5.0 m3/s according to the flow rate criteria in Figure 1.
The slope of the experimental water channel was selected as the representative value 0.03 (3%) within the range 0.01 to 0.05, which is the most commonly used value in reference to the status survey on domestic small rivers, and considering the site conditions where the control of the water channel slope is not easy.
DOI: 10.4236/eng.2018.108036 507 Engineering
Figure 1. Cross-section of the weir model.
weir and drop structure models installed in the experimental water channel were designed as trapezoidal real-scale models, and the models were connected to both sides of the channel across the reservoir. The length was 3 m and the crest width was 1 m in Figure 2.
2.2. Experimental Methods
The real-scale experiment with a weir and drop structure was conducted to in-vestigate the optimal apron length for the protection of downstream scour. Un-der the condition of 3% bed slope, the effect on downstream scour per flow rate was analyzed. The experimental flow rate was gradually increased from 1.7 m3/s to 5.0 m3/s to determine the upstream flow rate for five conditions, and the ex-periment was performed for the downstream boundary condition with outflow conditions. The experiment was conducted after 3 h of water flow to measure the downstream scour length for each flow rate. During the experiment, the flow rate distribution around the structure was measured through two methods using a flow tracker and particle image velocimetry (PIV). PIV is a whole-flow-field technique providing instantaneous velocity vector measurements in a cross-section of a flow. This technique being a non-intrusive one, allows the application of PIV in high speed flows, boundary layer studies of fluids. The technique is ap-plicable to a range of liquid and gaseous flows. The fluid is seeded with particles which are generally assumed to faithfully follow the flow dynamics. It is the mo-tion of these seeding particles from which the velocity informamo-tion is calculated. It is done by taking two images shortly after one another and calculating the dis-tance individual particles traveled within this time. The displacement field is de-termined from the motion of the seeding particles between the two images. The velocity field is obtained by dividing the displacement field by the known time separation. A total of 25 measurement points for the flow tracker were selected with five points for five measurement lines, respectively in Figure 3. For the ri-verbed material of the downstream part of the structure, boulder stones with a D50 of 0.35 m were installed to quantitatively examine the downstream scour of the weir.
3. Result
3.1. Velocity Distribution near the Weir
DOI: 10.4236/eng.2018.108036 508 Engineering
Figure 2. Weir model installed in the channel.
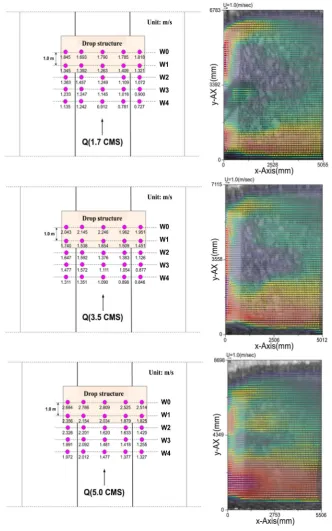
Figure 3. Measuring points for velocity.
1.7 m3/s, 3.5 m3/s, and 5.0 m3/s depending on weir installation using the flow tracker and PIV technique.
DOI: 10.4236/eng.2018.108036 509 Engineering
Figure 4. Velocity distribution near the weir.
3.2. Velocity Distribution near the Drop Structure
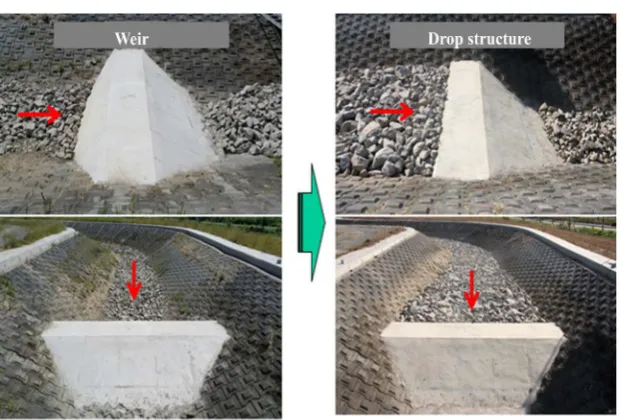
To compare the characteristics of the flow rate distribution of the weir and the drop structure, an experiment was conducted by modifying the weir model to the drop structure model conditions in Figure 5. As in the weir experiment, the flow rate distribution was measured for three flow conditions 1.7 m3/s, 3.5 m3/s, and 5.0 m3/s by using the flow tracker and PIV technique in Figure 6.
DOI: 10.4236/eng.2018.108036 510 Engineering
Figure 5. Model change from the weir to the drop structure.
through the bight of the water channel, the flow concentrated to the left side of the channel with the maximum flow rate of 1.457 m/s, 1.647 m/s, and 2.326 m/s for the aforementioned experimental conditions, respectively. However, owing to the lower water depth of the approach section when compared with the weir model, the overall flow rate tended to increase. While the flow passed through the drop structure, the water depth slightly decreased and the maximum flow rate increased to 1.845 m/s, 2.246 m/s, and 2.809 m/s, respectively. At the down-stream part, the flow shows the same pattern as the weir model experiment, and according to the results of the PIV analysis, the upstream flow shows the same flow pattern.
3.3. Verification of Apron Scouring Protection Length along the
Discharge
According to the change in the flow amount, the flow rate significantly increased near the weir and the drop structure and during the passing of the flow through the structure. This is because the total energy of the water flow increased with the change in the flow amount.
This study compared both the formula given by the National Construction Research Institute, as in (1), and Bligh’s formula, as in (2), presented in the River Design Criteria [9] with the scour length measured through the real-scale weir and drop structure experiments. Bligh’s coefficient (C) is differently defined ac-cording to the riverbed materials in Bligh’s formula. Nevertheless, this study se-lected a range of C values for boulder stones and cobbles, which are common ri-verbed materials mainly distributed in the small rivers (boulder stone and cob-ble: C = 4 – 6).
0.316 0.514 0.325
1 4.05 50
L = H q D − (1)
1 0.6
DOI: 10.4236/eng.2018.108036 511 Engineering
Figure 6. Velocity distribution near the drop structure.
where L1 is the apron length, H is the height of a weir from the apron (m), qis the discharge per unit (m3/sec/m), D
50 is 50% diameter of soil particle, C is the Bligh’s coefficient.
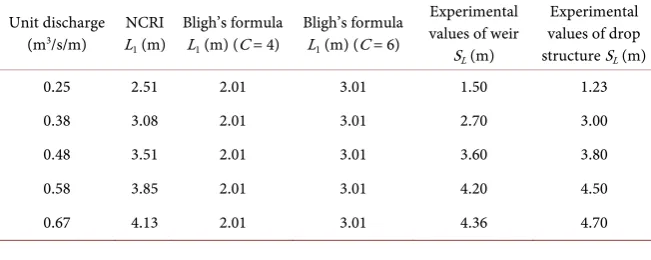
In-DOI: 10.4236/eng.2018.108036 512 Engineering apron length does not consider the flow amount per unit width, it showed a higher difference than the formula given by the National Construction Research Institute. Table 1 compares the calculation results obtained from the conven-tional design criteria formulas with the experimental data from the real-scale weir and drop structure experiments. According to the Table 1, compared the experimental values of drop structure with that of weir, it could be found that the values of drop structure are changing more sharply. This seemed to be be-cause the flow velocity at upstream of the drop structure is generally faster than that of weir, the energy of this water flow has a large effect on the downstream section. In addition, the results obtained from the Bligh’s formula are constant with a given Bligh’s coefficient value. This is to be because the height of a weir from the apron structure and Bligh’s coefficient were only considered as design factors.
Thus, it is necessary to consider the design factors such as energy gradient and the flow amount per unit width into weir and drop structure as well as the exist-ing design factors in designexist-ing the apron structure of a weir and drop structure.
4. Conclusions
This study analyzed the flow rate distribution around the structure through ex-periments by using real-scale weir and drop structure models, and further measured the scour length at the downstream part of the structure to compare the data with the values calculated through the existing design criteria formulas.
[image:8.595.211.537.602.732.2]According to the results of comparison with the formulas presented in the River Design Criteria, when the flow amount per unit width is 0.25, it can be observed that both the formula given by the National Construction Research In-stitute and Bligh’s formula are distributed within the allowable threshold. Bligh’s formula could be applied only to the minimum flow amount condition of 0.250,
Table 1. Comparison of experimental values and design formula values.
Unit discharge (m3/s/m) LNCRI
1 (m)
Bligh’s formula L1 (m) (C = 4)
Bligh’s formula L1 (m) (C = 6)
Experimental values of weir
SL (m)
Experimental values of drop structure SL (m)
0.25 2.51 2.01 3.01 1.50 1.23
0.38 3.08 2.01 3.01 2.70 3.00
0.48 3.51 2.01 3.01 3.60 3.80
0.58 3.85 2.01 3.01 4.20 4.50
DOI: 10.4236/eng.2018.108036 513 Engineering showing that, as the flow amount increased, the results became significantly de-viated from the experimental results. The formula given by the National Con-struction Research Institute showed a gradual difference from the experimental results from the flow amount per unit width of 0.480. As Bligh’s formula for apron length does not consider the flow amount per unit width, it showed a higher difference than the formula given by the National Construction Research Institute.
Future studies will improve and supplement the design standards of artificial structures such as weirs and drop structures based on experimental tests to re-duce the damage from natural disasters.
Acknowledgements
This research described in this paper was financially supported by “Development of the noise reduction technology around hydraulic structure using noise cancel-ling system” from Korea Institute of Civil Engineering and Building Technology.
Conflicts of Interest
The authors declare no conflicts of interest regarding the publication of this pa-per.
References
[1] Lee, S.J. and Yoon, K.S. (2005) Safety Evaluation of Revetment around Barriers and Drop Structures. Korean Society of Civil Engineers, 887-890.
[2] Lee, S.J., Yoon, K.S. and Hwangbo, J.G. (2006) Design of Revetment around Barriers and Drop Structures. Korean Society of Civil Engineers, 331-334.
[3] Gaudio, R., Marion, A. and Bovolin, V. (2000) Morphological Effects of Bed Sills in Degrading Rivers. Journal of Hydraulic Research, 38, 89-96.
https://doi.org/10.1080/00221680009498344
[4] Lenzi, M.A., Marion, A., Comiti, F. and Gaudio, R. (2002) Local Scouring in Low and High Gradient Streams at Bed Sills. Journal of Hydraulic Research, 40, 731-739.
https://doi.org/10.1080/00221680209499919
[5] Lee, S.O., Yoon, S.E. and Song, J.W. (2011) Temporal Variation of Local Scour Depth in the Downstream of Weir with Shapes. Journal of Korean Society of Civil Engineers, 31, 353-360.
[6] Lashkarara, B., Ghotbi, S.M.H. and Armaghani, A. (2012) Managing Local Scour Downstream of Cross-River Structures Case Study: Balaroud Inverted Siphon. World Applied Sciences Journal, 20, 570-576.
[7] Helal, E.Y. (2014) Minimizing Scour Downstream of Hydraulic Structures Using Single Line of Floor Water Jets. Ain Shams Engineering Journal, 05, 17-28.
https://doi.org/10.1016/j.asej.2013.06.001
[8] Ahmed A.A.M. (2015) Physical Model Study for Mitigating Local Scour Down-stream of Clear Over-Fall Weirs. Ain Shams Engineering Journal, 06, 1143-1150.
https://doi.org/10.1016/j.asej.2015.03.013