ISSN Online: 2327-5227 ISSN Print: 2327-5219
DOI: 10.4236/jcc.2018.612009 Dec. 26, 2018 91 Journal of Computer and Communications
Prediction of Solar Radiation Using Data
Clustering and Time-Delay Neural Network
Chee Keong Chan, Yi Hong Ler
School of Electrical and Electronic Engineering, Nanyang Technological University, Singapore
Abstract
In this paper, a combination of data clustering and artificial intelligence tech-niques are used to predict incoming solar radiation on a daily basis. The data clustering technique known as Perceptually Important Points is proposed, where time-series data is grouped into clusters separated by key characteristic points, which are later used as training data for an artificial neural network. The type of network used is known as a Focused Time-Delay Neural Net-work, and an analysis of the data is performed using the Mean Absolute Per-centage Error scheme.
Keywords
Prediction, Clustering, Neural Networks, Artificial Intelligence
1. Introduction
Currently, fossil fuels such as crude oil, coal and gas are the main resources of energy that are used in today’s world. Fossil fuel reserves are expected to deplete in the near future, with studies showing the depletion of oil and gas as fuels ex-pected to occur as soon as 35 to 37 years from the time of writing [1].
As a means to slow down the depletion of fossil fuels, renewable sources of energy are being utilized as alternatives to the aforementioned fossil fuels. Solar energy is one of the alternative sources of energy being researched, as the influx of solar radiation on the Earth’s surface is several magnitudes larger than the global power consumption of humanity as a whole [2].
The ability to accurately predict the incoming solar radiation is an important factor to improve the efficiency of a solar energy conversion system. One of the methods utilized to predict incoming solar radiation is the use of an empirical model. The empirical model is a technique which uses meteorological parame-How to cite this paper: Chan, C.K. and
Ler, Y.H. (2018) Prediction of Solar Radia-tion Using Data Clustering and Time-Delay
Neural Network. Journal of Computer and
Communications, 6, 91-97.
https://doi.org/10.4236/jcc.2018.612009
DOI: 10.4236/jcc.2018.612009 92 Journal of Computer and Communications ters as inputs to predict future values of solar radiation.
The main shortcomings of the empirical model are its focus on long-term prediction, its reliance on existing meteorological data, as well as its inability to identify abnormalities and account for sudden changes in data.
This paper proposes an alternative to the use of empirical models, which is the utilization of a combination of pattern recognition through data clustering tech-niques [3] as well as data modelling through artificial neural networks [4]. Through the clustering of data, an organized set of inputs can be used to more ac-curately train the neural network for use in predicting data. A focused time-delay neural network [5] is then used on each cluster.
2. Perceptually Important Point (PIP)
Perceptually Important Point (PIP) is a concept introduced by Chung FL, Fu TC, Luk R, and Ng V [6]. The purpose of PIP is to define the shape of a graph using points on the graph that are shown to be “critical points”: points which signify a point of change in the trend of the graph. The graph can be divided into clusters separated by the PIPs, which allows for data to be grouped by trend similarity.
The process behind identifying PIPs is as follows:
1) The start and end of the graphs are set to be the starting and end points. 2) The point on the graph with the greatest vertical distance is set as the first PIP, and is also used as the end point of the first cluster, and the start point of the second cluster.
3) Subsequent PIPs are obtained by finding a point with the greatest vertical distance from the start and end points of each cluster, forming new clusters.
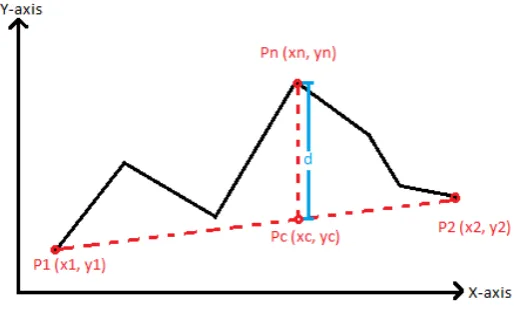
Algorithmically, the process behind segmenting the graph through PIPs can be explained as follows (Figure 1).
Points P1 and P2 on the time-series are established and a gradient is obtained between the two points.
[image:2.595.247.511.553.709.2]A point on the gradient Pc and a point on the time-series Pn with the same x-axis value are obtained. Initially, (x1 + 1) is selected as the initial x-axis value.
DOI: 10.4236/jcc.2018.612009 93 Journal of Computer and Communications The difference in values of the y-axis of points Pn and Pc is obtained, and set as distance d.
The x-value of Pc and Pn are incremented by one step and the distance d is calculated again. If the value of d obtained is greater than the previous value of d, the new value is stored. Otherwise, the new value is discarded and the old value of d is kept as the greatest vertical distance.
The x-value of Pc and Pn is repeatedly incremented until P2 is reached. The time-series can subsequently be segmented into cluster 1 (data from points P1 to Pn) and cluster 2 (data from points Pn to P2) (Figure 2).
The process is repeated recursively for cluster 1 and cluster 2 to obtain points Pm and Pl, which segments the time-series into 4 clusters: P1 to Pm, Pm to Pn, Pn to Pl and Pl to P2.
3. FTDNN Using MATLAB
The algorithm for training and utilizing a Focused Time-Delay Neural Network (FTDNN) can be obtained from MathWorks’ Neural Network Toolbox [7] [8]. FTDNN was selected as the neural network of choice due to its speed relative to other forms of neural networks.
All values or names within <> braces are subject to change as per user specifi-cations.
Firstly, the cluster dataset has to be loaded and converted into a time sequence using the following commands:
load <data>
y = y(1:<size_integer>); y = con2seq(y);
The FTDNN is then created using the following commands, with the tapped delay lines, hidden layer neurons and number of epochs being variable depend-ing on optimal parameters:
<network_name> = newfftd(y,y,[1:<delays_integer>],<number_of_neurons_ integer>);
<network_name>.trainParam.show = <show(integer)>;
[image:3.595.250.503.569.722.2]<network_name>.trainParam.epochs = <number_of_epochs_integer>;
DOI: 10.4236/jcc.2018.612009 94 Journal of Computer and Communications The prediction begins on the value in the series after the delay, and the initial values in the delay are also required to be loaded:
p = y(<delays+1_integer>:end); t = y(<delays+1_integer>:end); i = y(1:<delays_integer>);
The network is then trained to perform one-step-ahead prediction: <network_name> = train(<network_name>,p,t,i);
The network is then ready for use through the calling of the network as a function:
<result> = <network_name>(<target>);
The resulting prediction can subsequently be converted for plotting: <result> = cell2mat(<result>);
plot(<result>);
4. Results
Using the PIP method described earlier, 3 points are obtained. Due to the recur-sive nature of the PIP algorithm, an odd number of points will always be ob-tained.
For this paper, all solar radiation data is obtained from the Geography Weather Station of the National University of Singapore.
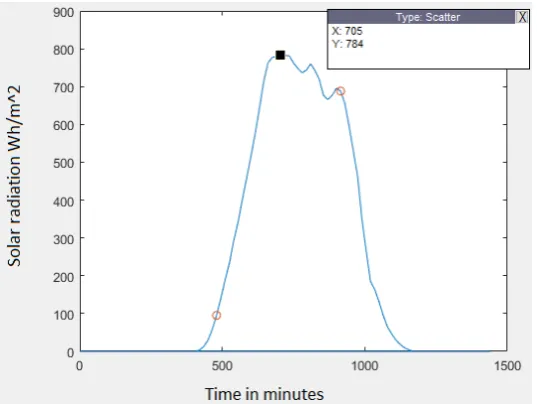
As shown in Figure 3, the point (705, 784) is seen to be a PIP, indicating a turning point in the graph. (705, 784) in the context of Figure 3 indicates that on the 705th minute of the day, there is an incoming solar energy of 784 WH/m2.
The first cluster is selected to be data from minute 405 to minute 705. The point at minute 480 is ignored to reduce the number of clusters due to the simi-larity in trend from the data prior to and after minute 480.
[image:4.595.240.509.506.708.2]The next 17 readings are used to form cluster 2, and the subsequent 20 read-ings are used to form cluster 3. Readread-ings before cluster 1 and after cluster 3 are
DOI: 10.4236/jcc.2018.612009 95 Journal of Computer and Communications ignored due to them being approximately zero, which are not required for use as training data as it indicates that there is no solar radiation incident during that period of time.
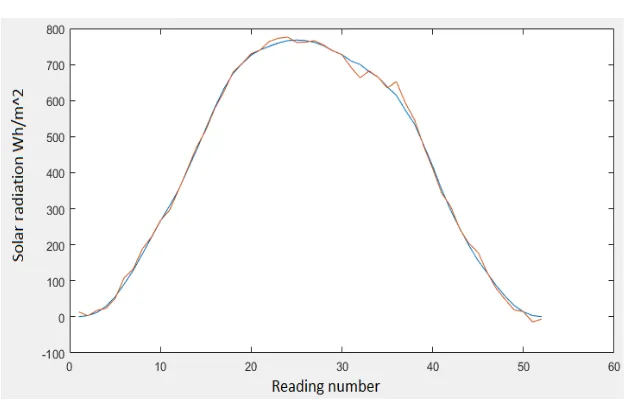
Figure 4 shows a visual representation of the actual data (blue) plot against the predicted data (orange). The data is obtained using 1 day of training data as inputs for the network, to predict a day’s worth of solar radiation. Visually, the two sets of data are shown to be fairly close.
Using MAPE [9], it can be observed that for most of the readings, the per-centage difference between the forecast and actual value are sub-10%, ignoring the values that are close to 0 due to the large deviation it causes in percentage errors when the values are small (Figure 5).
[image:5.595.263.483.279.454.2]Figure 6 shows the result of utilizing the FTDNN on all 3 clusters individu-ally, with 15 days of training data used as the input for each cluster.
[image:5.595.307.437.487.705.2]Figure 4. FTDNN on cluster 1.
DOI: 10.4236/jcc.2018.612009 96 Journal of Computer and Communications Figure 6. FTDNN on 3 clusters combined.
The resulting adjusted MAPE values of cluster 1, 2 and 3 are 3.890%, 4.129% and 1.180% respectively.
While MAPE is shown to not be entirely exact in portraying the accuracy of the prediction, it is sufficient to show a basic level of competency of the network in performing predictions.
5. Conclusions
In this paper, a system combining the use of data clustering and neural networks is proposed to optimize the prediction of solar radiation.
The paper provides a fundamental level of knowledge on Perceptually Impor-tant Points and the focused time-delay neural network that was used in the pro-ject.
The use of the methodologies discussed are not limited to the prediction of solar radiation, but can also be used in a more general case for other fields such as the prediction of stock market trends or water current strength for turbines.
Conflicts of Interest
The authors declare no conflicts of interest regarding the publication of this pa-per.
References
[1] Shafiee, S. and Topal, E. (2009) When Will Fossil Fuel Reserves Be Diminished? Energy Policy, 37, 181-189. https://doi.org/10.1016/j.enpol.2008.08.016
[2] Lewis, N.S. (2007) Toward Cost-Effective Solar Energy Use. Science, 315, 798-801.
https://doi.org/10.1126/science.1137014
Hei-DOI: 10.4236/jcc.2018.612009 97 Journal of Computer and Communications delberg. https://doi.org/10.1007/978-3-642-51175-2_24
[4] Haykin, S. (2009) Neural Networks and Learning Machines. Prentice Hall/Pearson, New York.
[5] Waibel, A., Hanazawa, T., Hinton, G., Shikano, K. and Lang, K. (1989) Phoneme Recognition Using Time Delay Neural Networks. IEEE Transactions on Acoustics, Speech and Signal Processing, 37, 328-339. https://doi.org/10.1109/29.21701
[6] Fu, T.C., Chung, F.L., Ng, V. and Luk, R. (2001) Evolutionary Segmentation of Fi-nancial Time Series into Subsequences. Proceedings of 2001 Congress on Evolu-tionary Computation, Seoul, 27-30 May 2001, 426-430.
[7] Miller, S. (2015) How to Build a Neural Network.
https://stevenmiller888.github.io/mind-how-to-build-a-neural-network/
[8] Mathworks (2017) Neural Network Toolbox (r2017b): Design Time Series Time-Delay Neural Networks.
https://www.mathworks.com/help/nnet/ug/design-time-series-time-delay-neural-n etworks.html
[9] Swamidass, P. (2000) MEAN ABSOLUTE PERCENTAGE ERROR (MAPE). Ency-clopedia of Production and Manufacturing Management. Springer, Boston, MA.