ISSN Online: 2169-2661 ISSN Print: 2169-2653
DOI: 10.4236/ojap.2018.74015 Dec. 25, 2018 298 Open Journal of Air Pollution
Analysis of Air Pollutants in Xiong’an New Area
Based on MATLAB Grey Model
Ying Xie
*, Wenjun Wang, Baochang Li, Zhiwei Zhao, Lei He
Baoding University, Baoding, China
Abstract
The purpose of this paper is to study the air pollutants in Xiong’an New Area based on MATLAB grey model [1]. From 2011 to 2016, the results of sulfur dioxide (SO2), nitrogen dioxide (NO2) and inhalable particulate matter (PM1O) detected at monitoring points in the three counties of Xiong’an were analyzed. According to the national environmental air quality standard [2], the air quality in Xiong’an New Area was reasonably evaluated based on grey model in MATLAB. Judging from the weight of pollution factors in the mod-el, sulfur dioxide (SO2) is the controlling factor of air quality in Xiong’an New Area, and the weight of nitrogen dioxide (NO2) gradually increases. The main sources of the three pollutants were obtained by comprehensive data analysis, and a grey model was established according to the mass concentration of the main air pollutants, and the grey forecasting model was tested. The experi-mental results show that the model can be effectively applied to the forecast-ing of ambient air quality. On this basis, the present situation of atmospheric environmental quality in Xiong’an New Area and suggestions for improve-ment are obtained.
Keywords
Xiong’an New Area, Air Pollution, Grey Model, Forecasting, Suggestion
1. Introduction
On April 1, 2017, the Central Committee of the Communist Party of China (CPC) and the State Council announced their decision to establish Xiong’an New Area in Hebei Province. Xiong’an New Area is located in the hinterland of Beijing, Tianjin and Hebei, with obvious geographical advantages. It is another New Area of national significance after Shenzhen Special Economic Zone and Pudong New Area in Shanghai. The key task of planning and building Xiong’an New Area is to relax the non-capital functions of Beijing, build a green and
intel-How to cite this paper: Xie, Y., Wang, W.J., Li, B.C., Zhao, Z.W. and He, L. (2018) Analysis of Air Pollutants in Xiong’an New Area Based on MATLAB Grey Model. Open Journal of Air Pollution, 7, 298-308.
https://doi.org/10.4236/ojap.2018.74015
Received: October 17, 2018 Accepted: December 22, 2018 Published: December 25, 2018
Copyright © 2018 by authors and Scientific Research Publishing Inc. This work is licensed under the Creative Commons Attribution International License (CC BY 4.0).
http://creativecommons.org/licenses/by/4.0/
DOI: 10.4236/ojap.2018.74015 299 Open Journal of Air Pollution ligent new city and create a beautiful ecological environment. Like other regions in Beijing, Tianjin and Hebei, the three counties in Xiong’an New Area have long been plagued by environmental pollution, especially atmospheric pollutants [3] [4] [5] [6].
The pollutants in the atmosphere are mainly composed of chemical pollutants and particulates, etc. In order to protect and improve the living environment of human beings, many domestic scholars have investigated the air pollution in ci-ties. The main pollutants in the atmosphere are atmospheric particulates, sulfur dioxide and nitrogen oxides [7] [8] [9] [10] [11]. According to the situation of urban air pollution, many experts consider and evaluate it from these three as-pects. At present, grey system theory has become an important forecasting me-thod, including decision-making, evaluation, planning and control, system anal-ysis and modeling. (Grey system theory is based on the concept of associative space, smooth discrete function and other concepts to define gray derivatives and gray differential equations, and then use discrete data columns to build dy-namic models in the form of differential equations, since this is the basic model of the intrinsic gray system, and the model is approximate Non-unique, so this model is a gray model, which is denoted as GM (Grey Model), that is, the gray model is generated by using discrete random numbers to become random, which is significantly weakened and more regular. A model of the equation form facilitates the study and description of its changing process.) In particular, it has a unique analysis and model building method, short time series of statistical data and incomplete information systems [12][13] [14]. Many researchers in China have established a grey system, and many doctors and researchers have applied the grey system to research [15] [16] [17] [18] [19].
There are few applications of the grey theoretical model in atmospheric envi-ronment prediction. Using the powerful matrix function of MATLAB, there are not many gray GM (1,1) model algorithms. (The gray model is generally ex-pressed as GM(n,x) model, which means that the x variables are modeled by n-order differential equations.) Based on the MATLAB grey GM (1,1) model, this paper theoretically predicts the concentration of atmospheric pollutants in Xiong’an New District.
2. Weighted Grey Relational Analysis Model of Urban Air
Pollution Index
Taking Xiong’an New Area as an example, the monitoring data of sulfur dioxide (SO2), nitrogen dioxide (NO2) and inhalable particulate matter (PM10) were mo-nitored at monitoring points in the three counties of Xiong’an from 2011 to 2016 [20] [21] [22]. According to the national environmental air quality standard, a weighted grey correlation analysis model is used to make a reasonable compre-hensive evaluation of the air quality in Xiong’an New Area.
2.1. Climatic Characteristics of Xiong’an New Area
He-DOI:10.4236/ojap.2018.74015 300 Open Journal of Air Pollution bei Province and some surrounding areas. Located in the hinterland of Beijing, Tianjin and Baoding, it has a temperate continental monsoon climate with dis-tinct seasons, drought and windy spring, hot and rainy summer, cool autumn, cold and less-snow winter. The average annual temperature is 11.7˚C, the high-est monthly (July) average temperature is 26˚C, and the lowhigh-est monthly (Janu-ary) average temperature is −4.9˚C with the annual sunlight of 2685 hours and an average annual rainfall of 551.5 mm, accounting for 80% from June to Sep-tember, and a frost-free period of 191 days a year.
2.2. Sources and Analysis Methods of Major Air Pollutants
This paper analyzes the air pollution from the three factors of civil heating, dust raising and industrial pollution in Xiong’an New Area [23] [24].
Analysis of civil heating factors: the civil heating season leads to a decrease in air quality and a higher concentration of sulfur dioxide. Coal burning directly leads to an increase in pollutant concentration. Civil heating is an important factor affecting air quality. The level of economic development in Xiong’an County is relatively low, with coal-fired heating in rural areas and coal-fired heating in some county residents [25].
Analysis of the factors of floating dust: Xiong’an New Area is a city with little rain in the north, and the concentration of inhalable particulate matters in the air is higher than that in coastal cities, thus affecting the air quality in Xiong’an New Area.
Analysis of industrial pollution factors: The three counties of Xiong’an take plastic packaging, latex products, leather shoes and non-ferrous metal processing industries as the main pillar enterprises, and the development of the enterprises has also brought serious air pollution to the local area [26] [27].
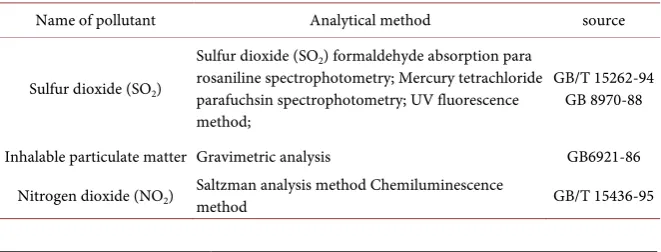
Refer to Table 1 for the sources and analysis methods of the major atmos-pheric pollutants sulfur dioxide, nitrogen dioxide and inhalable particulate mat-ters PM10.
[image:3.595.208.539.612.738.2]2.3. Monitoring Results of Concentration of Mainair Pollutants
The continuous monitoring data of air pollution monitoring in Xiong’an New Area (from the real-time air quality publishing platform of Hebei Environmental Monitoring Center Stationadopts the Dongyu 1000 series air quality automaticTable 1. Sources and Analysis methods of various pollutants.
Name of pollutant Analytical method source
Sulfur dioxide (SO2)
Sulfur dioxide (SO2) formaldehyde absorption para
rosaniline spectrophotometry; Mercury tetrachloride parafuchsin spectrophotometry; UV fluorescence method;
GB/T 15262-94 GB 8970-88
Inhalable particulate matter Gravimetric analysis GB6921-86
DOI: 10.4236/ojap.2018.74015 301 Open Journal of Air Pollution monitoring system. The main air pollutants are O3, PM2.5, PM10, SO2, NO2, CO, etc., and the main pollutants which have serious impact on air quality are selected for analysis and research. The data in this paper are based on the annual average of air pollutants SO2, NO2 and PM10 (as shown in Table 2) from 2011 to 2016.
2.4. Comprehensive Evaluation of Atmospheric Environmental
Quality
The evaluation criteria are listed in the National Air Quality Standard of the People’s Republic of China (GB 3095-1996) and revised in 2000 (refer to Table 3).
Weighting is determined by considering population factors and weight dis-tribution position. According to the condis-tribution rate of evaluation factors of each evaluation unit, the weight coefficient of each evaluation factor of the unit to be evaluated can be determined.
The formula is as follows:
i i
i
i i
x s x s α =
∑
(1)i
α —The weight coefficient of pollutant I;
i
s —Standard arithmetic mean of i pollutant concentration; i
x —The actual concentration value of pollutant i.
According to the formula, the weight of Xiong’an New Area in 2011-2016 is calculated (refer to Table 4).
Table 4 gives the values of the annual pollution weight factor ai. The weight calculation results show that SO2 and PM10 are the main pollutants affecting the air quality in Xiong’an New Area. The main pollutants each year are SO2 (2011), PM10 (2012), PM10 (2013) and SO2 (2014-2016). In recent years, air pollution in Xiong’an New Area has gradually changed from PM10 to SO2, but there is still a long way to go to reduce the impact of PM10 on the environment.
2.5. Evaluation Results of Weighted Grey Correlation
(
)(
)
(
)
(
)
1
2 2
1 1
n
i i
i
n n
i i
i i
x x y y r
x x y y
=
= =
− − =
− ⋅ −
∑
∑
∑
(2)xi, yi represent the actual value, the sequence of the fitted value, x, y represent the actual value and the average of the fitted values.
According to the above calculation method, the annual air quality calculation results are shown in Table 5.
The r1, r2 and r3 in Table 5 are the correlation coefficients of the theoretical data of SO2, NO2 and PM10 and the measured data.
DOI:10.4236/ojap.2018.74015 302 Open Journal of Air Pollution Table 2. Monitoring results of air pollutants in Xiong’an New Area.
Year SO2 (mg/m3) NO2 (mg/m3) PM10 (mg/m3)
2011 0.134 0.033 0.109
2012 0.137 0.039 0.107
2013 0.084 0.036 0.098
2014 0.079 0.025 0.109
2015 0.077 0.022 0.097
[image:5.595.208.541.245.328.2]2016 0.063 0.032 0.087
Table 3. Grading standards for atmospheric environmental quality.
Pollutant Sample time Limit concentration (mg/m
3)
Ⅰ level standard Ⅱ level standard Ⅲ level standard
SO2 Annual mean 0.04 0.10 0.15
NO2 Annual mean 0.04 0.08 0.08
PM10 Annual mean 0.02 0.06 0.10
Table 4. Weight calculation results.
Year Weight coefficient
SO2 NO2 PM10 Primary pollutant
2011 0.489 0.133 0.378 SO2
2012 0.520 0.133 0.347 PM10
2013 0.400 0.191 0.409 PM10
2014 0.452 0.167 0.381 SO2
2015 0.449 0.131 0.420 SO2
2016 0.427 0.185 0.387 SO2
Table 5. Results of comprehensive evaluation in recent years.
Year Correlation degree
r1 r2 r3 Quality level
2011 0.528 0.650 0.815 Ⅲ level
2012 0.433 0.502 0.347 Ⅲ level
2013 0.529 0.810 0.538 Ⅱ level
2014 0.137 0.623 0.090 Ⅱ level
2015 0.422 0.846 0.457 Ⅱ level
2016 0.467 0.816 0.439 Ⅱ level
[image:5.595.207.540.364.501.2] [image:5.595.206.541.532.668.2]posi-DOI: 10.4236/ojap.2018.74015 303 Open Journal of Air Pollution tive measures taken by the State Environmental Protection Administration in recent years. The advantage of grey correlation analysis is that it can sort the quality of analysis environment. According to the order from high to low, the air quality is the best in 2014, and the situation is worse from 2011 to 2016.
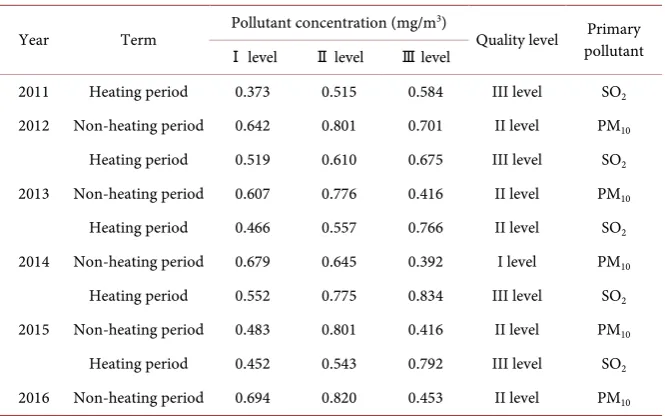
2.6. Evaluate According to the Season and Heating Cycle
Each year is divided into heating period and non-heating period. The non-heating period is from March 15 to November 15 of each year, and the heating period is from November 15 to March 15. The evaluation results are shown in Table 6.
Table 6 shows that the air quality in Xiong’an New Area is good during non-heating period, with PM10 as the main pollutant. The air quality is relatively poor during the heating period, and the main pollutant is sulfur dioxide. It can be seen that Xiong’an New Area is a coal-polluted city and needs to further con-trol coal pollution.
3. Forecast of Air Pollution in Xiong’an New Area Based on
Grey Model
3.1. Assumptions of Model
Other pollutants in the atmosphere within a reasonable range are ignored; Ignoring the error of data in the process of detecting pollutants;
Assuming no major natural disasters such as earthquakes, sandstorms and floods, the city’s natural environment will remain stable.
Assuming that no major industrial accident will occur in the past two years.
3.2. Establishment of Grey Forecasting Model
In order to ensure the consistency of the model parameter rate, the grey fore-casting system theory was used to select data from August 2016 to March 2017, and the mass concentrations of PM10, NO2 and SO2 were selected within 6 months. According to the previous analysis results, three grey forecasting mod-els of PM10, NO2 and SO2 in Xiong’an New Area are established respectively. The grey forecasting model is as follows:
( )
(
)
1 1
ˆk 5822.23exp 0.0376k 6277.38
χ + = − − + (1)
( )
(
)
1 1
ˆk 2823.35exp 0.0177k 4545.56
χ + = − − + (2)
( )
(
)
1 1
ˆk 822.67exp 0.0736k 678.34
χ + = − − + (3)
(1) grey forecasting models of PM10. (2) grey forecasting models of NO2. (3) grey forecasting models of SO2.
3.3. Test of Forecast Results
DOI:10.4236/ojap.2018.74015 304 Open Journal of Air Pollution Table 6. Comprehensive evaluation results for the whole year.
Year Term Pollutant concentration (mg/m
3)
Quality level pollutant Primary Ⅰ level Ⅱ level Ⅲ level
2011 Heating period 0.373 0.515 0.584 III level SO2
2012 Non-heating period 0.642 0.801 0.701 II level PM10
Heating period 0.519 0.610 0.675 III level SO2
2013 Non-heating period 0.607 0.776 0.416 II level PM10
Heating period 0.466 0.557 0.766 II level SO2
2014 Non-heating period 0.679 0.645 0.392 I level PM10
Heating period 0.552 0.775 0.834 III level SO2
2015 Non-heating period 0.483 0.801 0.416 II level PM10
Heating period 0.452 0.543 0.792 III level SO2
2016 Non-heating period 0.694 0.820 0.453 II level PM10
is calculated. (See Figure 1) The forecasted value of the grey model is taken as the input value, and the actual value is the output value. Iterate input and output values. The maximum number of cycles is set to 5000 and the initial step size is 0.0001 m.
The data processing shows that the experimental data and the theoretical data are basically fitted.
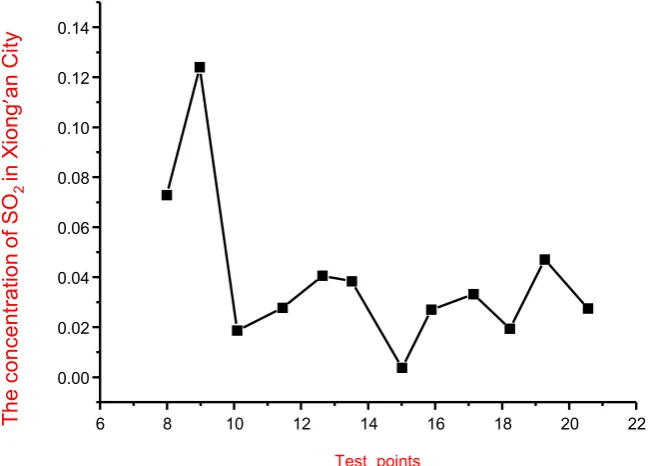
According to the formula of the grey forecasting model, PM10, NO2 and SO2 pollution in Xiong’an New Area (See Figure 2) will be obtained in the next 6 months, and the forecasting results of the grey forecasting model will be tested. The accuracy of the model was verified by residual error test and posterior error test. The results of the remaining tests are shown in Table 7.
4. Conclusion
Through the study of the air environmental quality in Xiong’an New Area from 2011 to 2016, it is found that the air environmental quality in the New District has greatly improved in the past six years, and the air environmental quality reached the III level in 2011 and 2012. Since 2013, the environmental quality has been maintained at II level, meeting the national requirements. However, the environmental quality is still in a state of constant repetition and it is necessary to continue efforts. Secondly, the grey correlation method is used to comprehen-sively analyze the air environmental quality in Xiong’an New Area. The results are in line with the actual situation and reach the expected evaluation results [28] [29] [30]. The grey correlation method is applicable to the comprehensive evaluation of Xiong’an New Area’s air environment.
5. Suggests
DOI: 10.4236/ojap.2018.74015 305 Open Journal of Air Pollution Figure 1. Forecasting of SO2 Concentration in Xiong’an New Area from August 2016 to
[image:8.595.210.535.345.578.2]March 2017.
Figure 2. Forecasting of SO2 mass concentration in Xiong’an New Area.
Table 7. The results of residual error test and posterior error test.
Time SO2
Monitoring value Forecasted value Residual error Relative error (%)
2016.08 86.53 61.0388 −18.88676 18.43
2016.10 100.61 121.1906 14.10033 17.24
2016.12 189.53 139.7011 17.14607 7.79
2017.02 237.36 185.6357 10.16509 21.79
4 6 8 10 12 14 16 18 20
60 80 100 120 140 160 180 200 220 240
SO
2
conc
ent
rat
ion
Test points
forecast result
results of testing
(g
.cm
-3)
6 8 10 12 14 16 18 20 22 0.00
0.02 0.04 0.06 0.08 0.10 0.12 0.14
Test points
The
conc
ent
rat
ion of
SO
2
in
Xi
ong
’
an
Ci
[image:8.595.208.540.630.725.2]DOI:10.4236/ojap.2018.74015 306 Open Journal of Air Pollution effectively crack the restrictive factors affecting environmental pollution, which requires that the industrial emission standards of enterprises settled in Xiong’an New Area should reach the international level, while the existing industrial standards in China are low and slow to update, and new standards are urgently needed. Based on the understanding of the surrounding environment of the New District, it is suggested that some teachers and scientific research departments in colleges and universities in the province may participate in the drafting of the standards.
Conflicts of Interest
The authors declare no conflicts of interest regarding the publication of this paper.
References
[1] Liang, W., Du, Y.X. and Hua, W.L. (2017) Application Research of Grey GM(1,1) Model Based on Matlab. Journal of Suzhou University, 32, 92-93.
[2] AmbientAirQualityStandards (2012).
[3] Cheng, N.L., Zhang, D.W., Li, Y.T., Chen, T., Li, J.X., Dong, X., et al. (2015) Analy-sis about Spatial and Temporal Distribution of so2 and an Ambient so2 Pollution Process in Beijing during 2000-2014. Huan Jing Ke Xue, 36, 3961-3971.
[4] Du, W., Zhao, J., Wang, Y.Y., et al. (2017) Simultaneous Measurements of Particle Number Size Distributions at Ground Level and 260 m on a Meteorological Tower in Urban Beijing, China. Atmospheric Chemistry & Physics, 17, 6797-6811. https://doi.org/10.5194/acp-17-6797-2017
[5] Dong, J.Y., Liu, X.R., Zhang, B.Z., et al. (2015) Correlation Analysis between At-mospheric Relative Humidity and PM10 Concentration and AtAt-mospheric Visibility in Lanzhou City. Chinese Journal of Ecology and Environment, 24, 1995-2001. [6] He, K.B., Jia, Y.X., Ma, Y.L., et al. (2009) The Regional Nature of Atmospheric
Par-ticulate Matter Pollution in Beijing. Journal of Environmental Science, 29, 482-487. [7] Li, Y.T., Cheng, N.L., Zhang, D.W., et al. (2015) Study on PM2.5 Background
Con-centration in Different Orientations in Beijing in 2013. Environmental Science, 36, 4331-4339.
[8] Liu, J., Zhang, X.-L., Xu, X.-F., et al. (2008) Suburban Contrast Analysis of the Vari-ation Characteristics of SO2, NOx, O3 and PM2.5 in Beijing Area. Environmental
Science, 29, 1059-1065.
[9] Wang, L.-L., Wang, Y.-S., Ji, D.-S., et al. (2011) Characteristics of Air Pollution in Autumn and Winter in Tianjin Binhai New Area. China Environmental Science, 31, 1077-1086.
[10] Wang, W., Tang, S., Liu, H.J., et al. (2000) Study on Pollution Status and Pollution Characteristics of PM2.5 in China. Journal of Environmental Science, 13, 1-5. [11] Liu, H.M., Fang, C.L., Huang, J.J., et al. (2018) Analysis of Temporal and Spatial
Characteristics and Influencing Factors of Atmospheric Pollution in Bei-jing-Tianjin-Hebei Urban Agglomeration. Acta Geographica Sinica, 1, 177-191. [12] Gu, W., Sun, Z., Wei, X. and Dai, H. (2014) A New Method of Accelerated Life
Testing Based on the Grey System Theory for a Model-Based Lithium-Ion Battery Life Evaluation System. Journal of Power Sources, 267, 366-379.
DOI: 10.4236/ojap.2018.74015 307 Open Journal of Air Pollution [13] Gupta, G.P., Kumar, B. and Kulshrestha, U.C. (2016) Impact and Pollution Indices of Urban Dust on Selected Plant Species for Green Belt Development: Mitigation of the Air Pollution in Ncr Delhi, india. Arabian Journal of Geosciences, 9, 136. https://doi.org/10.1007/s12517-015-2226-4
[14] Li, G.D., Masuda, S. and Nagai, M. (2015) Predictor Design Using an Improved Grey Model in Control Systems. International Journal of Computer Integrated Manufacturing, 28, 297-306. https://doi.org/10.1080/0951192X.2014.880801 [15] Kadiyala, A. and Kumar (2012) A Vector Time Series Models for Prediction of Air
Quality Inside a Public Transportation Bus Using Available Software. Environmen-tal Progress & Sustainable Energy, 31, 494-499. https://doi.org/10.1002/ep.11708 [16] Moazami, S., Noori, R., Amiri, B.J., Yeganeh, B., Partani, S. and Safavi, S. (2016)
Re-liable Prediction of Carbon Monoxide Using Developed Support Vector Machine. Atmospheric Pollution Research, 7, 412-418.
https://doi.org/10.1016/j.apr.2015.10.022
[17] Peng, Z.R., Wang, D.S., Wang, Z.Y., et al. (2015) A Study of Vertical Distribution Patterns of PM2.5, Concentrations Based on Ambient Monitoring with Unmanned Aerial Vehicles: A Case in Hangzhou, China. Atmospheric Environment, 123, 357-369.
[18] Ogunkunle, C.O., Suleiman, L.B., Oyedeji, S., Awotoye, O.O. and Fatoba, P.O. (2015) Assessing the Air Pollution Tolerance Index and Anticipated Performance Index of Some Tree Species for Biomonitoring Environmental Health. Agroforestry Systems, 89, 447-454.https://doi.org/10.1007/s10457-014-9781-7
[19] Shi, G.M., Wang, J.N., Fu, F. and Xue, W.B. (2016) A Study on Transboundary Air Pollution Based on a Game Theory Model: Cases of So 2, Emission Reductions in the Cities of Changsha, Zhuzhou and Xiangtan in China. Atmospheric Pollution Research, 8, 244-252.https://doi.org/10.1016/j.apr.2016.09.003
[20] Ministry of Environmental Protection, State Administration of Quality Supervision, Inspection and Quarantine (2012) GB3095-2012, Ambient Air Quality Standards. China Environmental Science Press, Beijing.
[21] Ministry of Environmental Protection (2012) HJ633-2012, Environmental Air Quality Index (AQI) Technical Regulations (Trial). China Environmental Science Press, Beijing.
[22] Ministry of Environmental Protection (2013) HJ633-2013, Technical Specifications for Environmental Air Quality Assessment (Trial). China Environmental Science Press, Beijing.
[23] Meng, R. (2018) Analysis of Regional Characteristics of Air Pollution in Hebei Province. Environmentally Friendly Building Materials, No. 4, 47.
[24] Pei, B., Xue, Y., Zhong, L., et al. (2017) Emission Characteristics and Control Countermeasures of Coal-Fired Air Pollution in Beijing-Tianjin-Hebei Residents. Environmental Protection, No. 21, 27-31.
[25] Jia, W., Wang, W., Chen, Y., et al. (2010) Effects of Dust Aerosols on Cloud Radia-tion Forcing in North China. China Environmental Science, 30, 1009-1014. [26] Peng, X. (2018) Study on the Variation Law and Influencing Factors of Air
Pollu-tion in Beijing-Tianjin-Hebei Region. China University of Geosciences, Beijing. [27] Wu, J., Wang, W., Li, K., et al. (2017) Comparison of Spatial Differentiation
Simu-lation Models of PM2.5 Concentration: Taking the Beijing-Tianjin-Hebei Region as an Example. Environmental Science, No. 6, 2191-2201
Particu-DOI:10.4236/ojap.2018.74015 308 Open Journal of Air Pollution late Matter Pollution and Death from Cardiovascular Disease. China Environmental Science, 27, 657-660.
[29] Li, Z. (2018) Environmental Monitoring Analysis and Countermeasures for Air Pollution Problems. Environment and Development, No. 4, 184-186.