Odour Removal in Leather Tannery
Rames C. Panda1,2*, Chokalingam Lajpathi Rai1, Venkatasubramaniam Sivakumar1, Asit Baran Mandal1
1Central Leather Research Institute (CSIR), Adyar, India
2Department of Chemical Engineering, Curtin University of Technology, Perth, Australia
Email: *[email protected]
Received February 10,2011; revised November 25, 2011; accepted December 29,2011
ABSTRACT
Toxic odour causes pollution to environment. Removal of odour from wet processing sections of leather tanneries is important to preserve safety and occupational health. Such odour causing gases are identified in nature and are identi-fied mostly as ammonia, Hydrogen sulfide and Volatile organic compounds. These gases, evolving from tanning drums, were experimentally quantified and analysed. Techniques for the abatement of odorous gases are designed using chemical methods. Scrubbing towers based on absorption of gases by liquid are designed and fabricated to evaluate the performance of the system in laboratory scale. Those gases were reduced in the concentration by absorbing through the packed bed vapour phase absorption using the activated carbon as the adsorbent. Results are helpful to conclude that the absorption technique presented here to reduce these toxic emission loads, seems to be simpler and economically cheaper.
Keywords: Odour; Packed Tower; Absorbtion; Tannery; Pollution
1. Introduction
During the last two decades, cleaner production and pol-lution abatement have been developed which have made it possible to reduce the pollution load from tanneries. There are many techniques available (Riffenburg and Alison, 1941; IULTCS, 2008) [1,2] for treatment of wastewater. But less number of research are reported on pollution through air emission that give rises to bad odor and causes problem to occupational safety of the workers in Tannery. Hence the purpose of this work is to high-light sources of odor and to suggest techniques of their removal. In pre-tanning section of leather processing H2S and NH3 and VOC are evolved from process and cause bad odor. From putrefying hides also bad odor comes out. Other sources are from chemical storage in tannery (HCHO, CH4 etc. gases comes out) and some organic foul gases form hides/skins during processing. In tannery, these gases either partly dissolved in process liquor, giv-ing rise to odor or mix with air inside (tannery) and pro-duces bad odor. In the latter case, biofilters, bioscrubbers, activated sludge scrubbers, trickling filter scrubbers, and reactive chemicals are available to suck and remove these bad odorous gases. But in the earlier case, suitable technology must be developed which is the objective of this paper. These emissions from tannery or effluent treatment plant, generally pollute the air, soil, surface water and underground water, causing serious health problems because they lie within and around residential
areas. Respiratory disorders, diarrhea, dysentery and ty-phoid are the most serious illnesses among the commu-nity. The limiting steps for removal of ammonia—ni- trogen and hydrogen sulphide are studied in production of wet blue hides.
2. Sources of Gases
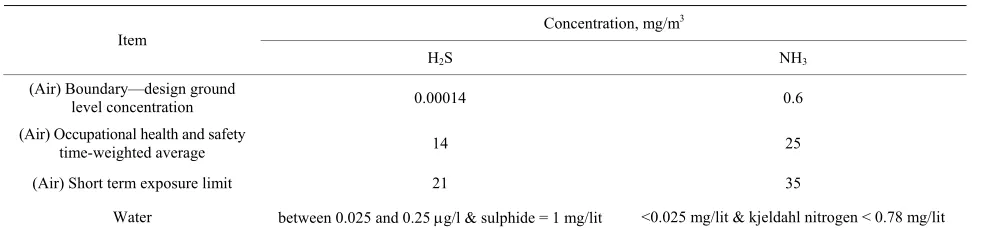
As mentioned earlier, the main constituents of odourous gases in tannery are VOC’s (evolving during the action of enzymes causes decomposition and oxidation of the hides and skin), NH3 and H2S (evolving during the un-hairing and deliming process of tanning in the processing of leather). Out of these the NH3 and H2S both are toxic gases which are the responsible for the odour in the tan-nery. The NH3 having strong pungent and H2S having fouling smell both giving a odour in and around the tan-nery environment. From Zahn et al. (2001) [3] it is found that a typical tannery will have VOC—100 ppm, NH3— 40 ppm and H2S—30 ppm. Based on these loads, this work designs scrubbing systems for abatement of these toxic gases. According to ASTM standards the limits of these gases in air should be given by Table 1.
3. Methods of Removal
Different methods of removal of NH3 and H2S are avail-able: they are generally: addition of Chemical Reagents, Passing Compressed Air, Ozone Oxidation, Biochemical
ethod.
Table 1. Air/water discharges, odor and exposure standards.
Concentration, mg/m3
Item
H2S NH3
(Air) Boundary—design ground
level concentration 0.00014 0.6
(Air) Occupational health and safety
time-weighted average 14 25
(Air) Short term exposure limit 21 35
Water between 0.025 and 0.25 g/l & sulphide = 1 mg/lit <0.025 mg/lit & kjeldahl nitrogen < 0.78 mg/lit
3.1. Removal of Odor from Process Liquor
Different methods of removal of NH3 and H2S are stud-ied: They are generally:
1) Addition of Chemical Reagents; 2) Passing Compressed Air; 3) Ozone Oxidation;
4) Passing air in counter current to liquor in a packed (activated carbon) bed;
5) Biochemical and Biological methods.
Out of the above mentioned methods, the 4th one is economic and industrially feasible. Hence, trial is under-taken to study parametric effects on performance of re-moval of gases and design scale up.
3.2. Passing Compressed Air & Physical Absorption by Activated Charcoal
This method is developed at Bench Scale laboratory of Chemical Engg Dept, CLRI, Chennai, India, after many experimental trials. As packing material, charcoal bed is used. Samples of tannery wastewater are collected from different region and from different tanning sectors to analyze sulphide and nitrogen contents in them. Methods of removal of these odor-sources by means of adding reactive-chemicals or passing compressed air or adsorp-tion by activated charcoal, are studied and discussed. Engineering design aspects of the proposed devices (CSTR/Packed Bed) are discussed. The odor removal process is made continuous by designing and employing a flow controller by adjusting flow rate of air passing through the float in a cstr/packed bed.
3.2.1. Experimental Setup
For the quantitative analysis the simpler and suitable setup was made. A column taken with the passage was taken. A fresh grade of Activated Carbon is being packed into that column up to the required height of the column. A pressure gauge meter is fixed across the height of the bed to calculate the pressure crop across the total bed height. The outlet of the column, i.e., exit of the air from
column is made to collect in the sample collector for the detection and analysis. A two Round Bottomed flask
were made mounted with the flow controller is attached to the bottom of column. From this the gas was produced artificially and passed through the bed. The experiment was conducted with analysis of two such gases, i.e., NH3
and H2S.
3.2.1.1. For Ammonia (NH3)
The gas is artificially produced by means of heating up of the Ammonium hydroxide (NH4OH) liquid at the de-sired concentration. It was made pass through the bed and collected out in the 3% of 50 cc of cold Boric acid solution. All the NH3 gases passes out are caught up in the boric acid solution and the amount of ammonia in the collection sample is determined by quantitatively.
3.2.1.2. For Hydrogen Sulfide (H2S)
The gas is produced artificially by means of heating up of the Na2S solution of desired concentration with the Hydrochloric acid (HCl) it produces the H2S gas as
H2S + 2NaOH NaHS + H2O NaOH + NaHS Na2S + 2H2O
The collected Na2S product can be determined by quantitatively. In both the cases, the experiment was car-ried out in the different concentration and different tem-perature. The corresponding pressure drop at each case was recovered for the detection of respective quantity of gas. The time of exposure or passage through the bed was kept constant for all the cases to determine consis-tency at a temperature for all the cases.
3.2.2. Quantitative Analysis of the Gases
3.2.2.1. For NH3
The collected NH3 in the boric acid solution is shaken well colded up and then it is titrated against the N/10 HCl with phenolphthalein as indicator. From this the amount of concentration of NH3 collected can be obtained.
3.2.2.2. For H2S
Na2S + ZnSO4 ZnS + Na2SO4The end point is ascertained by spotting on to the dry filter paper previously impregnated with 10% lead ace-tate solution and the end point is reached when no imme-diate brown stain is visible due to conversion of all sul-fides into zinc sulfate as the above equation.
In this case, removal efficiency is observed as 83%. A mathematical program was written to evaluate the proc-ess performance. The comprehensive procedure for ana- lysis of design can be given as below:
3.2.3. Procedure
The steps for the process design are: 1) Set on analysers (NH3 and H2S);
2) Open air inlet valve (feed is air + NH3 + H2S mixed) that comes out from factory;
3) Observe rotameter reading (about 20 psig). Air feeding rate is in gmol/min;
4) Set desired air flow, water or liquid flow rates and connect analyzers to effluent gas stream. Record rotame-ter readings when it comes to steady state (generally it takes 5 mins);
5) Read pressure drop across the column; 6) Calculate NTU and HTU;
7) Change the flow rates and observe the readings by repeating above steps.
4. Mathematical Development
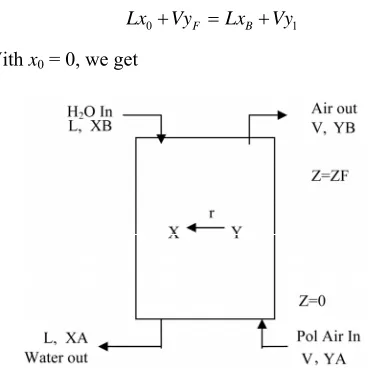
The schematic of gas absorption is shown in Figure 1. The odor gas flows from bottom to top of tower while liquid flows down from top to bottom of the packed column in counter-current.
Material Balance:
Gas Feed = (Air + NH3 + H2S) Liquid Feed = Water Counter current
Gas Phase:
0 F LxB Vy1
Lx Vy (1)
[image:3.595.75.260.532.716.2]With x0 = 0, we get
Figure 1. Schematic of gas absorption tower.
1
B F
x V L y y
*r k y y x
(2)
Here V = vapor rate in g/min and L = Liquid rate in
g/min.
We consider that the air (flow rate, V gmol/min)
car-rying the emitted gas stream enters the column of height z and diam D where it is scrubbed with water (flow rate
= L gmol/min) in counter current. The rate of mass
transfer is given by Where y and x
are gas and liquid phase concentrations in mole fraction
y*(x) is gas phase concentration equilibrium with liquid
and can be evaluated by seeing VLE data. k is mass
transfer coefficient. At steady state, gas phase and liquid phase transfers become equal and we get,
*
dd
y
k V y y
z (3)
Integrating from z = 0 to z = zF we get
* dA
B y F
y
k y
z
V
yy x (4)= resistance to mass transfer. As the driving force (y− y*(x)) becomes less and less, the integral becomes larger
and larger, thus, indicating the Number of Transfer Units (NTU) becoming more and more. It is necessary to know
x(y) and y*(x(y)) to evaluate the integral.
The Operating Line:
B B
Lx VyLx Vy or x
V L
yyB
(5)With xB = 0, the integrand reduces to
*
1
B
yy V L yy
* H
y K x
(6)
which can be evaluated in terms of y if y*(x) is known.
Generally, from VLE relationship we know,
(7)
where KH is called Henry’s Law constant. Thus it is
pos-sible to find an analytical solution for the integrand and NTU and HTU can be calculated.
5. Results and Discussion
The experimental data and readings are collected and analysed that resulted information given in Table 2. The molecules of the contaminated gas attracter to and accu-mulate on the surface of the activated carbon. Almost of the surface area available o the internal part structure and the adsorption depend on the pore volume and pore dis-tribution. The amount of adsorption is totally dependent on the total surface area of the activated carbon.
Table 2. (a) Performance analysis from experimental stud-ies of removal of odorous gases Time = 20 mins: Tempera-ture = 40˚C; (b) Performance analysis from experimental studies of removal of odorous gases Temperature = 40˚C; (c) Performance analysis from experimental studies of removal of odorous gases Temperature = 45˚C.
71 71.5 72 72.5 73 73.5
0 500 1000 1500
% abatement (NH3) Vs load (ppm)
(a)
Ammonia (ppm) Pressure Drop % Abatement
800 10.791 73.2
900 15.6 72.1
1000 19.6 71.3
Hydrogen Sulfide (ppm) Pressure Drop % Abatement
200 9.8 70.6
300 10.8 68.7
400 12.7 67
NH3load, ppm
(b)
Ammonia (ppm) Pressure Drop % Abatement
800 25.5 72.40
900 19.6 70.8
1000 12.7 69.8
Hydrogen Sulfide (ppm) Pressure Drop % Abatement
200 10.8 69.5
300 12.5 68.1
400 14.7 66.7
(c)
Ammonia (ppm) Pressure Drop % Abatement
800 17.6 72.6
900 24.5 71.1
1000 30.4 69.2
Hydrogen Sulfide (ppm) Pressure Drop % Abatement
200 12.75 69
300 14.7 67.5
400 17.6 65.3
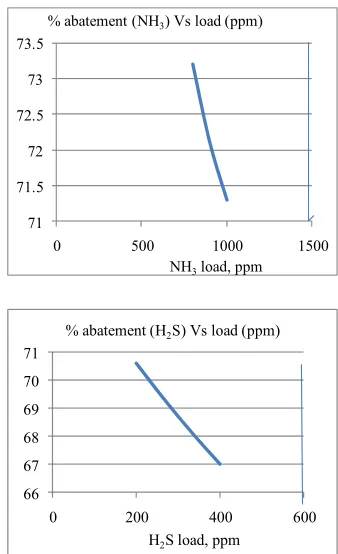
70.5% of H2S from the odourous gas stream having a load of 800 ppm NH3 and 200 ppm H2S respectively. With increase in load the efficiency goes down.
The removal efficiency can be increased to 90% by re- cycling and by intensify driving forces. It is predicted
66 67 68 69 70 71
0 200 400 600
% abatement (H2S) Vs load (ppm)
H2S load, ppm
[image:4.595.337.506.84.361.2]
Figure 2. Performance of packed towers (removal efficiency of NH3 and H2S) at 40˚C.
that by increasing number of horizontal partition/seg- ments in the packed region, residence time of gases can be increased and thereby removal efficiency can be im- proved.
6. Design of Column
The adsorption system is a simple one to design and it is made of a containment device, distribution and collection device to effect proper circulation of the gas stream through the activated carbon bed and a means for moving the gas stream through bed by using device like fan, blower or dispenser etc. The activated carbon bed can be conveniently configured into small drums or tanks de-pend on the size and application to the tannery. The su-perficial velocity Vs in ft/min is given by Vs = 48 (f− 1)/f
where f = 1.2 (approx) and Actual gas flow rate, Qa
can be calculated as: 19.63 459 14.2
f a
Q T C
Q
P
where
Q is gas folw rate in mmscfd, T is temperature in F, P is
pressure in psig and Cf is compressibility factor, 0.95.
After finding out Qa, the column size can be determined
ID = (A/0.7854)0.5 ft. The sizing for the application
[image:4.595.59.287.165.660.2]p
surface area. The design includes the simple vessel or containment that can hold up the activated carbon.
6.1. Reactivation and Regeneration
Once the activated carbon is being used it has become saturated and therefore the adsorption decreases. In order to maintain the efficiency the activated carbon must be replaced with the fresh one after the every service of abatement. The carbon can be reactivated and regener-ated by number of methods. The best method is washing the activated carbon in hot water and then dried off. It can be reused for the further process of adsorption.
The design calculations for the absorption tower is gi- ven as follows.
6.2. Calculations: Packed Tower Absorption Column
Data: Air flow rate = 7 cu ft/min Temperature = 70 F,
Pressure = 1 atm
Water flow rate = 500 ml/min
xB = 0
NH3 in air feed = 20,000 ppm H2S in air feed = 1000 ppm NH3 in air exit = 250 ppm H2S in air exit = 5 ppm
V = 7(cu ft/min)(28.32 L/ft3)(gmol/22.4 L)(492/530)
= 8.125 gmol/min
L = 500(ml/min)(1 g/ml)(1 gmol/ 18 gm)
= 27.8 gmol/min
yA1 = (20,000/17)/(1,000,000/29) = 0.034
yA2 = (1000/34)/(1,000,000/29) = 0.0034
yB1 = (250/17)/(1,000,000/29) = 0.00043
yB2 = (05/34)/(1,000,000/29) = 0.0000172
Equilibrium data: From Perry Handbook,
3 NH
psia = 0.047/14.7 =0.0319 mole fraction NH3 and 98.15/101.325 = 0.968 mole frac H2S
over 0.05 mole fraction aq NH3 = 0.047
For NH3: KH = y/x = 0.0319/0.050 = 0.638
For H2S: KH = y/x = 0.968/0.050 = 0.099
Operating Line:
*
0.296 0 and
0.638(0.296 0.818 0.00
B
H
x V L y y y
y y y K x
y
.00043
0.00043) 0274
y y
0.034
* 0.00042
dy 4.70223 NTU
y y x
(8)It also looks into the possibility of the usage of con-trollers for effective treatment process. With variation of process recipe and quality of hides, sulphide content of process liquor may vary at the exit. Hence to balance the load changes, an air flow controller is necessary. Ac-cordingly, air flow rate is controlled/adjusted to maintain the emission standards.
7. Conclusion
Chemical engineering methods are used to reduce odou- rous gas loading from leather industry. From the above study it was clear that the adsorption of the toxic gases such as ammonia and H2S are quantitatively reduced by passing through vapour phase adsorption. Here it was concluded that the application of the vapour phase ad-sorber with activated carbon would become the simple and economically cheaper in all the aspects from the in-stallation to the running. And also it was clear that this method would give the better results in the reduction of odour in the effluent. This could be a better method if implemented in the end process of the effluent treatment to reduce the concentration of the contaminants and thus helpful for reducing pollution and global warming.
8. Acknowledgments
The authors are willing to acknowledge the help from network project (NWP-044) to carry-out the experiments.
REFERENCES
[1] IULTCS, “IUE-8: Recommendations for Odor Control in Tanneries,” 2008.
http://www.iultcs.org/pdf/IUE8_2008.pdf
[2] H. B. Riffenburg and W. W. Alison, “Treatment of Tan-nery Wastes with Flue Gas and Lime,” Industrial & En-gineering Chemistry Research, Vol. 33, No. 6, 1941, pp. 801-803. doi:10.1021/ie50378a026