Social and economic changes in the czech republic after 1989 have influenced the demographic devel-opment significantly. They have brought about and speeded up the transformation from the Eastern-European standard to the demographic development typical for Western Europe with all its pluses and
mi-nuses. one of the main negative aspects is the ageing of population caused mainly by the decrease of the birth-rate and longer lifespan of people. According to (Mašková 1993), the process of ageing when the growth of the youngest generation slowed down has been replaced by the lower death-rate in the old age
Age of population and the development of population
ageing in the regions of the Czech Republic
Stáří populace a vývoj jejího stárnutí v krajích České republiky
J. Dufek, B. Minařík
Faculty of Regional Development and International Studies, Mendel University
of Agriculture and Forestry. Brno, Czech Republic
Abstract: The process of ageing of the population is one of the negative demographic phenomena of the developed count-ries’ population. The basic reasons are the decrease of the birth-rate and a longer lifespan of people. These trends can also be seen in the czech republic on the state as well as the regional levels. our contribution wants to analyze the differences in the age of population and the rapidity of the ageing process in the particular czech regions. The database of the analysis comes from 12 selected demographic indicators related to the ageing process in the period 1998–2007. Based on the factor analysis, out of 12 indicators, we chose the ageing index and the ratio of productive population, where by the means of cluster analysis, we created groups of regions with the similar age of population as of 1st December 2007 and the similar
rapidity of ageing process in the period 1998–2007. The graphs showing the regions by the level reached by the indicator and the respective average growth coefficient are included in the contribution. The analysis concludes by setting the order of regions by the age of their population and the rapidity of the ageing process independently as well as by the age and the process of ageing together.
Key words: regions of the czech republic, age and process of ageing of population, factor analysis, cluster analysis, order of regions
Abstrakt: Stárnutí populace je jedním z negativních demografických jevů ve vyspělých zemích. základními příčinami jsou pokles porodnosti a prodlužující se střední délka života obyvatel. Uvedené trendy se projevují i v České republice, a to jak na celostátní, tak i na regionální úrovni. Příspěvek si klade za cíl posoudit a analyzovat rozdíly ve stáří a rychlosti stárnutí populace v jednotlivých krajích. Datová základna pro analýzu vychází z vybraných 12 demografických ukazatelů souvi-sejících s procesem stárnutí a vztahujících se k období let 1998–2007. na základě faktorové analýzy byly z 12 ukazatelů vybrány index stáří a podíl produktivní populace, podle nichž byly prostřednictvím shlukové analýzy vytvořeny skupiny krajů o podobné úrovni stáří obyvatel k 31. 12. 2007, respektive o podobné rychlosti stárnutí v období 1998–2007. Pro zmíněné dva ukazatele byly zpracovány grafy znázorňující rozdělení krajů podle dosahované úrovně ukazatele a přísluš-ného průměrpřísluš-ného koeficientu růstu. završením analýzy je stanovení pořadí krajů, a to jak samostatně podle úrovně stáří populace a podle rychlosti jejího stárnutí, tak i podle stáří a stárnutí populace společně.
Klíčová slova: kraje České republiky, stáří a stárnutí populace, faktorová analýza, shluková analýza, pořadí krajů
groups of people which, consequently, has caused the longer lifespan of population. it means that the type of ageing on the top of the pyramid has been gradually prevailing.
The prognoses show that the process of ageing will accelerate in the future as a result of the increase of the ratio of the post-productive population which will bring about the change in the structure of the post-productive population. relatively the fastest growth is expected in the group of people over 75 years of age and thus its importance will grow as well.
Logically, the process of ageing is obvious on the state as well as the regional levels. it is therefore necessary to make a regional analysis of the age level, regional differences and the changes brought about by the evolution. The changes in the age structure are caused by the birth and death rates on both state and regional levels. in some regions, the migration may be of certain importance, particularly when people in the productive age move into the region.
The aim of this contribution is to judge the situ-ation related to the age level of the czech regional population aimed at the analysis of regional age dif-ferences and time-related changes characteristic for their direction and intensity. it is an assessment of the age of the regional population, judgment of the rapidity of the ageing process and consequently the quantification of the inter-regional differences and
setting the order of regions from the age and ageing points of view.
MATERIAL AND METHODS
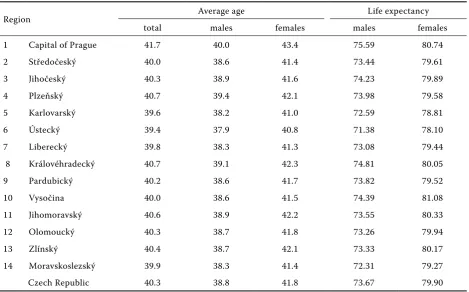
The starting data and figures included in Table 1 and Table 2 were obtained from the web pages of the czech Statistical office. These are absolute numbers of population by the age groups, average age, and life expectancy.
The tables contain the data as of 31st December
2007, according to which the age of the population in the particular regions of the czech republic was assessed. The same data were obtained at the end of the researched period of time – 1998–2007, which enabled the assessment of the development of the age structure i.e. here the process of ageing of the population.
[image:2.595.65.535.476.766.2]For the data analysis, we used the methodology for computation of the coefficients of workload of the productive population, the ageing index and the whole range of statistic analyses, namely the basic, one-dimensional characteristics of the selected de-mographic indicators (variables), standardized values, mean coefficients of growth, factor analysis, cluster analysis and the methods of multi-criteria setting of the order of units.
Table 1. Age structure of people in czech regions as of 31st December 2007
region Total population Population in the specified age groups
0–14 15–64 65+
1 capital of Prague 1 212 097 146 466 876 107 189 524
2 Středočeský 1 201 827 178 189 853 824 169 814
3 Jihočeský 633 264 91 545 449 999 91 720
4 Plzeňský 561 074 78 533 398 284 84 257
5 Karlovarský 307 449 45 168 221 243 41 038
6 Ústecký 831 180 127 148 595 938 108 094
7 Liberecký 433 948 64 489 310 659 58 800
8 Královéhradecký 552 212 79 367 388 608 84 237
9 Pardubický 511 400 75 354 360 216 75 830
10 Vysočina 513 677 75 902 361 414 76 361
11 Jihomoravský 1 140 534 159 102 808 105 173 327
12 olomoucký 641 791 91 434 455 756 94 601
13 zlínský 590 780 83 323 418 108 89 349
14 Moravskoslezský 1 249 897 180 903 893 112 175 882
RESULTS AND DISCUSSION
The assessment of the age structure of people ac-cording to (Kovář and Říhánek 1995) and other demo-graphic experts is usually represented by the relative expression, i.e. the ratios of three basic age groups. The quantification of the workload of productive population conditions the necessity of derivation of the particular coefficients of dependency and ageing index. The ratios and coefficients for the czech regions are in Table 3. They were calculated as follows:
Youth dependency coefficient:
100 ) 64 15 ( ) 14 0 ( ) ( u P P y D C
old age dependency coefficient:
100 ) 64 15 ( ) 65 ( ) old ( u P P D C
overall dependency coefficient:
100 ) 64 15 ( ) 65 ( ) 14 0 ( ) ov ( u P P P D C Ageing index: 100 ) 14 0 ( ) 65 ( u P P Age I
The capital of Prague has shown the lowest ratio of the pre-productive population (12.8%) while the Ústecký region has shown the highest ratio (13.00%). The post-productive population shows the opposite trend – the lowest value was reached in the Ústecký region (13.00 %) while the highest one was reached in the capital of Prague (15.64%). The productive population shows higher ratios at the relatively smaller variability in the span of 70.35% in the Vysočina region up to 72.28% in Prague (Table 3).
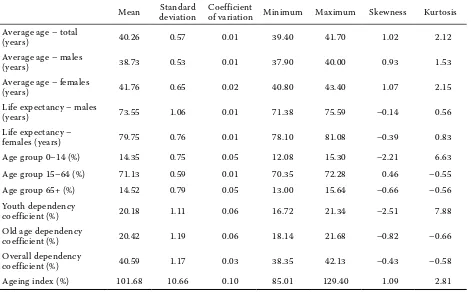
Suitable additional indicators are one-dimensional overall characteristics expressing the level, variability, skewness, kurtosis of particular regions by particular variables – see Table 4. The characteristics are calcu-lated simply – each region has the same significance regardless of its size.
The conclusions show that the mean age and lifespan prove a very low variability in 14 czech regions; a slightly higher variability is proved at the ratios of age groups and the coefficients of productive population workload, the highest interregional variability belongs to the ageing index. While the Ústecky region age-ing index reaches 85.01%, in the capital of Prague, it is 129.40%. Ten regions have higher ratios of the old people than the young, so the ageing index here exceedes 100%.
[image:3.595.64.534.83.375.2]Several other used methods contain the starting data that are incomparable as they use different units Table 2. Average age and life expectancy in czech regions as of 31st December 2007
region Average age Life expectancy
total males females males females
1 capital of Prague 41.7 40.0 43.4 75.59 80.74
2 Středočeský 40.0 38.6 41.4 73.44 79.61
3 Jihočeský 40.3 38.9 41.6 74.23 79.89
4 Plzeňský 40.7 39.4 42.1 73.98 79.58
5 Karlovarský 39.6 38.2 41.0 72.59 78.81
6 Ústecký 39.4 37.9 40.8 71.38 78.10
7 Liberecký 39.8 38.3 41.3 73.08 79.44
8 Královéhradecký 40.7 39.1 42.3 74.81 80.05
9 Pardubický 40.2 38.6 41.7 73.82 79.52
10 Vysočina 40.0 38.6 41.5 74.39 81.08
11 Jihomoravský 40.6 38.9 42.2 73.55 80.33
12 olomoucký 40.3 38.7 41.8 73.26 79.94
13 zlínský 40.4 38.7 42.1 73.33 80.17
14 Moravskoslezský 39.9 38.3 41.4 72.31 79.27
of measure, so they are converted into the non-di-mensional standardized values with zero mean value and unit variability. The standardized values of all indices are in Table 5. The standardized values are
[image:4.595.65.533.141.437.2]used in groups of regions by the means of cluster analysis. Those are the groups where the regions are similar in the age of population and different from the other groups.
Table 3. Percentage of age structure and workload of productive population in czech regions (31st December 2007)
region
Age group
representation in % Dependency coefficients Ageing index IAge 0–14 15–64 65 + CD(y) CD(old) CD(ov)
1 capital of Prague 12.08 72.28 15.64 16.72 21.63 38.35 129.40
2 Středočeský 14.83 71.04 14.13 20.87 19.89 40.76 95.30
3 Jihočeský 14.46 71.06 14.48 20.34 20.38 40.73 100.19
4 Plzeňský 14.00 70.98 15.02 19.72 21.16 40.87 107.29
5 Karlovarský 14.69 71.96 13.35 20.42 18.55 38.96 90.86
6 Ústecký 15.30 71.70 13.00 21.34 18.14 39.47 85.01
7 Liberecký 14.86 71.59 13.55 20.76 18.93 39.69 91.18
8 Královéhradecký 14.37 70.38 15.25 20.42 21.68 42.10 106.14
9 Pardubický 14.73 70.44 14.83 20.92 21.05 41.97 100.63
10 Vysočina 14.78 70.35 14.87 21.00 21.13 42.13 100.60
11 Jihomoravský 13.95 70.85 15.20 19.69 21.45 41.14 108.94
12 olomoucký 14.25 71.01 14.74 20.06 20.76 40.82 103.46
13 zlínský 14.10 70.78 15.12 19.93 21.37 41.30 107.23
14 Moravskoslezský 14.47 71.46 14.07 20.26 19.69 39.95 97.22
czech republic 14.23 71.20 14.57 19.98 20.47 40.45 102.43
Table 4. characteristics of ageing indices of regional populations in the czech republic (31st December 2007)
Mean deviationStandard of variation Minimumcoefficient Maximum Skewness Kurtosis Average age – total
(years) 40.26 0.57 0.01 39.40 41.70 1.02 2.12
Average age – males
(years) 38.73 0.53 0.01 37.90 40.00 0.93 1.53
Average age – females
(years) 41.76 0.65 0.02 40.80 43.40 1.07 2.15
Life expectancy – males
(years) 73.55 1.06 0.01 71.38 75.59 –0.14 0.56
Life expectancy –
females (years) 79.75 0.76 0.01 78.10 81.08 –0.39 0.83
Age group 0–14 (%) 14.35 0.75 0.05 12.08 15.30 –2.21 6.63
Age group 15–64 (%) 71.13 0.59 0.01 70.35 72.28 0.46 –0.55
Age group 65+ (%) 14.52 0.79 0.05 13.00 15.64 –0.66 –0.56
Youth dependency
coefficient (%) 20.18 1.11 0.06 16.72 21.34 –2.51 7.88
old age dependency
coefficient (%) 20.42 1.19 0.06 18.14 21.68 –0.82 –0.66
overall dependency
coefficient (%) 40.59 1.17 0.03 38.35 42.13 –0.43 –0.58
[image:4.595.65.536.475.767.2]Since the indices selected as variables show the dependency so strong that it could cause the infor-mation duplicity, we used factor analysis to obtain a narrower selection. out of the possible methods, we implemented the method of the farthest neighbour using Euclidean Distance.
The factor analysis of standardized values shows that out of the starting 12 indices for the assess-ment of the age of population in the regions as of 31st December 2007, two indices whose eigenvalue
is higher than 1 are sufficient. it can be seen in the following scheme of variability.
Factor Eigenvalue Per cent cumulative per cent
1 8.37 69.8 69.8
2 2.98 24.8 94.6
3 0.34 2.8 97.4
4 0.25 2.1 99.5
5 0.04 0.3 99.8
6 0.02 0.2 100.0
The proportion of indices in factors – factor load is in brackets:
1st factor: 1 – mean age (0.98), 3 – mean age of women
(0.98), 12 – ageing index (0.98)
2nd factor: 7 – ratio of productive population (0.99),
11 – coefficient of overall dependency (0.99)
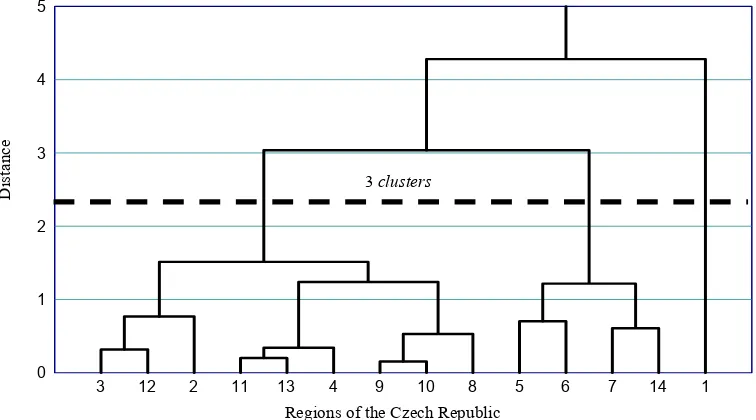
As the criterion for the creation of clusters of regions and their arrangement by the age of population as of 31st December 2007, we chose the ageing index as
the 1st factor and the ratio of productive population
as the 2nd factor (Figure 1).
The dendrogram proves that with regard to distance, creation of three groups will be the most sufficient. The groups are shown in the graph of clusters in Figure 2.
1st group: 9 regions (64.29%), lower ratio of
produc-tive population, mean ageing index
2 – Středočeský region, 3 – Jihočeský region, 4 – Plzeňský region, 8 – Královéhradecký re- gion, 9 – Pardubický region, 10 – Vysočina region, 11 – Jihomoravský region, 12 – olomoucký region, 13 – zlínský region
2nd group: 4 regions (28.57%) higher ratio of
produc-tive population, lower ageing index
5 – Karlovarský region, 6 – Ústecký region, 7 – Li- berecký region, 14 – Moravskoslezský region 3rd group: 1 region (7.14%), high ratio of productive
[image:5.595.63.533.85.355.2]population, high ageing index 1 – the capital of Prague
Table 5. Standardized values of demographical indices of age of population in czech regions (31st December 2007)
re
gi
on Average age expectancyLife Age groups Dependency coefficients Ageing index total males females males females 0–14 15–64 65+ youth old overall
Figure 1. Dendrogram of regions of the czech republic by the ratio of productive population and ageing index as of 31st December 2007
0 1 2 3 4 5
3 12 2 11 13 4 9 10 8 5 6 7 14 1
Regions of the Czech Republic
D
is
ta
nc
e
3clusters
-2 -1 0 1 2 3
-2 -1 0 1 2
a
b b b
c c c b
b b
b b b
c
Standardized values of the ratio of productive population
Standardi
zed
va
lu
es
of
agei
ng
in
[image:6.595.134.491.532.733.2]dex
Figure 2. graph of clusters of regions of the czech republic by the ratio of productive population and ageing index as of 31st December 2007
Factor Eigenvalue Per cent cumulative per cent
1 7.85 65.4 65.4
2 2.04 17.0 82.4
3 1.25 10.5 92.9
4 0.67 5.6 98.5
5 0.14 1.2 99.7
6 0.03 0.2 99.9
7 0.01 0.1 100.0
We used the standardized values of indices for the ageing index as of 31st December 2007, for the
as-sessment of development changes during the whole monitored period we calculated mean coefficients of growth by the means of geometrical average of each index. The mean coefficients of growth are non-di-mensional and comparable, so they do not need to be converted into standardized values.
Based on the factor analysis of mean coefficients of growth for the assessment of ageing of population of regions in the period 1998–2007, we set 3 factors with the eigenvalue higher than 1 as it can be seen
1st factor: 8 – ratio of post-productive population
(0.99), 10 – coefficient of dependency of old people (0.99), 1 – mean age of population (0.98), 3 – mean age of women (0.98), 12 – ageing index (0.98) 2nd factor: 9 – coefficient of dependency of young
population, (0.77), 7 – ratio of productive popula-tion (0.65), 11 – coefficient of overall dependency (0.65)
3rd factor: 5 – female lifespan (0.81), 4 – male lifespan
(0.72) (Table 6)
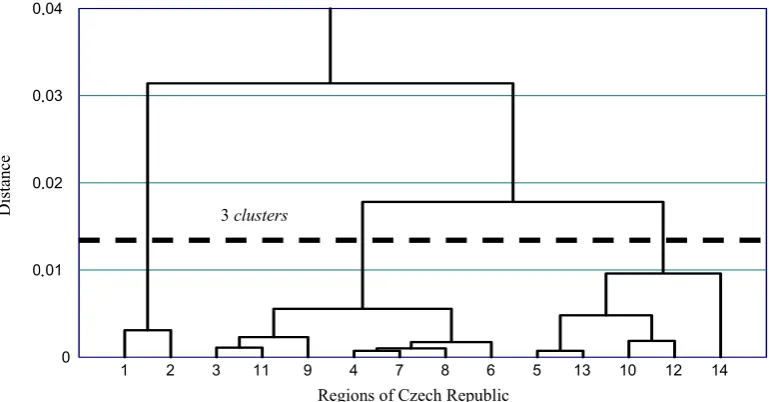
Also here, for the further analysis of the aging process of region population in 1998–2007, we chose criteria with the high factor load that fit the aims required. The first factor was the aging index, the second one the ratio of productive population and the third one the female lifespan (Figure 3).
D
is
ta
nc
e
0 0,01 0,02 0,03 0,04
1 2 3 11 9 4 7 8 6 5 13 10 12 14
Regions of Czech Republic 3 clusters
.
.
[image:7.595.68.532.84.358.2]. .
[image:7.595.113.498.533.734.2]Figure 3. Dendrogram of czech regions by the development of the ratio of productive population and ageing index in 1998–2007 (31st December)
Table 6. Mean growth coefficients in the czech regions in 1998–2007 (31st December)
re
gi
on Average age Life expectancy Age group Dependency coefficients Ageing index total males females males females 0–14 15–64 65+ youth old overall
The distance in the dendrogram enables the division of regions into 3 groups proving different ratios of the productive population and ageing index.
1st group: 2 regions (14.29%) higher ratio of
produc-tive population, low ageing index
1 – the capital of Prague, 2 – Středočeský regi-on
2nd group: 7 regions (50.00%), mean ratio of
produc-tive population, mean ageing index
3 – Jihočeský region, 4 – Plzeňský region, 6 – Ústecký region, 7 – Liberecký region, 8 –
Krá-lovéhradecký region, 9 – Pardubický region, 11 – Jihomoravský region
3rd group: 5 regions (35.71%), mean ratio of
produc-tive population, higher ageing index
5 – Karlovarský region, 10 – Vysočina region, 12 – olomoucký region, 13 – zlínský region, 14 – Moravskoslezský region
one of the aims of the contribution was not only to put the regions in order by their size and develop-ment of the ratio of productive population and ageing
1,01 1,02 1,03 1,04 1,05
1,001 1,002 1,003 1,004 1,005
a a
b b
c
b b b
b
c
b c c c
Mean coefficients of growth of the ratio of productive population
Mean
co
ef
ficien
ts
of
growth
o
f agein
g
in
dex
1.05
1.04
1.03
1.02
1.01
[image:8.595.109.495.233.445.2]1.001 1.002 1.003 1.004 1.005
Figure 4. graph of clusters of czech regions by the development of the ratio of productive population and ageing index in 1998–2007 (31st December)
1,01 1,02 1,03 1,04 1,05
80 90 100 110 120 130
Ageing index as of 31st December 2007
Mean
co
ef
ficien
ts
of
growth
o
f agein
g
in
dex
in
1
99
8–
20
07
HlavnímĢstoPraha
Ústecký Liberecký
Karlovarský
StƎedoēeský Moravskoslezský
Jihomoravský
PlzeŸský Zlínský
Olomoucký
Královéhradecký Jihoēeský
Vysoēina
Pardubický 1.05
1.04
1.03
1.02
1.01
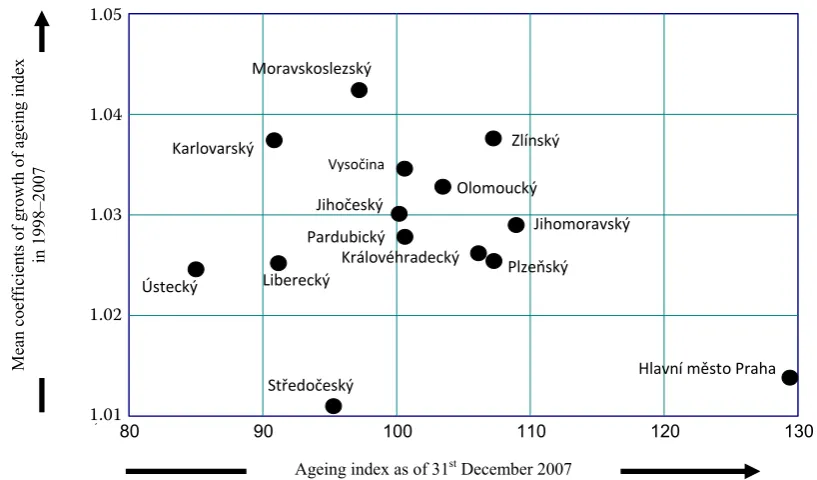
[image:8.595.96.505.502.742.2]index, but also to document the arrangement of the particular regions from the point of view of both indices independently, i.e. from the point of view of the level and changes of the ageing index (Figure5) and from the point of view of the level and changes of the ratio of productive population (Figure 6).
The conclusion of the analysis of the age and ageing of population in czech regions is their tabular ordering by the age level reached as of 31st of December 2007
(Table 7) and the rate of ageing process (Table 8). To arrange the regions in order of the age level, the first factor is the age index and the second one the ratio of productive population. We had to determine the significance and the direction of operation for the indices. Then, based on the overall score, we could set the order (Table 7). The ageing index was given significance 2 and negative operation while the ratio of productive population was given significance 1 and positive operation.
For setting the order of regions by the age of their population based on the selected indices in 2007, the score of each index was determined as a multiple of the standard value and the given significance. The negative direction of operation of index was given the opposite sign. The overall score was determined by the sum of the particular scores. The lower the value of the overall score, the older the population was and vice versa. The oldest population is in the capital of Prague with the overall score of –3.2516, the youngest population is in the Ústecký region with the overall score of 4.0937.
The identical conclusions were obtained by (Dufek, Minařík 2008) who also set the order of regions as of 31st December 2007, but apart from the indices
of age and ratio of production population they also considered the mean age of population even though the two former indices are sufficient for the factor analysis.
To arrange the region in the order of ageing, the first factor is the ageing index with the significance 2 and negative direction of operation, the second factor is the ratio of productive population with the significance 0.5 and positive direction of operation, and the third factor is female lifespan with the sig-nificance 0.5 and positive direction of operation.
To assess the ageing of population in the regions in 1998–2007, for each selected index we used mean coefficients of growth in the monitored period. They are comparable, so they did not have to be further converted. For the index with negative direction of operation, we considered the reciprocal value of the mean coefficient of growth. The score for each index was determined as the appropriate coefficient of growth (or its reciprocal value) involved to the power of the given significance of the index. The overall score then was determined as a weighted geometrical average of the particular indices scores.
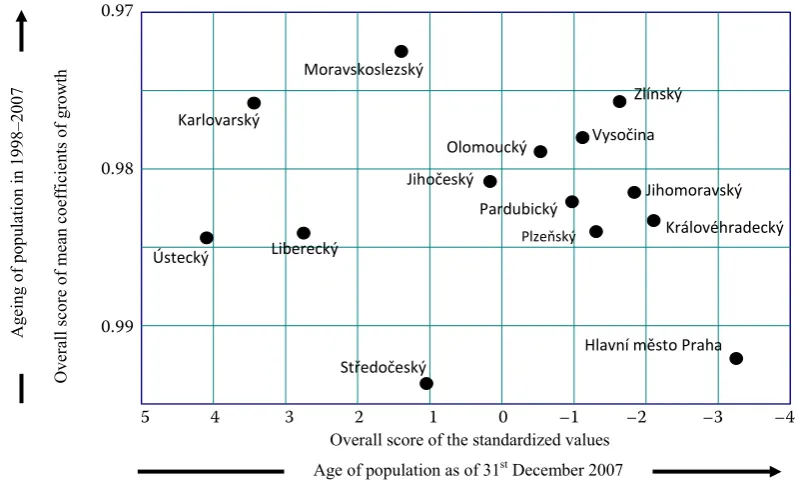
Figure 7 gives a very clear picture of the age and the ageing level in the particular regions. The horizontal axis shows the age level. To show the higher age on the right side of the axis, it was necessary to give the overall score of the standardized values shown
1,001 1,002 1,003 1,004 1,005
70 70,5 71 71,5 72 72,5
Ratio of productive population as of 31st December 2007
M ea n co ef fic ie nt s o f g ro w th o f t he ra tio o f p ro du ct iv e po pu la tio n in 19 98 –2 00 7 HlavnímĢstoPraha Vysoēina Královéhradecký Pardubický PlzeŸský Zlínský Jihomoravský Olomoucký StƎedoēeský Jihoēeský Moravskoslezský Liberecký Ústecký Karlovarský 1.005 1.004 1.003 1.002 1.001
[image:9.595.89.500.496.742.2]70 70.5 71 71.5 72 72.5
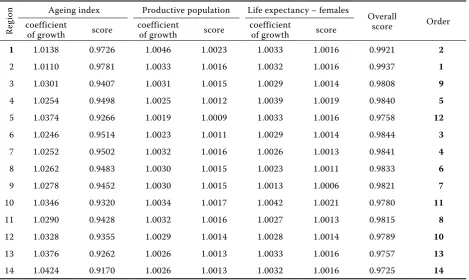
Table 8. czech regions by ageing of population in 1998–2007
re
gi
on Ageing index Productive population Life expectancy – females overall
score order
coefficient
of growth score coefficient of growth score coefficient of growth score
1 1.0138 0.9726 1.0046 1.0023 1.0033 1.0016 0.9921 2
2 1.0110 0.9781 1.0033 1.0016 1.0032 1.0016 0.9937 1
3 1.0301 0.9407 1.0031 1.0015 1.0029 1.0014 0.9808 9
4 1.0254 0.9498 1.0025 1.0012 1.0039 1.0019 0.9840 5
5 1.0374 0.9266 1.0019 1.0009 1.0033 1.0016 0.9758 12
6 1.0246 0.9514 1.0023 1.0011 1.0029 1.0014 0.9844 3
7 1.0252 0.9502 1.0032 1.0016 1.0026 1.0013 0.9841 4
8 1.0262 0.9483 1.0030 1.0015 1.0023 1.0011 0.9833 6
9 1.0278 0.9452 1.0030 1.0015 1.0013 1.0006 0.9821 7
10 1.0346 0.9320 1.0034 1.0017 1.0042 1.0021 0.9780 11
11 1.0290 0.9428 1.0032 1.0016 1.0027 1.0013 0.9815 8
12 1.0328 0.9355 1.0029 1.0014 1.0028 1.0014 0.9789 10
13 1.0376 0.9262 1.0026 1.0013 1.0033 1.0016 0.9757 13
14 1.0424 0.9170 1.0026 1.0013 1.0032 1.0016 0.9725 14
[image:10.595.64.534.441.721.2]1 = capital of Prague, 2 = Středočeský, 3 = Jihomoravský, 4 = Plzeňský, 5 = Karlovarský, 6 = Ústecký, 7 = Liberecký, 8 = Královéhradecký, 9 = Pardubický, 10 = Vysočina, 11 = Jihomoravský, 12 = olomoucký, 13 = zlínský, 14 = Moravsko-slezský
Table 7. czech regions by the age of population as of 31st December 2007
re
gi
on Ageing index Productive population overall
score order
% standardized values score % standardized values score
1 129.40 2.6004 –5.2008 72.28 1.9492 1.9492 –3.2516 14
2 95.30 –0.5985 1.1970 71.04 –0.1525 –0.1525 1.0445 5
3 100.19 –0.1398 0.2796 71.06 –0.1186 –0.1186 0.1610 6
4 107.29 0.5263 –1.0526 70.98 –0.2542 –0.2542 –1.3068 10
5 90.86 –1.0150 2.0300 71.96 1.4068 1.4068 3.4368 2
6 85.01 –1.5638 3.1276 71.70 0.9661 0.9661 4.0937 1
7 91.18 –0.9850 1.9700 71.59 0.7797 0.7797 2.7497 3
8 106.14 0.4184 –0.8368 70.38 –1.2712 –1.2712 –2.1080 13
9 100.63 –0.0985 0.1970 70.44 –1.1695 –1.1695 –0.9725 8
10 100.60 –0.1013 0.2026 70.35 –1.3220 –1.3220 –1.1194 9
11 108.94 0.6811 –1.3622 70.85 –0.4746 –0.4746 –1.8368 12
12 103.46 0.1670 –0.3340 71.01 –0.2034 –0.2034 –0.5374 7
13 107.23 0.5206 –1.0412 70.78 –0.5932 –0.5932 –1.6344 11
on the axis the negative sign. Similarly, the vertical axis shows the higher rapidity of ageing in the upper direction, so here the overall score of mean coefficients of growth goes in the opposite direction too.
The youngest population is in the Ústecký region, the oldest in the capital of Prague, the lowest pace of ageing is in the Středočeský region, the high-est pace of ageing in the Moravskoslezský region. Approximately the average age and ageing was proved in the Jihočeský region.
The decrease of the number of population and its age structure is expected to continue, which is proved by (Aleš, Šimek 1996) in their prognosis up to 2020 in accordance with the construction of the projection of population carried out by the czech Statistical office up to 2050.
The czech republic together with other developed countries struggles with the low birth-rate that is responsible for the deterioration of the age structure in the direction of ageing population. Many demog-raphers deal with the prenatal measures and discuss whether the state should take full responsibility for that – Kučera (2001), rabušic (2002), holčík (2002).
The present state of age and ageing of the czech population as well as the regional populations influ-ence taking the necessary measures that can at least mitigate the impacts of ageing and the increase the workload of productive population. Kučera (2002) warns that the social impacts of this situation will intensify in the future years, which will bring about the necessity not only to ensure the hardware of
the family but also to create a new sense of fam-ily and private life and the appropriate activities. rychtaříková (2006) documents that according to the FELICIA Project, the age group over 75 years of age will grow fastest, which will have an impact on the medical and social system as well as the community care service. According to Langhamrová and Fiala (2007), the future development of ageing population will increase the ratio of policy holders in the public health system. To estimate the costs of health care, we can use the demographic projection. The increase could be influenced by the longer lifespan of popu-lation together with the low birth rate and the low migration increase; on the other hand, this could positively influence the health of population.
Migration policy can slow down this unfavourable development. The czech republic is expected to have a positive migration balance, and it will continue to be an immigration country.
CONCLUSION
Svatošová (2008) believes that a well-balanced economic development needs a well-balanced de-mographic development which she supported by her study about different demographic developments in different regions by the assessment of trends of time lines.
The czech republic as well as other developed countries suffer from the decreasing number of
-0,99 -0,98 -0,97
-5 -4 -3 -2 -1 0 1 2 3 4
Overall score of the standardized values
Ov
er
all
scor
e
of
mean
coef
fici
ents
of
grow
th
Age of population as of 31st December 2007
A
ge
in
g
of
p
op
ul
at
io
n
in
1
99
8–
20
07
StƎedoēeský
HlavnímĢstoPraha Ústecký
Karlovarský
Liberecký
Moravskoslezský
Jihoēeský Olomoucký
Pardubický
Vysoēina
PlzeŸský
Zlínský
Jihomoravský
Královéhradecký 0.97
0.98
0.99
[image:11.595.89.488.497.738.2]5 4 3 2 1 0 –1 –2 –3 –4
lation and the deteriorating age structure. The trend of lower birth-rate, even when increased temporar-ily as a result of a higher number of women in the reproductive age, is proved by the lower number of infant population and the longer middle age which necessarily leads to the ageing of population. in all countries, the ageing index increases and with a few exceptions, the workload of productive population by old people is growing not only on the whole state level but also on the regional level.
Ageing of population becomes evident in the nega-tive economic and social impacts which will deepen in the upcoming years. it calls for taking the whole range of steps like the reform of the superannuation system or the reform of the system of health care and education.
Koschin (2005) believes that the ageing population is not endangered by the collapse in the near future because increased workload of productive popula-tion from the point of view of the number of persons will be compensated by the technological progress, the increased level of human capital i.e. the better education of population and the development of skills and knowledge. The authors Tomšík, Minařík and Somerlíková (2008) stress the necessity of paying a proper attention to the increasing age structure of the companies’ employees, and the support the en-hancement of their skills and qualifications related to modern technologies and the requirements of working environment.
The contribution is a part of the research Project of the Faculty of Business and Economics, Mendel University of Agriculture and Forestry in Brno MSM 6215648904 “czech economy in the process of in-tegration and globalization and the development of agrarian sector and sector of services in the new conditions of integrated agrarian market”, topical direction 5 “Social economic relation of sustainable multifunctional agriculture and measures of agrarian and regional policy” and its part “Analysis of demo-graphic development in the Czech Republic, impact of delay in comparison with western democracies, demonstration in rural areas in basic demographic characteristics in general and according to specific conditions in the regions of the Czech Republic”.
REFERENCES
Aleš M., Šimek M. (1996): Demographic population projection of the czech republic 1995–2020 (in czech). Demografie, 38 (1): 1–17.
Dufek J., Minařík B. (2008): Population ageing in the czech republic and the development of the pro-ductive population workload (in czech). MzLU, Brno; iSBn 978-80-7375-253-8.
holčík J. (2002): Let us discuss the population policy (in czech). Demografie, 44 (3): 197–198.
Koschin F. (2005): our population is ageing – are we going to earn a living? (in czech). Demografie, 47 (4): 245–250.
Kovář J., Říhánek z. (1995): Typology of age structures in the czech republic (in czech). Demografie, 38 (2): 102–112.
Kučera M. (2001): publika zřetelnou populační a migrační politiku? (Does the czech republic need Effective Population and immigration Policy? (in czech). Demografie, 43 (2): 85–92.
Kučera M. (2002): Social consequences of popu-lation ageing in the czech republic (in czech). Demografie, 44 (1): 38–40.
Langhamrová J., Fiala T. (2007): Application of demographic projection method to expenditures on health care (in czech). Firma a konkurenční prostředí 2007 – Kvantitativní metody v hospo-dářství. MzLU, Brno, pp. 78–83; iSBn 978-80-86633-86-2.
Mašková M. (1993): Demographic aspects of popu-lation ageing in the czech republic (in czech). Demografie, 35 (4): 236–246.
rabušic L. (2002): on some assumption of implemen-tation of population policy (in czech). Demografie, 44 (3): 177–187.
rychtaříková J. (2006): healthy life expectancy in the current czech Population (in czech). Demogra-fie,48 (3): 166–178.
Svatošová L. (2008): Analysis of the demographic evolution in regions of cr (in czech). PEF ČzU, Praha, pp. 703–707; iSBn 978-80-213-1813-7. Tomšík P., Minařík B., Somerlíková K. (2008): Factors
affecting methods of the management of employ-ees in agrobusiness companies in the region of “Vysocina”. Agricultural Economics – czech, 54 (7): 293–300.
Arrived on 20th April 2009
Contact address: