Enterococcus faecium
Growth Model
Pavel ČErmák
1, Aleš LANdFELd
2, Pavel měřiČkA
3and milan HouškA
21General Teaching Hospital, Charles university, Prague, Czech republic; 2Food research
institute Prague, Prague, Czech republic; 3Tissue Bank,Hradec kralove Teaching Hospital, Hradec kralové, Czech republic
Abstract
Čermák P., Landfeld A., Měřička P., Houška M. (2009): Enterococcus faecium growth model. Czech J. Food Sci., 27: 361–371.
Enterococci are bacteria commonly found in humans. However, these bacteria can cause severe infections in suscepti-ble individuals. The strains of Enterococcusfaecium have demonstrated an increasing resistance to antibiotics, which is considered an important virulence factor. The contribution of E. faecium to the infection-related illnesses has re-cently increased, which involves most of the isolated Vancomycin-Resistant Enterococcus (VRE) strains. Enterococci are common contaminants of human milk processed in milk banks, and the consumption of contaminated milk can cause severe infection-related complications if the control mechanisms fail to detect the contamination. Extensive data are available on the growth curves of E. faecium in broth at pH values between 6 and 7, at temperatures of 5°C to 20°C, and for water activity values aw of 0.97 to 0.997. These growth curves were replaced with non-linear Gompertz curves for microorganism growth, the parameters of which were correlated with the temperature and pH values. A mathematical relationship to water activity could not be established since only two water activity levels have been experimentally tested and the resulting model would be highly inaccurate. The issue of water activity was resolved by the development of two separate models, one for each of the water activity values. The models correspond very well with the experimental growth curve data from which they were developed. The model for the water activity level of 0.997 was used to predict the growth of E. faecium in cow and human milks (these two fluids have practically identical water activity), and the prediction was compared to the experimental data. A good agreement between the predicted and experimental data was achieved for cow milk. With human milk, the model usually predicted a more rapid growth rate than that seen experimentally. The model was thus on the conservative side in all cases. The inhibitory agents naturally present in human milk might be responsible for the slower growth rates.
Keywords: Enterococcus faecium; microbial growth model; verification
Supported by the Ministry of Agriculture of the Czech Republic, Projects No. 1B44040 and No. MZE 0002702201. In 1984, the Enterococcus family was described as
a separate taxonomic unit and distinguished from streptococci; the distinction was based on DNA hybridisation data (Schleifer & Kilpper-Balz 1984). Today, the Enterococcus family includes 28 species (Klein 2003; Moreno et al. 2006). Microscopically, the organism is a Gram-positive,
can grow on basic substrates used in microbio-logical laboratories at 10–45°C, with the optimum temperature of about 37°C. The microorganism can tolerate increased concentrations of NaCl (up to 6.5%) and bile salts (up to 40%), as well as higher substrate pH values (up to pH 9.6). The microorganism can withstand heating to 60°C for 30 minutes. Most enterococci proliferate under common aerobic conditions. Several species are supported in growth by 10% CO2 in the incubation environment (Motlová 1997).
Enterococci are part of the intestinal flora of numerous animal species. They have been used as probiotic agents to inhibit pathogenic microor-ganisms in the intestine, to stimulate the immune system, and to reduce blood cholesterol levels. E. faecium SF68 has been used as an alternative to antibiotic therapy to treat diarrhoea (Lewen-stein et al. 1979). However, long-term effects of enterococci on reducing the contents of low-density lipoproteins, (LDL)-cholesterol, have not been demonstrated (Agerholm-Larsen et al. 2000).
The pathogenicity of enterococci is relatively low under normal conditions. Enterococci are consid-ered dangerous agents because of their extreme resistance to the negative external influences and resistance to antibiotics (Votava 2003). They are considered conditionally pathogenic and are impor-tant in nosocomial infections and super-infections, such as endocarditis, bacteremia, urinary tract infections, central nervous system infections, intra-abdominal abscesses, and infections in newborn infants (Beneš 1997; Klein 2003). Enterococci are a common cause of bacteremias (Čermák et al. 2004). The urogenital tract, bile duct, and abdomi-nal cavity are the most likely sites of infections. Endocarditis develops in approximately one-third of enterococcal bacteremia patients (Klein 2003). Enterococci cause approximately 12% of nosoco-mial infections (Linden & Miller 1999). These infections develop in two stages. The initial stage usually involves asymptomatic colonisation of the skin and the gastrointestinal tract with an endemic strain contracted in a hospital environment. If the patient is receiving immunosuppression therapy, the size of the enterococci population may increase when the microorganisms proliferate from the initial colonisation sites, and thereby trigger a complicated infection (Kayser 2003).
The most common causative agents of enterococ-cal infections in humans are E. faecalis (80–90%) and E. faecium (5–10%). Infections with other
spe-cies of enterococci are rather rare (Klein 2003). Enterococci do not have a single virulence fac-tor, such as is the toxin in cholera, instead they have several virulent factors including enzymes (gelatinase, hyaluronidase), colonisation factors (adhesines (adhesins), surface proteins (Enterococ-cal surface protein – Esp), aggregation substance (AS), and cytolysine (cytolysin). Some strains of E. faecalis and E. faecium can produce extracel-lular super oxide, which facilitates the penetration of the bacteria into tissues and into the blood stream (Huycke 1995). Enterococci can also rap-idly acquire the resistance to antibiotics, and this is considered to be one of the key factors in their virulence (Franz et al. 2003; Kayser 2003). In the USA, as many as 80% of all E. faecium strains have become resistant to penicillin-related an-tibiotics (Huycke et al. 1998), and this figure is 76% in Europe (Kresken et al. 2000). In recent years, the bacteria have developed resistance to previously effective antibiotics – aminoglycosides, cephalosporins, chloramphenicol, erythromycin, tetracycline, fluorochinolone, and glycopeptides (Klein 2003). Vancomycin-resistant enterococci (VRE) present a serious risk and a difficult problem, since they are resistant to all standard preparations used for the treatment of enterococcal infections. The resistance to vancomycin is related to the vanA, vanB, and vanC genes. The genes vanA and vanB are transferred via plasmids and cause an increased resistance among enterococci (Murray 1997, 1998) as well as other pathogens such as Staphylococcus aureus (Weigel et al. 2003). One of the sources of VRE is the use of growth-stimulating agents in the livestock production (Aarestrup 1999). Another cause of the increasing numbers of VRE is the excessive use of antibiotics (Heath et al. 1996; Kolar et al. 2006a).
In the past, the main bacterial cause of human enterococcal infections was E. faecalis (in more than 80% cases), with E. faecium causing the re-maining infections (Jett et al. 1994).
(found in 70.4% of all in-patients) (Kolar et al. 2006c).
Enterococci are often isolated from human milk processed in milk banks since their high levels of resistance allow the microorganisms to survive the procedures used to process human milk. The con-sumption of contaminated human milk can cause serious infections since it is usually intended for patients that are already susceptible to infections. Complications caused by the infection in a newborn, resulting from a resistant strain of E. faecium, may present a particularly difficult treatment issue, es-pecially in the cases of life-threatening infections. Therefore, the knowledge of the various character-istics of E. faecium is of immense significance since it would allow for improved processing, storage, and transport of human milk.
It is particularly important to understand the risks of proliferation of small numbers of E. fae-cium surviving careful pasteurisation. Related to this, it is also important to understand the thermal inactivation characteristics of E. faecium. These characteristics were the subject of a previous study (Špelina et al. 2007).
The aim of this work is to provide an overview of the growth curves and a mathematical growth model for E. faecium CCM 2308. The growth-related parameters were altered as follows: tem-perature 5–20°C, pH 6–7, and water activity at 0.97 and 0.997. The growth data were processed mathematically to obtain the parameters for a suitable mathematical growth model for the mi-croorganism. These parameters were subsequently correlated as a function of temperature, pH, and water activity. The resulting mathematical model was tested against the growth data acquired for the same microorganism experimentally, using cow and human milk samples.
MATERIAL AND METHODS
Broth inoculation. A strain of E. faecium CCM 2308 was selected from a collection of microorgan-isms. The culture of E. faecium CCM 2308 was supplied by the Czech Collection of Microorgan-isms (CCM) in the form of gel plates contained in sterile vials. From each plate, a revitalised culture was prepared on an agar slant using the procedure recommended by the CCM.
The revitalisation of the culture proceeded at 37°C for 20 hours. Two colonies were taken from
the revitalised culture and suspended in 1.8 ml saline. After a thorough mixing of the bacterial suspension, 0.2 ml was extracted and transferred to 1.8 ml of sterile saline in a test tube. After shaking, 1 ml was with drawn from the solution and placed in a bottle with 500 ml of the nutrient substrate. After thoroughly shaking the nutrient broth, 0.1 ml of the broth was inoculated onto a Petri dish with blood agar. The number of colonies grown on the agar was taken as the initial concentration. The nutrient broth was cultivated at 5, 10, 15, and 20°C in a special thermal box, which enabled a highly accurate temperature control. The device was equipped with a fan ensuring a steady air circulation, and with an internal thermometer for the temperature monitoring and control at a specified position in the box.
The cultures were grown at the specified tem-perature for varying lengths of time. All cultures were grown independently and simultaneously in three bottles, producing three growth curves for each set of conditions (temperature, initial pH of the sterilised broth, and water activity).
Samples collection and microorganism number
determination. The samples used to determine
the microorganism numbers were collected asepti-cally, in time series, at 5°C, only after more than 1000 hours. When collecting the samples, the pH of the collected sample was also determined.
Sample dilution. After a thorough shaking of
the bacterial suspension (cultivated broth), 0.2 ml was taken from the suspension and transferred to 1.8 ml of sterile saline in a test tube. Up to nine dilutions were obtained in this manner as neces-sary. Each of the dilutions was inoculated onto three Columbia blood agar plates.
Inoculation and incubation of blood agar. A
0.1 ml sample of each dilution was spread on an agar plate and inoculated using a plastic loop. The dishes were clearly marked and incubated in a thermostatic box for 24 h at 37°C. The num-bers of colonies for each dilution were counted after incubation. Two plates were used for each dilution.
Calculation method. For the calculation
N = ∑ C
V × [n1 + (0.1 × n2)] × d where:
ΣC – sum of the colonies from all plates selected for the calculation from two successive dilutions, while at least one of the plates must contain at least 15 colonies V – volume (ml) of the inoculum transferred to each
plate
n1 – number of plates selected for the calculation from the first dilution selected
n2 – number of plates selected for the calculation from the second dilution selected
d – dilution factor corresponding to the first dilution selected for the calculation
If the condition for ΣC (i.e. at least one plate must contain at least 15 colonies) was not met, the value obtained was interpreted in line with the above-cited ISO standard – as an estimate. If colonies were detected on one plate only and higher degree dilutions resulted in zero colonies, the estimate was based on the number of colonies on the one plate.
RESULTS AND DISCUSSION Growth model
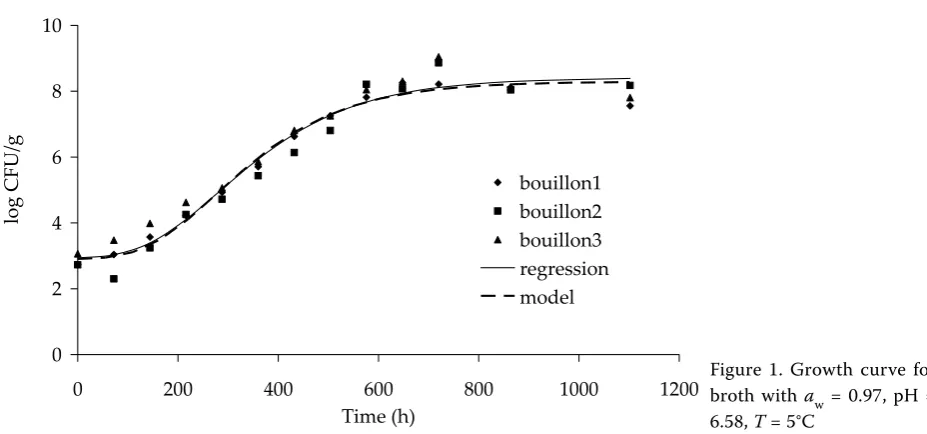
The data selected for the growth curves are shown in Figures 1–4 to illustrate the curve shapes. The growth data were acquired for water activities of 0.97 and 0.997, and temperatures of 5, 10, 15, and 20°C. pH values shifted during the cultivation from the initial value, and increased by approximately
0.3 from the value measured after sterilisation of the broth. It was therefore decided to determine an average pH value for the whole cultivation process. These average values are listed in the relevant legend for each figure and in Table 1. Each cultivation was repeated three times, see figures. At 20°C, pH ~ 5.99, and water activity of 0.97, there was no measurable growth of micro-organisms due to a significant undetectable error. These data were not included in the development of the mathematical model.
All data obtained for the same initial pH, water activity, and temperature conditions were evaluated together. Datafit software (Oakdale Engineering, Oakdale, USA) was used to obtain the parameters of the growth curves using non-linear regression analysis.
Microbial growth modelling uses the Gompertz model, the modified Gompertz model, or the lo-gistic curve (Zanoni et al. 1993). The Gompertz model was preferred in this case, provided that parameter a was considered a regression param-eter. The following model was used:
log N = a + c× exp (– exp(– b× (t – m))) (3–1)
where:
a – model parameter approximating the log of the ini-tial concentration
c – logarithm of the microorganism growth from the initial concentration to the stationary growth stage
b – relative microorganism growth rate during the log-arithmic growth stage
m – time to maximum growth rate t – time (h)
0 2 4 6 8 10
0 200 400 600 800 1000 1200
Timeȱ(h)
lo
gȱ
C
FU
/g
[image:4.595.63.527.543.760.2]bouillon1 bouillon2 bouillon3 regression model
The duration of the lag stage (the time when the organism adapts to the environment and does not proliferate) was calculated by: lag stage = m − (1/b). By substituting this time for time t in the formula (3–1), it can be shown that at the end of the lag stage, the model predicts a slight increase in the numbers of microorganisms, i.e. by 0.067 of the value of c. log N = a + c× e–e = a + c × 067
Technical reasons prevented obtaining the same initial concentration of the microorganism, thus it was necessary to convert the regression pa-rameters to a specified initial concentration to facilitate the correlation with temperature, pH, and water activity.
The specified initial concentration was a2 ≈ logN0 = 1 (N0 = 10). The formula for the calculation of pa-rameter a involves determining t = 0 in formula (3–1):
a = log N0 − c × exp (−exp(b × m))
The conversion also ensures that the growth model converges to the same maximum micro-organism concentration.
For the conversion, the relationships determined from the comparisons of the growth curves were used, describing two growth curves starting from the conditions marked with indexes 1 and 2. It was assumed that the parameters of the growth curve model indexed 1 are known, as they were specified by data regression for the initial con-centration a1. The second initial concentration a2, was selected arbitrarily. Model 1 and model 2 must demonstrate the same duration for the lag stage. It therefore follows that:
m1 – (1/b1)= m2 − (1/b2)
from which m2 can be easily determined
[image:5.595.64.536.100.451.2]m2 = m1 − ((1/b1) + (1/b2)) (3–2) If there are equal maximum concentrations of microorganisms:
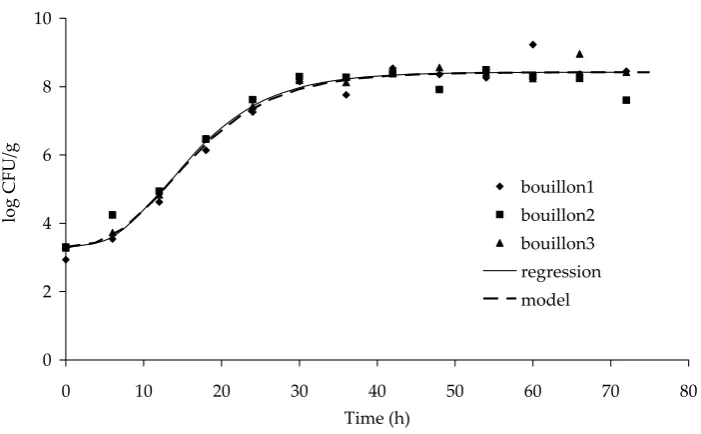
Table 1 Parameter values for Gompertz model depending on cultivation conditions (converted to a2 = 1)
Temperature (°C) pH (–) aw (–) a1 (log CFU/g) b2 (h–1 ) c
2 (–) m2 (h) Lag stage (h)
5
5.95 0.970 2.632 0.003861 7.126 419.1 160.0
6.26 0.970 2.307 0.004614 7.125 344.8 128.1
6.58 0.970 2.927 0.004841 7.415 335.7 129.1
5.86 0.997 2.414 0.003791 7.571 372.9 109.2
6.22 0.997 1.843 0.003919 7.922 343.4 88.2
6.60 0.997 1.925 0.003671 7.792 274.3 2.0
10
5.93 0.970 2.592 0.010884 7.449 153.5 61.7
6.35 0.970 2.899 0.013603 7.142 119.4 45.9
6.56 0.970 2.706 0.012059 7.254 130.0 47.1
5.93 0.997 2.582 0.015595 7.690 99.6 35.5
6.30 0.997 2.920 0.017175 7.534 90.4 32.2
6.55 0.997 2.756 0.016824 7.621 94.2 34.8
15
5.99 0.970 3.154 0.031482 6.999 56.7 24.9
6.28 0.970 3.292 0.028514 7.158 53.4 18.3
6.56 0.970 3.434 0.028105 7.153 55.8 20.2
5.94 0.997 3.131 0.055135 7.490 26.1 8.0
6.22 0.997 2.770 0.059784 7.480 25.0 8.3
6.55 0.997 2.917 0.056246 7.472 27.5 9.7
20
6.4 0.997 2.948 0.101101 7.349 16.2 6.3
6.67 0.997 2.964 0.088648 7.431 15.5 4.2
a1 +c1 = a2 +c2
Hence, the value of parameter c2 is:
c2 = a1 + c1 −a2 (3–3) The maximum growth rate dlogN/dt is achieved at time t = m. This can be proven with the second derivation of equation (3–1) and setting the condi-tion d2logN/dt2 = 0. The maximum growth rate is then determined by the formula:
dlogN/dt = c × b × e–1 (3–4) If it is assumed that the model determines the same maximum growth rate for the logarithmic stage (regardless of the initial microorganism concentration), formula (3–4) leads to:
c1× b1 = c2× b2
Hence, the new value of b can be obtained by: b2 = b1× c1/c2 (3–5) The resulting values of the converted model pa-rameters are shown in Table 1. The data indicate the effects of temperature, pH, and water activ-ity on the model parameters. Table 1 also shows that the data for 2°C and water activity 0.97 were discounted, since this particular experiment was affected by a serious error.
The values obtained for parameters b, c and m were correlated with temperature, pH, and wa-ter activity using multiple non-linear regression analysis (Datafit software). It was found that the correlations withthe water activity were highly unreliable. For this reason, it was decided to de-velop two separate mathematical models, one
0 2 4 6 8 10
0 50 100 150 200 250 300 350 400 450 500 Timeȱ(h)
lo
g
ȱ
C
FU
/g
bouillon1 bouillon2 bouillon3 regression model
0 2 4 6 8 10
0 50 100 150 200 250
Timeȱ(h)
lo
gȱ
C
FU
/g
[image:6.595.62.525.87.308.2]bouillon1 bouillon2 bouillon3 regression model
Figure 2. Growth curve for broth with aw = 0.997, pH = 5.93, T = 10°C
[image:6.595.62.516.518.754.2]for each of the water activity values. The model parameters are therefore valid for specific water activity values. Table 1 shows that the values of parameter c remain almost constant. The correla-tion of parameter c with temperature and pH will therefore be rather unreliable. For the purposes of higher prediction accuracy, it was nonetheless decided to correlate this parameter as a function of temperature and pH.
The following relationships and values were obtained for the constants of regression depen-dencies. Letters a–f are used to represent the empirical constants of the dependences on pH and temperature (parameters of secondary models). To differentiate between the parameters of the Gompertz model and the empirical constants of temperature and pH dependences, the Gompertz model parameters are marked in bold.
For water activity in nutrient broth aw = 0.97, the following relationships and constants were obtained (r2 = 0.99).
b = a + b× T + c/pH + d × T2 + e/pH2 + f× T/pH (3–6) where:
T – temperature (°C) pH – appear.
a = –0.215; b = −5.700 × 10⁻³;c = 3.026;d = 1.870 × 10⁻⁴;
e = −10.253; f = 2.790 × 10⁻²
For parameter c, the following formula applies (r2 = 0.16)
c = a + b× T + c× pH (3–7) a = 6.636; b = 1.20 × 10⁻²;c = 0.109
For parameter m, the following formula applies (r2 = 0.99)
m = a × Tb× pHc (3–8) a = 258 963.6; b = −1.553; c = −2.215
For water activity in the nutrient broth aw = 0.997, the following relations and empirical constants apply (r2 = 0.99)
b= a + b× T + c× T2 + d× T3 + e× pH (3–9) a = 4.880 × 10⁻²; b = −1.660 × 10⁻²;c = 1.730 × 10⁻³;
d = −3.920 × 10⁻⁵; e = −9.580 × 10⁻⁵
For parameter c, the following formula applies (r2 = 0.76)
c = a + b× T + c pH (3–10) a = 7.304; b = −2.690 ×10⁻²; c = 9.390 × 10⁻²
For parameter m, the following formula applies (r2 = 0.99)
m = a × Tb × pHc (3–11) a = 562 055.8; b = −1.958; c = −2.348
The values obtained for parameter b as a func-tion of temperature T and pH for different water activity values are not of the same type. Formula (3–6) includes a complicated dependency on pH and temperature, whereas for water activity 0.997 is more suitable a rather simple formula (3–9), which contains a parabolic third degree dependency on temperature and linear dependency on pH.
Parameter c has a linear dependence on tempera-ture as well as on pH. For water activity 0.97, the 0
2 4 6 8 10
0 10 20 30 40 50 60 70 80
Timeȱ(h)
lo
gȱ
C
FU
/g
[image:7.595.66.417.83.300.2]bouillon1 bouillon2 bouillon3 regression model
correlation coefficient is not significant because the critical value of the correlation coefficient for the number of the degrees of freedom 9−3 = 6 at the significance level of 95% is 0.707. For water activity 0.997, there are 12 data points, the number of model parameters is also 3, and the number of the degrees of freedom is therefore 9. The critical value of the correlation coefficient at 95% signifi-cance level is 0.602, and the correlation obtained (formula 3–10) is therefore statistically significant (Štěpánek 1975).
Parameter m is expressed by a power expansion that is dependent on both temperature and pH. The correlations for the water activity values examined have significant correlation coefficients.
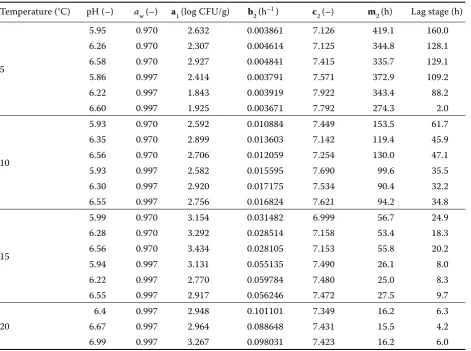
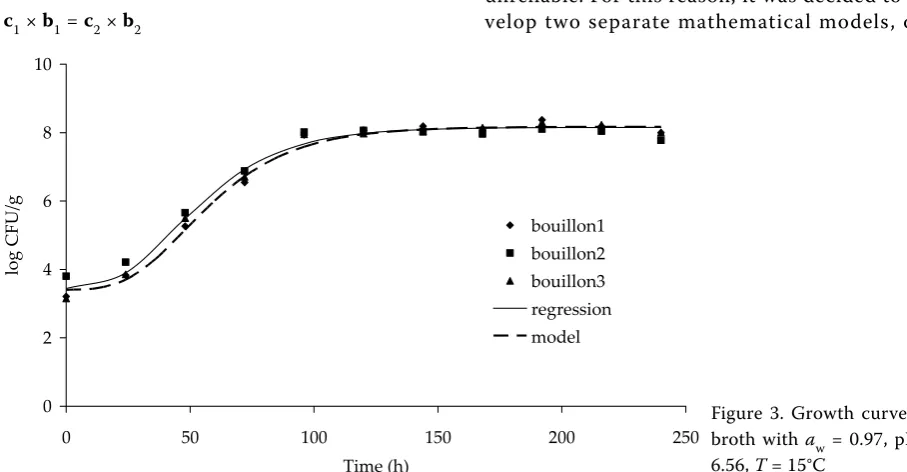
Figures 1–4 show the Gompertz curves repre-senting the regression curves obtained from the
data shown. The figures also contain curves that represent a growth model that includes the effects of temperature and pH for the given water activity value. The figures show that the growth model is in a good agreement with the experimental data. The calculations of the growth model were based on the values of the initial concentrations a1 as shown in Table 1. The values of other parameters determined by formulas (3–6) to (3–11) were also converted to the relevant initial average concentration a1 for the calculation of particular growth curves.
Model Verification
Verification data for cow and human milks were measured also by our team (Figures 5–9). The data 0
2 4 6 8 10
0 100 200 300 400 500 600 700
Timeȱ(h)
lo
gȱ
C
FU
/g
cowȱmilkȱ1 cowȱmilkȱ2 cowȱmilkȱ3 model
0 2 4 6 8 10
0 50 100 150 200
Timeȱ(h)
lo
gȱ
CFU/g
cowȱmilkȱ1 cowȱmilkȱ2 model
0 2 4 6 8 10
0 100 200 300 400 500 600 700
Timeȱ(h)
lo
gȱ
C
FU
/g
humanȱmilkȱ1 humanȱmilkȱ2 humanȱmilkȱ3 model
0 2 4 6 8 10
0 50 100 150 200
Timeȱ(h)
lo
gȱ
C
FU
/g
[image:8.595.62.288.80.269.2]humanȱmilkȱ1 humanȱmilkȱ2 humanȱmilkȱ3 model
[image:8.595.305.526.85.265.2]Figure 6. Verification of model on cow milk, T = 15°C, pH = 6.4, aw = 0.997
[image:8.595.67.297.545.726.2]Figure 5. Verification of model on cow milk, T = 5°C, pH = 6.4, aw = 0.997
Figure 8. Verification of model on human milk, T = 10°C, pH = 6.8, aw = 0.997
were obtained for the same strain of E. faecium, i.e. CCM 2308.
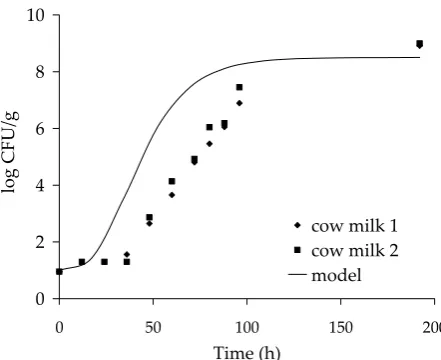
The growth model for water activity 0.997 was used for all values of pH and temperature, and the theoretical growth curve of E. faecium was calcu-lated. Figure 5 shows a model that is valid for cow milk at 5°C, and reveals a very good agreement between the experimental data and the model.
The same applies for cow milk at temperatures of 10°C and 20°C. Figure 6, which also includes the data for 15°C, shows that the model predicts a more rapid growth of microorganisms and a shorter duration of the lag phase than were those measured experimentally. Overall, it can be stated that the prediction of E. faecium growth in cow milk agrees well with the experimental data.
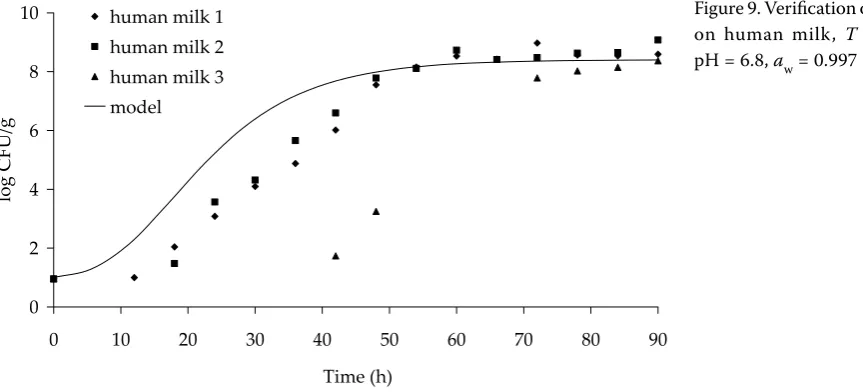
Figures 7–9 indicate that the predictions of microorganism growth and the experimental data obtained for human milk are in agreement. Figure 7 shows a model applicable for 5°C and shows a very good agreement between the model prediction and the experimental data. Figure 8 is valid for 10°C and shows that the model predicts a more rapid growth rate than was that measured experimentally. The experimental data also show a longer lag phase.
Figure 9 is valid for human milk at 20°C and shows a shorter lag phase for the model (growth rates approximately equal, plus a good agreement between both maximum concentrations). It should be noted that the experimental data used in this figure for milk sample 3 shows an extremely long lag time. This might be due to the inhibitory agents that are naturally present in human milk. In general, the model predicts for human milk more rapid
growth rates in comparison to the experimental results, and therefore can be considered to be a conservative model.
CONCLUSIONS
Extensive data were obtained for E. faecium growth curves at pH values between 6 and 7, tem-peratures between 5–20°C, and water activities aw of 0.97 and 0.997. These data were replaced with a non-linear Gompertz model for microorganism growth, whose parameters were correlated with temperature and pH. It was proved to be impossible to determine mathematical dependence on water activity since only two values were specified and the resulting model would be highly inaccurate. Therefore, two models were developed, one for each of the specified water activity values. These models show a good agreement with the experi-mental data for the growth curves.
The model for water activity 0.997 was used to predict E. faecium growth rates in cow and human milks (which have nearly the same water activities) and the predicted values were com-pared with the experimental data. There was a good agreement between the predicted and the experimental data for cow milk. As to human milk, the growth model tended to predict faster growth rates than were those measured experi-mentally. The model can therefore be considered conservative and erroneous on the side of cau-tion and safety. The slower actual growth rates are likely due to the presence of natural growth inhibitors in human milk.
0 2 4 6 8 10
0 10 20 30 40 50 60 70 80 90
Timeȱ(h)
lo
g
ȱ
C
FU
/g
[image:9.595.67.499.85.281.2]humanȱmilkȱ1 humanȱmilkȱ2 humanȱmilkȱ3 model
References
Aarestrup F.M. (1999): Association between the con-sumption of antimicrobial agents in animal husband-ry and the occurrence of resistant bacteria among food animals. International Journal of Antimicrobial Agents, 12: 279–285.
Agerholm-Larsen L., Bell M.L., Grunwald G.K., Astrup A. (2000): The effect of a probiotic milk prod-uct on plasma cholesterol: a meta-analysis of short-term intervention studies. European Journal of Clinical Nutrition, 54: 856–860.
Beneš J., Kabelková M., Džupová O. (1997): Enteroko-ková endokarditida. Klinická mikrobiologie a infekční lékařství, 3: 289–293.
Čermák P., Kolář M., Látal T., Heinigeová B., Bar-toníková N. (2004): Frequency of gram-positive bacterial pathogens in bloodstream infections in the Czech Republic. European Journal of Clinical Micro-biology & Infectious Diseases, 23: 794–795.
Franz C.M., Stiles M.E., Schleifer K. H., Holzapfel W.H. (2003): Enterococci in the foods – a conundrum for food safety. International Journal of Food Micro-biology, 88: 105–122.
Heath C.H., Blackmore T K., Gordon D.L. (1996): Emerging resistance in Enterococcus spp. The Medical Journal of Australia, 164: 116–120.
Huycke M.M., Joyce W., Wack M.F. (1995): Augment-ed production of extra-cellular superoxide by blood isolates of Enterococcus faecalis. Journal of Infectious Disease, 173: 743–746.
Huycke M.M., Sahm D.A., Gilmore M.S. (1998): Mul-tiple-drug resistant enterococci: the problem and an agenda for the future. Emerging Infectious Diseases,
4: 239–249.
Jett B.D., Huycke M.M., Gilmore M.S. (1994): Viru-lence of enterococci. Clinical Microbiology Reviews,
7: 462–478.
Kayser F.H. (2003): Safety aspects of enterococci from the medical point of view. International Journal of Food Microbiology, 88: 255–262.
Klein G. (2003): Taxonomy, ecology and antibiotic re-sistance of enterococci from food and gastro-intestinal tract. International Journal of Food Microbiology, 88: 123–131.
Kolar M., Urbanek K., Vagnerova I.,Koukalova D. (2006a): The influence of antibiotic use on the occur-rence of vancomycin-resistant enterococci. Journal of Clinical Pharmacy and Therapeutics, 31: 67–72. Kolar M., Pantucek R., Vagnerova I., M. Kesselova
M., Sauer P., Matouskova I., Doskar J., Koukalo-va D., Hejnar P. (2006b): Genotypic characterisation of vancomycin-resistant Enterococcus faecium isolates
from haemato-oncological patients at Olomouc Uni-versity Hospital, Czech Republic. Clinical Microbiol-ogy and Infection, 12: 353–360.
Kolar M., Pantucek R., Vagnerova I., Sauer P., Kes-selova M., Cekanova L., Koukalova D., Doskar J., Ruzickova V. (2006c): Prevalence of vancomycin-resistant enterococci in hospitalized patients and those living in the community in the Czech Republic. New Microbiology, 29: 121–125.
Kresken M., Hafner D. und die Studiengruppe (2000): Resistenzsituation bei klinisch wichtigen Infektions-erregern gegenüber Chemotherapeutika in Mittel- europa. Ergebnisse einer multizentrischen Studie der Arbeitsgemeinschaft „Resistenz“ in der Paul-Ehrlich-Geselschaft für Chemotherapie e. V. aus dem Jahre 1998. Chemotherapie Journal, 9: 51–86.
Lewenstein A., Frigerio G., Moroni M. (1979): Bio-logical properties of SF68, a new approach for the treatment of diarrheal diseases. Current Therapeutic Research, 26: 967–981.
Linden P.K., Miller C.B. (1999): Vancomycin-resistant enterococci, the clinical effect of common nosocomial pathogen. Diagnostic Microbiology and Infectious Disease, 33: 113–120.
Moreno M.R.F., Sarantinopoulos P., Tsakalidou E., De Vuyst L. (2006): The role and application of enterococci in food and health. Interational Journal of Food Microbiology, 106: 1–24.
Motlová J. (1997): Identification of enterococci – methodology. [Reports of CEM.] State Health Insti-tute Prague, 6: 18–22.
Mundy L.M., Sahm D.F., Gilmore M.S. (2000): Rela-tionships between enterococcal virulence and anti-microbial resistance. Clinical Microbiology Reviews,
13: 513–522.
Murray B.E. (1997): Vancomycin-resistant enterococci. American Journal of Medicine, 101: 284–293. Murray B.E. (1998): Diversity among
multidrug-re-sistant enterococci. Emerging Infectious Diseases,
4: 37–47.
Schleifer K.H., Kilpper-Bälz R. (1984): Transfer
of Streptococcus faecalis and Streptococcus faecium
to the genus Enterococcus nom. rev. as Enterococcus
faecalis comb. nov. and Enterococcus faecium comb.
nov. International Journal of Systematic Bacteriology,
34: 31–34.
Špelina V., Schlemmerová L., Landfeld A., Kýhos K., Měřička P., Houška M. (2007): Thermal inactiva-tion of Enterococcus faecium. Czech Journal of Food Sciences, 25: 283–290.
Votava M. et al. (2003): Lékařská mikrobiologie spe-ciální. Neptun, Brno.
Weigel L.M., Clewell D.B., Gill S.R. et al. (2003): Genetic analysis of a high level vancomycin-resis-tant isolate of Staphylococcus aureus. Science, 302: 1569–1571.
Zanoni B., Garzaroli C., Anselmi S., Rondinini G. (1993): Modeling the growth of Enterococcus faecium in Bologna sausage. Applied and Environmental Mi-crobiology, 59: 3411–3417.
Received for publication April 18, 2008 Accepted after corrections May 18, 2009
Corresponding author:
Ing. Milan Houška, CSc., Výzkumný ústav potravinářský Praha, v.v.i., Radiová 7, 102 31 Praha 10-Hostivař, Česká republika