The soil structure (expressed by mean weight diameter (MWD)) is a key parameter that affects a wide range of soil properties and defines soil porous system (Amezketa 1999, An et al. 2010). Thus, the soil structure and its stability of aggre-gates determine soil hydraulic properties (Ksat), retention capacity and resistance to water ero-sion and overland flow (Bronic and Lal 2005). The MWD and Ksat are interrelated and they are strongly influenced by processes such as tillage, cropping systems, climate (Guérif et al. 2001), rainfall compaction (Legout et al. 2005); and af-fected by pedogenic processes, such as soil texture (Lado et al. 2004), soil type, weathering and mineral
composition (Kodešová et al. 2009). Soil erosion processes considerably affect soil stability within the morphologically diverse areas (Morgan 2005, Cantón et al. 2009, Zádorová et al. 2011, Jakšík et al. 2015). The virgin sites and sites that were under long-term grassing/left as fallow display greater aggregate stability than the cultivated ones (Golchin et al. 1995). This effect is linked to dif-ferent organic compounds (Spaccini et al. 2002), nutrient reserves (Zhang and Norton 2002), crop roots, fungal influences, plant exudates, microbial products (Chatigny et al. 1997, Kodešová et al. 2006). Most works dealing with this issue focus on the soil structure formation (Golchin et al. 1995,
Soil wetting effects on fallow and cropland in three different
soil types of the Czech Republic
O. Holubík
1,3, M. Hrabalíková
1,2, P. Huislová
1,2, J. Vopravil
11
Research Institute for Soil and Water Conservation, Department of Soil Science
and Soil Conservation, Prague, Czech Republic
2
Czech University of Life Sciences Prague, Faculty of Environmental Sciences,
Prague, Czech Republic
3
Czech University of Life Sciences Prague, Faculty of Agrobiology, Food and Natural
Resources, Prague, Czech Republic
ABSTRACT
This paper brings the comparison of characteristic changes of cropland and of land that has been left fallow for ten years. The disruption of soil structure (MWD) was tested and correlated with basic soil parameters (soil texture, soil hydraulic properties (Ksat), soil organic matter content (Cox), gentle acidification (pHKCl)). Sub-wetting pro-cesses of MWDs for three soil types (Chernozems, Cambisols, Luvisols) were tested and confronted with the results of a small-rainfall simulator in laboratory conditions. Statistically provable changes occurred on the plots of fallow land, i.e.: (i) decreased risk of water erosion and crustability (MWD), improvement of Ksat, a slight increase in Cox and the outset of pHKCl. The MWDs were poorly correlated (0.23–0.37%) with soil texture and highly (59%) with saturated hydraulic conductivity. The results of this paper confirmed that fallow lands/grass cover lands better in-filtrated rainfall and almost eliminated water erosion risk. The results of the detailed evaluation of MWDs and rain simulator for specific soil types presented an extremely high water erosion risk (and high slaking effect) for crop-land Luvisol. We have estimated that the soil loss of cropcrop-land Luvisol can reach up to 9 t/ha when there is 8-min torrential rain (on dry lands).
Keywords: land use; soil aggregate stability; mean weight diameter; soil crustability; small rainfall simulator
Kodešová et al. 2006) or erosion process (Morgan 2005, Cantón et al. 2009, Zádorová et al. 2011, Kadlec et al. 2012, Jakšík et al. 2015); some of them bring comparison of different soil types (Kodešová et al. 2009, 2011, Jirků et al. 2013). However, there are few studies which would evaluate the soil structure stability compared to the simulated rainfall measure-ment (Le Bissonnais et al. 1989, Legout et al. 2005) on fallow land sites.
The objectives of this study are: (i) to prove if there are statistically provable differences between the use of cropland and fallow land (ii) to analyse how the soil properties, such as soil texture, soil hydraulic properties (Ksat), soil organic matter con- tent (Cox), pHKCl have influenced the MWD value; (iii) evaluate the statistical difference of disruptive processes (MWDs) for three soil types and two land uses; (iv) verify results through experiments with small rain simulator and (v) discuss the risk of surface crust formation by slaking.
MATERIAL AND METHODS
Site descriptions. Six localities (Figure 1) were selected (Table 1) in the Czech Republic rep resent-ing the three important soil types, i.e. Chernozems (loam/sandy loam) – CH, Luvisols (silt loam) – LV and Cambisols (loam/silt loam) – CM (FAO 2014) (Table 1). The site selection represents a wide range of soil properties. However, these are typical soil properties in the Czech Republic (localisation described in Figure 1). The parent material for all evaluated haplic Cambisols was very similar – paragneiss (Table 1). Slight differences of the climatic conditions for the Haplic Cambisol were disregarded as well as the time variability of the soil structure (Jirků et al. 2013) during the vegeta-tion period was neglected in this paper.
Figure 1. Site localisation Tabl
e 1. S ite d es cr ip tio n So il ty pe 1 La
nd use
Sy m bo l Lo ca lit y So il sa m pl es Lo ca tio n 2 A pp ro x. sa m pl ed ar ea (h a) C lim at ic re gi on 3 D es cr ip tio n of c lim at e 4 M ea n an nu al pr ec ip ita tio n (m m ) M ea n an nu al te m pe ra tu re (°C ) A ve ra ge al tit ud e (m ) Pa rr en t m at er ia l/ bed ro ck H ap lic C he rn oz em s cr op la nd C H C N ač er at ic e 11 X : 1 6. 12 55 Y: 4 8. 80 62 15 0 T 4 ve ry w ar m an d dr y 55 0 9. 5 24 0 lo es se s fa llo w la nd C H F 2 10 H ap lic Lu vi so ls cr op la nd LV C Př iš im as y 3 X : 1 4. 74 85 Y: 5 0. 05 57 5 M T 10 m ild ly w ar m an d dr y 60 6 8. 4 31 2 lo es s an d lo es s lo am fa llo w la nd LV F 3 5 H ap lic C am bi so ls cr op la nd C M C Z de bu ze ve s 3 X : 1 4. 96 14 Y: 4 9. 77 91 5 M T 10 m ild ly w ar m and s lig ht ly dr y 62 5 8. 0 42 3 m ol da nu bi cu m pa ra gn ei ss / re gi on al m et am or ph os is of p ro te ro zo ic s se di m en ts fa llo w la nd C M F 3 5 cr op la nd C M C N eb ře ni ce 9 X : 1 4. 61 29 Y: 4 9. 94 37 35 M T 10 62 3 7. 8 45 7 fa llo w la nd C M F 4 10 cr op la nd C M C Č er ni čí 7 X : 1 5. 08 35 Y: 4 9. 62 05 12 M T 9 m ild ly w ar m an d w et 72 4 7. 3 51 2 cr op la nd C M C D ob ré p ol e 3 X : 1 4. 91 28 Y: 4 9. 99 43 3 M T 9 59 1 8. 4 39 0
1Soil ty
pe ac cor ding t o F A O (2014);
2WGS84 c
oor
dina
te s
yst
em;
3Clima
tic r
eg
ion def
ine
d by Q
uit
t (1971);
4Clima
tic r eg ionali za tion de sig ne
d by M
ora
ve
c and V
oty
pk
[image:2.595.318.517.93.761.2]Soil sampling and analyses. Soil samples were collected during the summer time between the years 2010–2012 from the upper soil horizons at the depth of 10–20 cm. The fallow land represents the land that was left fallow, providing habitats for the development of free succession for 10 years. In total the following number of samples were taken: 48 disturbed soil samples pre-treated by 2 mm sieve (ISO 11464, 2006) for determination of basic chemical parameters of the soil texture (ISO 11277, 2009), Cox – total oxidized carbon – TOC (ISO 14235, 1998) and analysis of poten-tiometric pH – measured in 1 mol/L KCl so-lution (ISO 10390, 2005) and 48 samples with undisturbed soil structure for MWDs testing (Le Bissonais 1996) were taken. Furthermore, 34 soil cores (100 cm3) for constant head saturated
hydraulic conductivity measurement (ISO/CSN 721020, 1991) were sampled. The soil cores on the Nebřenice site were not collected. All samples were taken at the same time close to each other (from 1 m2 of a sampling area).
For MWD index 5–10 g of air dried aggregates (3–5 mm) were tested by three mechanisms: (i) fast wetting – MWD (A): dry aggregates were suddenly wetted into 50 cm3 of distilled
wa-ter for 10 min, aggregates were disintegrated by entrapped air (slaking process)/simulation of heavy rainfall; (ii) slow wetting – MWD (B): dry aggregates were placed on Bultex® material (d = 30 kg/m3), wetted by capillary elevation forces,
the slaking was restricted in order to simulate the gently rain; (iii) mechanical disaggregation – MWD (C): the aggregate was firstly stabilised in 50 cm3 of
EtOH (30 min), decanted and gently immersed into 200 cm3 of distilled water in a 250 cm3 flask, and
mechanically disturbed by slaking (10 times upside down). All of the wet aggregates were stabilised, 5 times being immersed into 0.5 L of pure EtOH on 0.05 mm sieve according to Féodoroff (1958) method, gently oven-dried (40°C) and dry sieved and weighted in terms of fraction size (> 2; 1–2; 0.5–1; 0.2–0.5; 0.1–0.2; 0.05–0.1 mm).
The value of mean weight diameter (MWDj) were computed for each of the test (j = A, B, C) as follows:
MWDj =
Σ
7i=1XiWi (1) Where: Xi – mean aggregate size collected on the sieves (mm); Wi – weight distribution ratio. The MWD value is a mean of the three tests (n = 3) MWDj and were calculated as follows:The slaking effect (SE) for MWDs was calculated as follows:
For a small rainfall simulator (Kamphorst 1987) a laboratory experiment about 5 kg of presieved 3–5 mm air-dried aggregates where tested. Two wetting processes were simulated: (i) fast wetting similarly to MWD A with dry aggregate and (ii) slow wetting similarly to MWD B with wet aggregate (pre-wetted by capillary elevation on Bultex® materials for 30 min) within two subsequent 4-min cycles of a simulated rainfall with the intensity of 6 mm/min. The raindrops fell from the height of 400 mm, the diameter of drops was 5.9 mm, kinetic energy of rain was 4 J/m2/mm. The catching area 0.0625 m2
was covered with 100 mm layer of 3–5 mm aggregate which was placed in the slope of 4°.
Similarly to MWDs the slacking effect for simu-lated soil loss (SEsim) was calculated as follows:
(4)
Statistical evaluation of analyses. The values
of soil structure stability MWDs were correlated with selected soil parameters by Pearson’s cor-relation coefficients. The differences in the soil parameters between the land uses (cropland/fallow land) were tested by the Mann-Whitney pairwise test (comparing two independent samples). The data of MWDs distribution of each soil type and their land uses were processed by two-way analysis of variance (ANOVA); multiple comparison pro-cedures (post-hoc testing) were performed by the Scheffe’s test. All measurements were statistically evaluated at the level of confidence (α = 0.05) by Statistica 10 software (StatSoft 2012).
RESULTS AND DISCUSSION
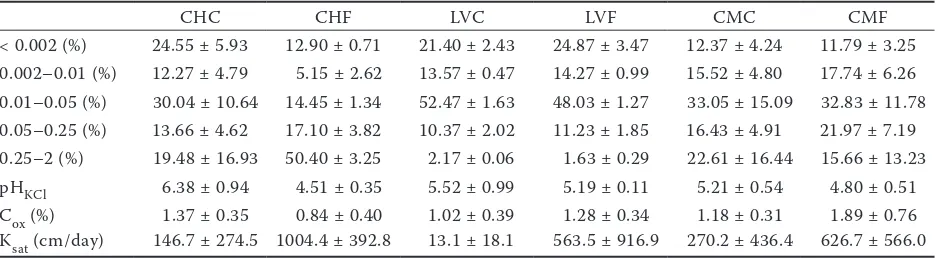
The basic soil properties (Table 2) have shown a typ-ical, relatively high content of fine silt (0.01–0.05 mm) for Luvisols, which is logically related to soil sub-strate/loess loam (Table 1) and predetermines these soils to crustability and high erosion risk (Morgan 2005).
The resulting correlation of MWDs with basic soil properties (Table 3) has shown a poor
cor-(2)
(3) 𝑀𝑀𝑊𝑊𝐷𝐷= 1𝑛𝑛 � 𝑀𝑀𝑊𝑊𝐷𝐷𝑀𝑀𝑛𝑛
𝑗𝑗=1
𝑆𝑆𝑆𝑆= [𝑀𝑀𝑀𝑀𝑀𝑀𝑀𝑀𝑀𝑀𝑀𝑀 ( (𝐴𝐴𝐴𝐴) +) –𝑀𝑀𝑀𝑀𝑀𝑀𝑀𝑀𝑀𝑀𝑀𝑀 ( (𝐵𝐵𝐵𝐵)])
relation of coarse texture slightly under the sig-nificance level (α < 0.05). The positive correlation trends are demonstrated in bigger particles of fine and coarse sands (0.05–2.0 mm) and negative in smaller texture categories (< 0.05 mm), including the clay particles. Many of these differences could be explained by high dependency of MWD on the content of large sand particles (Kodešová et al. 2009), when a gravel particle > 2 mm is counted in MWD stable fraction. A significant spatial and topographic difference of sites caused a wide range of TOC fluxes and low correlation with MWD. The measurement of TOC (Cox) content may not be a sufficiently discriminating factor. It is, above all, the quality of organic particles that plays a crucial part in forming the soil structure (Spaccini et al. 2002). A high negative correlation of exchange soil reaction (pHKCl) and a highly positive cor-relation of saturated hydraulic conductivity (Ksat) with MWD (52%, resp. 59%; Table 2) is surely related to an accelerated development of vascular plants on the fallow land. The detrit acid from the plant affects soil reaction (Percival et al. 2000), the development of plant roots, expansion of soil microorganisms and filamentous fungi, and their exudates and excrements, which dominantly form a soil structure (Bast et al. 2014) and improve soil
pore system and hydraulic properties (Kodešová et al. 2011).
Statistically significant changes occurred on plots of land 10 years after discontinuing agricul-tural production (Figure 2); above all, there was a significant soil structure stabilisation (MWD, Figure 2a) and an increase in infiltration potential (Ksat, Figure 2b) as well as a statistically provable increase in organic matter (Figure 2c) and even a slight soil acidification (Figure 2d).
All these effects are reflected in the MWD de-tailed evaluation (Figure 2), where the grass cover of the fallow land has decreased the erosion risk for every evaluated soil type.
[image:4.595.64.533.113.242.2]High proportions of disintegrated particles are most apparent for the soil type Luvisol when comparing the different breaking mechanisms of MWDs for three soil types (Figure 2). In the most destructive test/fast wetting process, it was the Luvisol soil type which resulted in lowest parti-cles (0.23 ± 0.03 mm, compared to CHC 0.56 ± 0.29 mm and CMC 0.89 ± 0.40 mm, Figure 2). The risk of crustability in the silty rich soil type is very high if the vegetation cover is not suffi-cient (Amezketa et al. 1996). On the other side, the Cambisols are more tolerable to heavy rain and show a variable risk of erosion (Figure 2). The difference Table 2. Soil properties
CHC CHF LVC LVF CMC CMF
< 0.002 (%) 24.55 ± 5.93 12.90 ± 0.71 21.40 ± 2.43 24.87 ± 3.47 12.37 ± 4.24 11.79 ± 3.25 0.002–0.01 (%) 12.27 ± 4.79 5.15 ± 2.62 13.57 ± 0.47 14.27 ± 0.99 15.52 ± 4.80 17.74 ± 6.26 0.01–0.05 (%) 30.04 ± 10.64 14.45 ± 1.34 52.47 ± 1.63 48.03 ± 1.27 33.05 ± 15.09 32.83 ± 11.78 0.05–0.25 (%) 13.66 ± 4.62 17.10 ± 3.82 10.37 ± 2.02 11.23 ± 1.85 16.43 ± 4.91 21.97 ± 7.19 0.25–2 (%) 19.48 ± 16.93 50.40 ± 3.25 2.17 ± 0.06 1.63 ± 0.29 22.61 ± 16.44 15.66 ± 13.23 pHKCl 6.38 ± 0.94 4.51 ± 0.35 5.52 ± 0.99 5.19 ± 0.11 5.21 ± 0.54 4.80 ± 0.51 Cox (%) 1.37 ± 0.35 0.84 ± 0.40 1.02 ± 0.39 1.28 ± 0.34 1.18 ± 0.31 1.89 ± 0.76 Ksat (cm/day) 146.7 ± 274.5 1004.4 ± 392.8 13.1 ± 18.1 563.5 ± 916.9 270.2 ± 436.4 626.7 ± 566.0
[image:4.595.63.531.680.728.2]Data reported as means ± standard deviation. CHC – Chernozems/cropland; CHF – Chernozems/fallow-land; LVC – Luvisols/cropland; LVF – Luvisols/fallow-land; CMC – Cambisols/cropland; CMF – Cambisols/fallow-land
Table 3. The Person’s correlation coefficients mean weight diameter (MWD) with basic soil parameters Soil
parameter
< 0.002 0.002–0.01 0.01–0.05 0.05–0.25 0.25–2
pHKCl Cox Ksat (mm)
MWDs correl. coeff. –0.310 –0.229 –0.370* 0.346* 0.363* –0.518* –0.088 0.588*
between the cropland and the fallow land is deep-ened within each soil type when the low destruc-tive process impacted soil surface (slow wetting). Within the slow wetting process, an interesting stabilising effect was recorded in crop treatment on Chernozems (1.35 ± 0.43 mm, Figure 2). This effect can be attributed to mutual effect of two stabilisation (binding) agents: (i) soil organic matter and/or (ii) bivalent Ca organic coating and infilling (Spaccini et al. 2002). The MWD values of crop treatment on Cambisols (CMC) are comparable to Chernozems (CHC), higher for fast wetting and lower for slow wetting and mechanical disaggregation (Figure 2). However, the cause is different. The soil texture
plays a key role in Cambisols – weathering of parent material – paragneiss (Table 1)/source of free Fe, Al oxides or/and Si-O binding agents throughout sol-gel processes (Barral et al. 1998).
There is low relevance of the results for fallow land Chernozems (CHF), which relates to the physical difference of this site and refers to the fact that lands left as fallow are frequently shal-low/eroded soils with low productive potential (moreover often used as an illegal dumping at high risk of pollution).
[image:5.595.63.332.95.366.2]Disintegration of soil structure was physically checked by testing soil aggregates on a small rain-fall simulator (Table 4).
[image:5.595.64.365.576.751.2]Figure 2. Two-way ANOVA were processed for each mean weight diameter (MWD) test separatelly; different letters above bars indicate signifi-cant differences of Sheffe’s test among six categories: CHC – Chernozems/cropland; CHF – Chernozems/fallow-land; LVC – Luvisols/cropland; LVF – Luvi-sols/fallow-land; CMC – Cambi-sols/cropland; CMF – Cambisols/ fallow-land
Figure 2. T-tests of (a) mean weight diameter (MWD); (b) soil hydraulic properties (Ksat); (c) soil organic matter content (Cox) and (d) pHKCl; P-value < 0.05 detected a statisti-cal significant difference on 0.95 level of confidence. SE – standard error
M
W
D
(m
m
)
Cox
(%
)
Ksa
t
(m
/s
)
pH
KC
l
(a) (b)
(c) (d)
Cropland Fallow land
Cropland Fallow land
Cropland Fallow land
Cropland Fallow land P = 0.026259 P = 0.005720 P = 0.000000
P = 0.032316
(m
m
)
MWD MWD (A) MWD (B) MWD (C)
The rainfall simulation (Table 4) confirmed ero-sion risks of MWDs through extreme soil losses for Luvisols (259 g/m2 for D1, resp. 610 g/m2 for
D2; Table 4). The potential soil loss after two rainfall cycles on a dry soil (D1 + D2) can be esti-mated for Luvisols at about 8.7 t/ha compared to Chernozems (2.2 t/ha) and Cambisols (0.3 t/ha). It was confirmed that the silty soils show a high erosion risk and gravel soils buffer slaking and eliminate soil crust formation (Le Bissonnais et al. 2007, Chaplot and Cooper 2015). The results from the rainfall simulator (Table 4) only partially proved the stabilisation effect in gentle rain situ-ations (slow wetting process) for Chernozems.
The slaking effects (SE and SEsim, Table 5) were quantified as well as their role in soil disintegration processes (Le Bissonnais et al. 2007).
Within the Luvisol soil type which is the most threatened by erosion (Table 5), the proportion of slaking effect on the final MWD value is little less than 33%. However, it follows from the results of simulated rainfall that slaking effect causes
enormous damage in Luvisols as a result of soil loss of particles (from 81%, resp. 88%; Table 5, compared to Chernozems and Cambisols). The stabilisation effect of Chernozems is manifested only within the first simulated rainfall (SEsim (1); 43%, Table 5), when rainfall is repeated, it causes up to 79% of removing soil particles from a simulated area (similarly to Cambisols). As presumed, the lowest proportions of slaking effect are demon-strated in Cambisols. Gravel soils (CM) are not subject to the slaking phenomenon. It is presumed that the main impact on soil disaggregation is caused by the mechanical breakdown by raindrop (Le Bissonnais et al. 2007).
[image:6.595.65.532.113.309.2]The results of slaking indicate the resistance to erosion and warn against a high erosion risk of cropland soils, especially Luvisol, without fully covered soil by vegetation, when it is rapidly wet-ted. In the Czech Republic there is a phenomenon of soil crusting formation for silty soils enhanced by soil compaction and declining quality of soil organic matter.
Table 4. Small-rainfall simulation testing
Soils type aggregate Type of Rain time (min) Treatment runoff (L)Surface Soil loss (g) Infiltration (mm) Infiltration (%) Soil loss (g/m2)
Haplic
Chernozems (CH)
dry 48 D1 D2 0.0631.190 11.971.65 23.107.05 9629 191.5226.40
wet 48 W1 W2 0.4750.720 0.661.41 17.2413.75 7257 10.5622.56
Haplic Luvisol (LV)
dry 48 D1D2 0.4701.360 16.2038.15 17.314.63 7219 259.20610.40
wet 48 W1W2 1.0001.470 1.672.45 9.763.07 4113 26.7239.20
Haplic Cambisol (CM)
dry 48 D1D2 0.2200.950 0.281.51 20.8710.47 8744 24.164.48
wet 48 W1W2 0.2600.590 0.430.08 20.3015.60 8565 6.881.28
Table 5. The slaking effects of mean weight diameter (MWDs) and rain simulations
Character CHC CHF LVC LVF CMC CMF
Slaking effect of MWDs 0.41 0.09 0.33 0.34 0.13 0.23
Slacking effect of simulated soil lossafter first 4 min. rain 0.43 – 0.81 – 0.21 – Slacking effect of simulated soil loss after second rain 0.79 – 0.88 – 0.90 –
[image:6.595.64.533.664.728.2]REFERENCES
Amézketa E. (1999): Soil aggregate stability: A review. Journal of Sustainable Agriculture, 14: 83–151.
Amezketa E., Singer M.J., Le Bissonnais Y. (1996): Testing a new procedure for measuring water-stable aggregation. Soil Science Society of America Journal, 60: 888–894.
An S.S., Mentler A., Mayer H., Blum W.E.H. (2010): Soil aggrega-tion, aggregate stability, organic carbon and nitrogen in different soil aggregate fractions under forest and shrub vegetation on the Loess Plateau, China. Catena, 81: 226–233.
Barral M.T., Arias M., Guérif J. (1998): Effects of iron and organic matter on the porosity and structural stability of soil aggregates. Soil and Tillage Research, 46: 261–272.
Bast A., Wilcke W., Graf F., Lüscher P., Gärtner H. (2014): The use of mycorrhiza for eco-engineering measures in steep alpine environ-ments: Effects on soil aggregate formation and fine-root develop-ment. Earth Surface Processes and Landforms, 39: 1753–1763. Bronick C.J., Lal R. (2005): Soil structure and management: A review.
Geoderma, 124: 3–22.
Cantón Y., Solé-Benet A., Asensio C., Chamizo S., Puigdefábregas J. (2009): Aggregate stability in range sandy loam soils relationships with runoff and erosion. Catena, 77: 192–199.
Chantigny M.H., Angers D.A., Prévost D., Vézina L.-P., Chalifour F.-P. (1997): Soil aggregation and fungal and bacterial biomass under annual and perennial cropping systems. Soil Science Society of America Journal, 61: 262–267.
Chaplot V., Cooper M. (2015): Soil aggregate stability to predict organic carbon outputs from soils. Geoderma, 243–244: 205–213. FAO (2014): World Reference Base for Soil Resources 2014. World
Soil Resources Reports No. 106. Rome, FAO.
Féodoroff A. (1958): Un appareil pour le tamisage de la terre sous l’eau. Ann. Agr., No.4, 537–548.
Golchin A., Oades J.M., Skjemstad J.O., Clarke P. (1995): Structural and dynamic properties of soil organic-matter as reflected by 13C
natural-abundance, pyrolysis mass-spectrometry and solid-state
13C NMR-spectroscopy in density fractions of an oxisol under
forest and pasture. Australian Journal of Soil Research, 33: 59–76. Guérif J., Richard G., Dürr C., Machet J.M., Recous S., Roger-Estrade
J. (2001): A review of tillage effects on crop residue management, seedbed conditions, and seedling establishment. Soil and Tillage Research, 61: 13–32.
Jakšík O., Kodešová R., Kubiš A., Stehlíková I., Drábek O., Kapička A. (2015): Soil aggregate stability within morphologically diverse areas. Catena, 127: 287–299.
Jirků V., Kodešová R., Nikodem A., Mühlhanselová M., Žigová A. (2013): Temporal variability of structure and hydraulic properties of topsoil of three soil types. Geoderma, 204–205: 43–58. Kadlec V., Holubík O., Procházková E., Urbanová J., Tippl M. (2012):
Soil organic carbon dynamics and its influence on the soil erod-ibility factor. Soil and Water Research, 7: 97–108.
Kamphorst A. (1987): A small rainfall simulator for the determi-nation of soil erodibility. Netherlands Journal of Agricultural Science, 35: 407–415.
Kodešová R., Kodeš V., Žigová A., Šimůnek J. (2006): Impact of plant roots and soil organisms on soil micromorphology ad hydraulic properties. Biologia, 61: S339–S343.
Kodešová R., Rohošková M., Žigová A. (2009): Comparison of ag-gregate stability within six soil profiles under conventional tillage using various laboratory tests. Biologia, 64: 550–554.
Kodešová R., Jirků V., Kodeš V., Mühlhanselová M., Nikodem A., Žigová A. (2011): Soil structure and soil hydraulic properties of Haplic Luvisol used as arable land and grassland. Soil and Tillage Research, 111: 154–161.
Lado M., Ben-Hur M., Shainberg I. (2004): Soil wetting and texture effects on aggregate stability, seal formation, and erosion. Soil Science Society of America Journal, 68: 1992–1999.
Le Bissonnais Y. (1996): Aggregate stability and assessment of crust-ability and erodibility: I. Theory and methodology. European Journal of Soil Science, 47: 425–437.
Le Bissonnais Y., Bruand A., Jamagne M. (1989): Laboratory ex-perimental study of soil crusting: Relation between aggregates breakdown and crust structure. Catena, 16: 377–392.
Le Bissonnais Y., Blavet D., De Noni G., Laurent J.-Y., Asseline J., Chenu C. (2007): Erodibility of Mediterranean vineyard soils: Relevant aggregate stability methods and significant soil variables. European Journal of Soil Science, 58: 188–195.
Legout C., Leguédois S., Le Bissonnais Y. (2005): Aggregate break-down dynamics under rainfall compared with aggregate stability measurements. European Journal of Soil Science, 56: 225–238. Moravec D., Votypka J. (1998): Climatic regionalization of the Czech
Republic. Prague, Carolinum – Charles University, 1, 87. Morgan R.P.C. (2005): Soil Erosion and Conservation. 3rd Ed. Oxford,
Blackwell Publishing.
Percival H.J., Parfitt R.L., Scott N.A. (2000): Factors controlling soil carbon levels in New Zealand Grasslands: Is clay content impor-tant? Soil Science Society of America Journal, 64: 1623–1630. Quitt E. (1971): Climatic Regions of Czechoslovakia. Brno, Academia,
Studia Geographica 16, GU CSAV, 73.
Spaccini R., Piccolo A., Conte P., Haberhauer G., Gerzabek M.H. (2002): Increased soil organic carbon sequestration through hydrophobic protection by humic substances. Soil Biology and Biochemistry, 34: 1839–1851.
StatSoft (2012): Statistica – Data Analysis Software System. Version 10.0. Available at: www.statsoft.com
Zádorová T., Jakšík O., Kodešová R., Penížek V. (2011): Influence of terrain attributes and soil properties on aggregate stability. Soil and Water Research, 6: 111–119.
Zhang X.C., Norton L.D. (2002): Effect of exchangeable Mg on satu-rated hydraulic conductivity, disaggregation and clay dispersion of disturbed soils. Journal of Hydrology, 260: 194–205.
Received on June 1, 2015 Accepted on May 10, 2016
Corresponding author: