Improving phosphorus use efficiency for snap bean
production by optimizing application rate
G.D. Liu
1,
K. Morgan
2, B. Hogue
1, Y.C. Li
3, D. Sui
41
Horticultural Sciences Department, IFAS, University of Florida, Gainesville, USA
2
Soil and Water Science Department, Southwest Florida Research and Education Center,
IFAS, University of Florida, Immokalee, USA
3
Soil and Water Science Department, Tropical Research and Education Center,
IFAS, University of Florida, Homestead, USA
4
Palm Beach County Cooperative Extension, IFAS, University of Florida,
West Palm Beach, USA
Abstract
Liu G.D., Morgan K., Hogue B., Li Y.C., Sui D. (2015): Improving phosphorus use efficiency for snap bean pro-duction by optimizing application. Hort. Sci. (Prague), 42: 94–101.
Phosphorus (P) is essential for crop production. Adequate application P rate is critical for enhancing productivity and profitability of snap bean (Phaseolus vulgaris L.). The goal of this study was to optimize P application rate for commer-cial snap bean production in south Florida. Six trials were conducted on sandy soils and muck soils in Hendry County and Palm Beach County, Florida, USA. Before planting cv. Caprice snap bean, plots were fertilized with different P application rates in the form of triple superphosphate (0-45-0). An increase in P2O5 application rates up to 134 kg/ha P2O5 significantly increased the marketable bean yields. However, beyond that point, significant field gains did not oc-cur with further increased application. At 134 kg/ha P2O5, bean appearance quality was the best compared to the other treatments. These results indicate that 134 kg/ha P2O5 produced best bean appearance quality and was the optimum rate for commercial production of snap bean in high-pH soils in south Florida.
Keywords: Phaseolus vulgaris; optimum phosphorus rate; productivity; marketable bean yields; bean appearance quality
Florida is a leader in the P-fertilizer production industry and provides 75% of P fertilizers to the US and 25% to the world (Grego 2001). However, economically viable phosphate rock in Florida and over the world will be depleted in a few decades (Raghothama 1999; Cordell et al. 2009). Global P fertilizer shortages have already occurred and the Florida P fertilizer industry has begun importing P rock from Morocco and other countries (Abel-son 1999; Cordell et al. 2009). Because only a few countries are relatively rich in P-rock resources, a
new Organization of Phosphate Exporting Coun-tries (OPEC) may arise in the near future (Epstein, Bloom 2005). This depletion of P mineral resourc-es requirresourc-es growers to modify current agricultural practices to use P fertilizers more efficiently than ever before.
Because the Everglades is extremely oligotrophic, the U.S. Environmental Protection Agency (USEPA) has determined that annual and/or long-term P con-centration needs to be less than 10 parts per billion (ppb) to protect native flora and fauna (Payne et al. 2003). However, P concentrations of ground water in the Everglades have been as high as 600 ppb in the wet season but only 10 ppb in the dry season (Mu-ñoz-Carpena et al. 2005). As a nonpoint source of pollution, crop production contributes to the high P concentrations in these waterways. To protect the environment from excessive P and vegetation shifts (e.g. cattail replacing sawgrass in the Everglades (McCormick et al. 2009)), optimizing P manage-ment in agricultural is crucial.
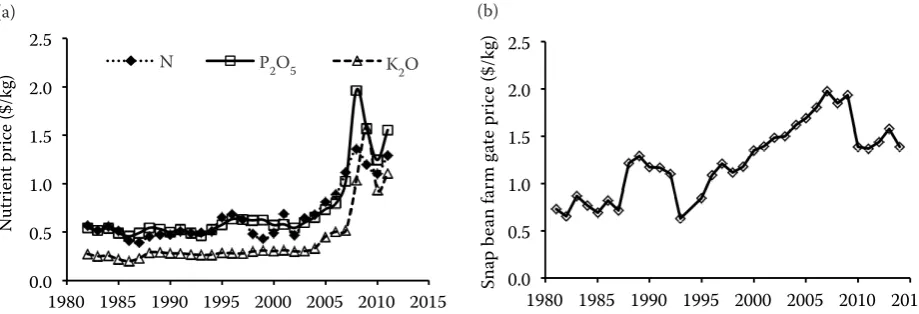
While ecology and P mineral source availability both point to the reduction in P fertilizer application rates, economics is the key factor for us to maximize P use efficiency in crop production. According to the United States Department of Agriculture (USDA) National Agricultural Statistics Service (USDA 2012), fertilizer prices have escalated by approxi-mately 500% since 2000, while market prices of snap beans have only increased by 50% (Fig. 1). This di-vergent trend of production costs and market prices of snap beans is attributed to different reasons: (1) an increase in fertilizer costs due to globally rising energy prices and (2) US food policy of keeping the price of food as low as possible. Therefore, snap bean growers are forced to operate on increasingly thin-ner profit margins, making the efficient use of P im-perative to achieve long-term profitability.
Snap bean is a major vegetable crop in the United States. Florida ranks first in production, acreage, and total value of fresh market in the nation (FDACS
2011; Elwakil, Mossler 2012). South Florida is the principal region of snap bean production in the state. Fertilization is critical for growing snap bean in this region because sandy soils are water repellent and poor at holding water and nutrients (Hallett 2008; Hall 2009). OnceP fertilizers are applied to the soil, they have one of four fates: plant uptake, soil fixation, runoff, and leaching. Phosphorus up-take by snap bean has been reported to be as high as 17.9 kg/ha at bean yields of 11,200 kg/ha (Maynard, Hochmuth 2013). In Florida, snap bean yields are usually lower than 11,200 kg/ha. Therefore, the P uptake by snap bean was expected to be less than 17.9 kg/ha. Phosphorus that is not utilized by plants can cause eutrophication problems in surrounding ecosystems, the Everglades.
For selected plant nutrients, the University of Florida – Institute of Food and Agricultural Sci-ences (UF/IFAS) has developed a range of nutri-ent specific soil concnutri-entrations into classifications called indices of very low, low, medium, high and very high using data collected in field (Olson et al. 2011; Hochmuth, Hanlon 2013). The developed range of nutrient concentrations in the soil is based on the response of the crop growth and yields to a wide range of nutrient fertilizer applications in a large number of field studies. However, these indices were developed for the acidic sandy soils that typify Florida agriculture. Use of these indi-ces have proved to be problematic in south Florida where sandy soils have increased in pH with con-tinuous production (Sato et al. 2008). Particularly, in muck soil, soil pH can gradually increase with time because the organic matter decomposes and muck subsidence causes proximity to the
0.0
0.5 1.0 1.5 2.0 2.5
1980 1985 1990 1995 2000 2005 2010 2015
N
utr
ien
t pr
ic
e ($/kg)
N P2O5 K2O
0.0 0.5 1.0 1.5 2.0 2.5
1980 1985 1990 1995 2000 2005 2010 2015
Sna
p b
ean f
ar
m g
at
e pr
ic
e ($/kg)
0.0 0.5 1.0 1.5 2.0 2.5
1980 1990 2000 2010 2020
N
utr
ien
t pr
ic
e ($/kg)
N P2O5 K2O
0.0 0.5 1.0 1.5 2.0 2.5
1980 1985 1990 1995 2000 2005 2010 2015
Sna
p b
ean f
ar
m g
at
e pr
ic
[image:2.595.66.526.561.718.2]e ($/kg)
Fig. 1. Changes in fertilizer prices for Freight on Board (a) and in the farm gate snap bean price (b) during last 30 years from 1982 to 2011 (USDA 2012)
(a) (b)
N P2O5 K2O
95
Hort. Sci. (Prague) Vol. 42, 2015 (2): 94–101
ing calcareous material (Liu et al. 2013). Likewise, indices for vegetable production on soil with high levels of organic matter such as muck soil have not been developed. To ensure P-use efficiency and en-hance economic and ecological sustainability, the UF/IFAS recommends a P rate for snap beans from 90 to 134 kg/ha, based on the P bioavailability in-dex of medium (i.e. 30 mg/l or less) in Florida acidic sandy soils (Hochmuth, Hanlon 2013). Howev-er, producers have traditionally applied P fertiliz-ers in excess as a means of insuring adequate soil P concentrations for their crops. Current practices use 224.0 kg/ha on commercial vegetable farms in south Florida (personal communication with local farmers). The objective of this study was to opti-mize P fertilizer application rates for commercial snap bean production in south Florida.
MATERIAL AND METHODS
Two sets of studies were conducted. The first set was performed at two farms with high pH soils (pH > 7.0) and initial extractable soil P exceeding the medium index to investigate the response of biomass and yield to added fertilizer P. The second set was conducted to determine the response of snap bean plants to P2O5 rates and optimize P application rate.
Hendry County. Studies were initiated at two
farms in eastern Hendry County, Florida from Sep-tember 2008 to May 2010 on sandy, poorly drained Spodisols classified as Immokalee fine sand (Sandy, siliceous, hyperthermic Arenic Alaquods). The first farm was located at latitude 26°26'58.98"N, longitude 80°58'54.06"W and second farm was at latitude 26°28'59.65"N, longitude 80°58'54.26"W. The same blocks were used twice at each farm. Two crops planted at the first farm were grown from October 23 to December 12, 2008 (Hen-ry 1) and February 12 to April 25, 2010 (Henry 2). The initial Mehlich III (Sims 1989) extractable soil P was 57 and 81 mg/kg for the two trials, re-spectively, with a pH of 7.3 ± 0.1. Two additional crops of snap bean were grown at the second farm from February 28 to May 3, 2009 (Henry 3) and March 12 to May 10, 2010 (Henry 4). Initial Me-hlich III extractable soil P was 87 and 63 for the two trials, respectively, with a soil pH of 7.1 ± 0.1. Four rates (0, 45, 67, and 90 kg/ha) of phosphate fertilizer as triple superphosphate were used at each site. Each plot was 6 rows wide and 150 to
210 m long depending on field location. Row spac-ing was 76.2 cm while in-row spacspac-ing was 5.1 cm accounting for 258,325 seeds/ha. The P fertilizer was applied and incorporated in the soil during the pre-bedding and bedding operation. With the ex-ception of four selected P rates the other fertilizer rates (kg/ha) and practices were: N as ammonium nitrate, 90.1, pre-planting broadcasting: 12.3; at seeding, 24.6; 25 days after seeding: 53.2; K as po-tassium chloride, pre-planting broadcasting: 137.8; Mn as manganese sulfate, 2.4; Zn as zinc sulfate, 1.7; Cu as copper sulfate, 1.7; B as borax, 1.7; and all of K; all of the micronutrients were evenly foliar-applied at bud and pin stages.
Biomass accumulation at harvest was determined by cutting plant stems above the soil surface. Mar-ketable bean pods as yield were removed from the cut plants and weighed fresh in the field (USDA 2002). The entire shoot (the above ground portion of the plant) was then dried 65°C with ventilation until constant weights are reached. The stems and leaves were separated before drying and weighed. Biomass and yield was determined using three 3-m lengths of single row sub-samples for snap bean within each plot.
Palm Beach County. Two trials were conducted
on two commercial farms in Palm Beach County, Florida. The first trial was conducted from No-vember 21, 2011 to February 1, 2012 at latitude 26°42'59.36"N, longitude 80°50'42.46"W. The soil in this farm is muck soil (Typic Haplohemists, euic, hyperthermic) with a pH of 6.0 ± 0.1. The second trial was conducted from March 1 to April 27, 2012 at latitude 26°48'16.12"N, longitude 80°26'31.26"W near the west bank of L8 Canal in the county. The soil is fine sand (Arenic Umbric Endoaqualfs, loamy, siliceous, active, hyperthermic) with a pH of 6.5 ± 0.1. Field management practices at each site were identical to the current procedures used by local snap bean producers (Olson, Simonne 2007). A randomized complete block design was applied using 56 m2 plots consisting of eight 9.1 m rows each with four replicates. Row spacing was 76.2 cm while in-row spacing was 5.1 cm account-ing for 258,325 seeds/ha. A commercial cultivar (Caprice) was grown with P rates of 0, 45 k, 90, 134, 179, 224, and 269 kg/ha P2O5 in the form of triple superphosphate (0-45-0) applied prior to planting. At harvest, the central 6.1 m of central rows 4 and 5 were harvested in each plot, accounting for a total of 9.3 m2 harvested in each plot. Marketable beans
were harvested with weights measured, while bean length and diameter from 30 randomly selected beans were determined with a ruler and a caliper in the second trial. At the same time, four plants per plot were randomly collected for P concentration and biomass measurements of the stems, leaves, and beans for individual plants.
Tissue and soil analysis. Biomass tissue samples
for all studies were based on an ash digestion method by Hanlon et al. (1994). Briefly, 200 mg of oven-dry (65°C for 5 days) plant tissue was placed in a muffle furnace at 550°C for 4 hours. The resulting ash was dissolved with 2.25 ml 6.0M hydrochloric acid (HCl), filtered through a Whatman No. 41 filter paper (VWR LabShop, Batavia, USA), and diluted to volume in a 50 ml volumetric flask with double deionized water. Soil samples from all studies were analysed for soil ex-tractable P content using the Mehlich III [1:10 (w:v)] method (Schroder et al. 2009) and analysed using an Inductively Coupled Plasma Atomic Emission Spectrometry (ICP-AES, Perkin Elmer, Waltham, USA) (Munter et al. 1984) for the Hendry County studies and an Automated Discrete Analyser (AQ2+; SEAL Analytical, Hanau, Germany) based on USEPA Method 365.1 (U.S. Environmental Protection Agen-cy 1993) for the Palm Beach County studies. Phos-phorus accumulation was calculated based on P con-centration and biomass of the plant tissues.
Data analysis. Data were analysed using one-way
ANOVA method (SAS Institute 2009), the critical ranges (LSD2, 0.05) of Duncan’s Multiple Range Test were used to detect the difference significance be-tween two means (Hubbard 2001).
RESULTS AND DISCUSSION
In Hendry County, both biomass and yield in-creased with added P rate (Fig. 2). Biomass and yield were both the highest values for most of the trials at 90 kg/ha but Henry 2 had the max. shoot biomass at 67 kg/ha and Henry 3 produced the max. bean yield also at 67 kg/ha. Among the four trials, Henry 4 was always on the top for both shoot biomass and bean yields but Henry 1 was always at the bottom for bean yields even though its shoot biomass were always the second greatest. These dif-ferences might be possibly attributed to the chang-es in carbon partitioning among the trials due to climatic and edaphological reasons.
In Palm Beach County, bean yields were in-creased with added P. Significant gains in bean yield were observed for both locations at Lake Harbor and Belle Glade with increasing P2O5 application rate from 0 to 134 kg/ha P2O5. Beyond the appli-cation rate of 134 kg/ha P2O5, neither site meas-ured significantly increases (Fig. 3). This differ-ence of bean yields observed from 134–269 kg/ha P2O5 were more likely due to the difference of the plant available P between the two different soils. The Mehlich III extractable P concentration before planting was 82.3 ± 5.7 ppm in the muck soil sam-ples (Lake Harbor) and was 37.8 ± 1.9 ppm in the fine sand soil (Belle Glade). Marketable bean yield was greater in the muck soil than in the fine sand soil (Fig. 3). Based on the bean yield trial data from both sites, 134 kg/ha P2O5 was the optimum appli-cation rate for snap bean productivity.
2,000
3,000 4,000 5,000 6,000 7,000
Sho
ot bioma
ss (no f
ruit
) (
kg/ha)
Henry 1 Henry 2
Henry 3 Henry 4
2,000 3,000 4,000 5,000 6,000 7,000 8,000 9,000
0 45 67 90
Be
an y
ie
ld (kg/ha)
P2O5 rate (kg/ha)
2,000 3,000 4,000 5,000 6,000 7,000
Sho
ot bioma
ss (no f
ruit
) (
kg/ha)
Henry 1 Henry 2
Henry 3 Henry 4
2,000 3,000 4,000 5,000 6,000 7,000 8,000 9,000
0 45 67 90
Be
an y
ie
ld (kg/ha)
[image:4.595.66.523.535.707.2]P2O5 rate (kg/ha)
Fig. 2. Snap bean biomass accumulation (a) and relative marketable yields (b) at different P rates at the farms near Clewiston; October 23 to December 12, 2008 (Henry 1) and February 12 to April 25, 2010 (Henry 2) and at the Thomas Produce site; February 28 to May 3, 2009 (Henry 3) and March 12 to May 10, 2010 (Henry 4) near Clewiston, Florida
(a) (b)
0 45 67 90
P2O5 rate (kg/ha)
97
Hort. Sci. (Prague) Vol. 42, 2015 (2): 94–101
Phosphorus concentrations measured in the plant tissues of snap bean were relatively consistent across all P2O5 treatments excluding the control with-out P application. Similarly, the concentrations and proportions of P in beans, leaves, and stems were not significantly different (Fig. 4). Absorption of P by snap bean plants was not significantly different across most treatments, when excluding the con-trol (0 kg/ha P2O5). Bean plants fertilized at both sites contained approximately 24.0 to 34.6 kg/ha P2O5. There was a decrease in plant absorbed P2O5 at the highest application rate in Lake Harbor, Florida. These results were similar to previous results in Flor-ida (Maynard, Hochmuth 2013). The plants of the controls, however, absorbed P2O5 less than 16.2 and
[image:5.595.69.510.93.251.2]16.6 kg/ha P2O5 for Lake Harbor and Belle Glade, re-spectively, indicating while P fertilization is critical for snap bean growth in these sites, more than half of available P utilized was already present before fertili-zation. In other words, only 7% (in a range from 2 to 17% in Lake Harbor) to 12% (in a range from 7 to 25% in Belle Glade) of P fertilization contributed to P accu-mulation in plant tissues. These data imply that there is much room for improvement regarding growers using P fertilizer efficiency in snap bean production. As a means of improving efficiency and long-term sustainability of agricultural practices in South Flor-ida, these data suggest a reduction from 224 kg/ha P2O5 (current grower application rates) to 134 kg/ha P2O5 (Fig. 3) would be appropriate.
Fig. 3. Snap bean marketable yields at different P rates (a) in Lake Harbor, Florida from November 21, 2011 to February 1, 2012 and (b) in Belle Glade, Florida from March 1 to April 27, 2012. The yields of the both trials followed a saturation law. P rate of 134 kg/ha P2O5 was the best
P = 0.05, LSD2, 0.05 = 459 kg/ha for Lake Harbor, Florida and P = 0.05, LSD2, 0.05 = 876 kg/ha for Belle Glade, Florida; data points
sharing the same letter indicate they are not significantly different
3,000
4,000 5,000 6,000 7,000 8,000 9,000
0 45 90 134 179 224 269
Be
an y
ie
ld (kg/ha)
P2O5 rate (kg/ha)
3,000 4,000 5,000 6,000 7,000 8,000 9,000
0 45 90 134 179 224 269
Be
an y
ie
ld (kg/ha)
P2O5 rate (kg/ha)
3,000
4,000 5,000 6,000 7,000
0 45 90 134 179 224 269
Be
an y
ie
ld (kg/ha)
P2O5 rate (kg/ha)
3,000 4,000 5,000 6,000 7,000 8,000 9,000
0 45 90 134 179 224 269
Be
an y
ie
ld (kg/ha)
P2O5 rate (kg/ha)
(a) (b)
(b)
Fig. 4. P accumulation of snap bean at different P rates in (a) trial 1 in Lake Harbor, Florida from November 21, 2011 to February 1, 2012 and (b) trial 2 in Belle Glade from March 1 to April 27, 2012
P = 0.05, LSD2, 0.05 = 4.0 kg/ha for Lake Harbor, Florida and P = 0.05, LSD2, 0.05 = 7.1 kg/ha for Belle Glade, Florida; histograms
sharing the same letter indicate they are not significantly different
0
3 6 9 12 15 18
kg P/ha
har
ve
st
ed Bean Leaf Stem
0 3 6 9 12 15 18
0 45 90 134 179 224 269
kg P/ha
har
ve
st
ed
P2O5 rate (kg/ha)
03 6 9 12 15 18
kg P/ha
har
ve
st
ed Bean Leaf Stem
0 3 6 9 12 15 18
0 45 90 134 179 224 269
kg P/ha
h
ar
ve
st
ed
P2O5 rate (kg/ha) (a)
D
C B
B A
A A A
C BC A AB AB AB
C B
A A A A
A A
AB AB AB AB AB
AB
kg P/ha har
ve
st
ed
0 45 90 134 179 224 269 P2O5 rate (kg/ha)
98
Vol. 42, 2015 (2): 94–101 Hort. Sci. (Prague)
[image:5.595.69.512.543.699.2]1,100 1,300 1,500 1,700 1,900 2,100 2,300 2,500
0 45 90 134 179 224 269
Be
an v
alue (US$)
P2O5 rate (kg/ha)
Yield without P
Accumulated response to P
Response to additional P
1,100 1,300 1,500 1,700 1,900 2,100 2,300 2,500
0 45 90 134 179 224 269
Be
an v
alue (US$)
P2O5 rate (kg/ha)
Total P accumulation (kg/ha) in snap bean plants grown in Belle Glade and in Lake Harbor was 7.1 and 7.2; 10.5 and 12.1; 10.7 and 12.6; 10.5 and 12.8; 10.2 and 14.8; 11.0 and 13.2; and 9.0 and 15.1 for the fer-tilizer P rates (kg/ha P2O5) of 0; 45; 90; 134; 179; 224; and 269, respectively (Fig. 4). The plants grown in Belle Glade always had greater P accumulation than those grown in Lake Harbor. The respective differ-ence (%) was 2.5; 15.9; 17.9; 22.7; 45.2; 20.7; and 68.4. These differences might be attributed to the shallow muck soil in Lake Harbor (Liu et al. 2013). This low-er P accumulation in the Lake Harbor site may ex-plain the little yield responses to P fertilization when P rates were greater than 134 kg/ha P2O5.
The IFAS recommendation for P fertilization is 0 for soils if the soil test shows high and very high P levels in soil and 90 to 134 kg/ha P2O5 if the soil
test indicates medium, low and very low P levels in the soil (Olson, Simonne 2007). The results of this research confirmed the IFAS recommendation. Fertilization based on the recommendation favours P use efficiency in agriculture significantly. The use efficiency of P fertilizers is related to soil property and hence soil P status (Antille et al. 2014). Obvi-ously, to further increase P fertilizer use efficiency, more research on soil P status in the soils needs to be done in the near future.
[image:6.595.68.527.91.258.2]The ratio of bean length to bean diameter (L/D value) is an important attribute for assessing bean appearance quality and is closely associated with bean length and width. Both bean appearance and weight increased with P fertilization increase while the bean length did not increase significantly when the P application rate was greater than 179.2 kg/ha Fig. 5. Changes in bean size (a) and ratio (b) of bean length to bean diameter value of beans at different phosphorus ap-plication rates in Belle Glade from March 1 to April 27, 2012
03 6 9 12 15 18
0 45 90 134 179 224 269
Bean size
P2O5 rate (kg/ha)
Weight (g) Diameter (mm) Length (cm)
17.5 18.0 18.5 19.0 19.5
0 45 90 134 179 224 269
Leng
th/diame
ter
ra
tio
P2O5 rate (kg/ha)
17.518.0 18.5 19.0 19.5
0 45 90 134 179 224 269
Le
ng
th
/d
ia
m
et
er
ra
tio
P2O5 rate (kg/ha)
17.5 18.0 18.5 19.0 19.5
0 45 90 134 179 224 269
Leng
th/diame
ter
P2O5 rate (kg/ha)
(a)
(a)
(b)
(b)
1,100 1,300 1,500 1,700 1,900 2,100 2,300 2,500
0 45 90 134 179 224 269
Be
an v
alue (US$)
P2O5 rate (kg/ha)
Yield without P
Accumulated response to P Response to additional P
1,100 1,300 1,500 1,700 1,900 2,100 2,300 2,500
0 45 90 134 179 224 269
Be
an v
alue (US$)
P2O5 rate (kg/ha)
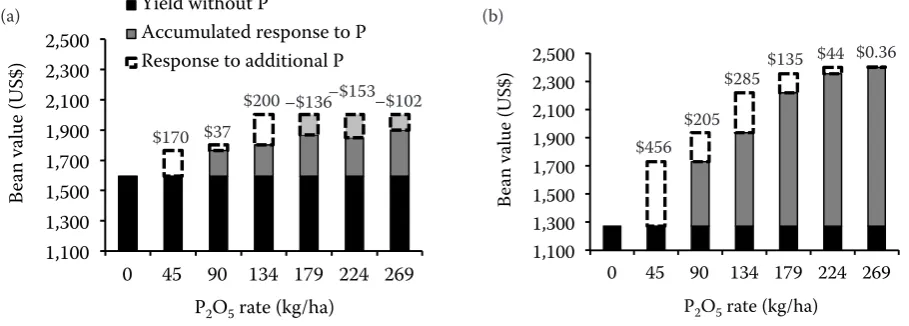
Fig. 6. Max. profit yield of snap bean at (a) Lake Harbor and (b) Belle Glade for different phosphorus application rates
calculations were based on $664/t triple superphosphate and $0.76/kg for snap beans. Each dotted rectangle represents the gain or loss, accompanied with an increased P rate. The value is shown above and represents a change from the the greatest value from subsequent lower P rates
$170 $37
$200 –$136–$153–$102
$456 $205
$285$135 $44 $0.36
P2O5 rate (kg/ha)
99
Hort. Sci. (Prague) Vol. 42, 2015 (2): 94–101
[image:6.595.64.519.538.701.2]P2O5, suggesting a possible max. length of 16 cm. Bean diameter, however, was almost unresponsive to P treatments from 0 to 134 kg/ha P2O5 but then increased when the P applications was greater than 134 kg/ha P2O5 (Fig. 5a). The L/D value peaked at 134 kg/ha P2O5 (Fig. 5b), the best bean length/di-ameter ratio and the optimum P rate for the profit-ability are the same: 134 kg/ha P2O5.
It is important to sustainably produce max. bean yields with best bean appearance quality. Ulti-mately, the factors must be balanced with both the production cost for maximum profit and minimum environmental impact. The increased application of P2O5 at both sites increased overall yields if ap-plication rate is lower than 134 kg/ha P2O5, howev-er, with the price of superphosphate being approxi-mately $665/t (USDA 2012), the increased cost of each treatment was $28.91. This combination of the yield data and the 2011 value for beans ($0.76/kg) (USDA 2012) reflects the max. yields and profit for each increment in approximately 45 kg/ha P2O5 (Fig. 6) more accurately.
It should be noticed that the control plots (0 kg/ha P2O5) produced greater bean yield at the Lake Harbor farm than at the Belle Glade farm (Fig. 3). However, the increase in profit yields for each level of increased P rate was greater at Belle Glade than at Lake Harbor. In particular, when the P rate was more than 134 kg/ha P2O5, the profit yields for Lake Harbor even de-creased while that for Belle Glade still showed an in-crease (Fig. 6). These observations suggest significant differences in the soil at the two farms in Palm Beach County, with Lake Harbor being able to retain more P enabling higher yields at low P rates but also decreas-ing bean yields at higher P rates. While there were dif-ferences in overall profit yields between the two sites, both sites displayed a decreasing profit with increas-ing P application rates above 59 kg/ha P (Fig. 6). These observations suggest that in soils that retain P, lower P rate of approximately 134 kg/ha P2O5 is best while in soils where P is more readily available after being ap-plied best P rates could vary between 134–224 kg/ha P2O5 (Fig. 6). No profit or economic loss calculation included possible environmental impacts.
CONCLUSION
Phosphorus fertilization is essential for snap bean production in south Florida. As available mineral resources decrease, the efficiency in P
fer-tilizer use must be increased. Current application rates up to 224 kg/ha P2O5are practiced in south Florida. Our studies in Henry County showed that increased fertilizer P2O5 rates from 0 to 90 kg/ha resulted in almost-consistent improvements in plant biomass and yields in the location. These re-sults indicated that optimum rate was at or greater than 90 kg/ha. Additional P2O5 rate trials conduct-ed in Palm Beach County showconduct-ed that a further in-creasing percentage more than 134 kg/ha P2O5 was not utilized by the plants since the plant’s nutrient requirement was satisfied. Bean length/diameter analysis showed that 134 kg/ha P2O5 produced the highest appearance quality beans. Phosphorus ac-cumulation in non-fertilized and fertilized snap bean plants ranged from approximately 16.2 to 16.6 and 20.5 to 34.6 kg/ha P2O5 for the Lake Har-bor and Belle Glade sites. These results indicated that P application rates greater than 134 kg/ha P2O5 did not produce significantly greater yields or quality snap beans; therefore the conclusion can be made that 134 kg/ha P2O5 was the best application rate with regards to profitability for commercial snap bean production in south Florida. Soil P status in the area needs to be further studied for maxi-mizing in P use efficiency for the crop production.
Acknowledgement
Hundley Farms in Palm Beach County, Mr. John Hundley, Mr. Andy Ballard and their crew of the farms kindly supported these research trials in two locations in Lake Harbor and Belle Glade from No-vember 2011 to April 2012. Professor Edward Han-lon at the University of Florida and Dr. Ashok Alva at USDA-ARS reviewed the manuscript and gave the authors valuable comments and suggestions to improve the manuscript.
References
Abelson P.H. (1999): A potential phosphate crisis. Science, 283: 2015.
Alva A.K., Obreza T.A. (1993): Variation in soil pH and cal-cium status influenced by microsprinkler wetting pattern for young citrus trees. HortScience, 28: 1166–1167. Antille D.L., Sakrabani R., Godwin R.J. (2014): Effects of
biosolids-derived organomineral fertilizers, urea, and bio-solids granules on crop and soil established with ryegrass (Lolium perenne L.). Communications in Soil Science and
Plant Analysis,45: 1605–1621.
Cordell D., Drangert J.-O., White S. (2009): The story of phosphorus: Global food security and food for thought. Global Environmental Change, 19: 292–305.
Eckert D.J., Watson M.E. (1996): Integrating the Mehlich III extractant into existing soil test interpretation schemes. Com-munications in Soil Science and Plant Analysis, 27: 1237–1249. Elwak W.M., Mossler M.A. (2012): Florida Crop/Pest Man-agement Profiles: Snap Beans. Pesticide Information Office, Agronomy Department, Florida Cooperative Extension Service, Institute of Food and Agricultural Sciences, Uni-versity of Florida. Available at http://edis.ifas.ufl.edu/pi032 Epstein E., Bloom A.J. (2005): Mineral Nutrition of plants:
Principles and Perspectives. 2nd Ed. Sunderland, Sinauer
Associates, Inc.
FDACS (2011): Florida Agricultural Crop Facts and Statistics Overview. Tallahassee, Florida Department of Agriculture and Consumer Services. Availabe at http://www.florida-agri-culture.com/brochures/P-01304.pdf (accessed Aug 20, 2014). Grego S. (2001): Phosphate Primer. Florida Industrial and
Phosphate Research Institute. Available at http://www.fipr. state.fl.us/about-us/phosphate-primer/introduction-phos-phate-as-an-essential-mineral/ (accessed April 21, 2015). Hall D. (2009): Water repellence. Managing South Coast
Sandplain soils to yield potential. Department of Agricul-ture and Food, Western Australia, Bulletin 4773: 48–63. Hallett P.D. (2008): A brief overview of the causes, impacts
and amelioration of soil water repellency: A review. Soil
and Water Research,3: S21–S29.
Hanlon E.A., Gonzalez J.S., Bartos J.M. (1994): Standard determination of Ca, Mg, P, K, Na, Mn, Cu, Fe, Zn, and B in plant tissue. In: Hanlon E.A. et al. (eds): IFAS Extension Soil Testing Laboratory Chemical Procedures and Training Manual. Cir 812. Gainesville, Florida Cooperative Exten-sion Service, IFAS, University of Florida.
Hochmuth G., Hanlon E. (2013): A Summary of N, P, and K Research with Snap Bean in Florida. Available at http:// edis.ifas.ufl.edu/cv234 (accessed Aug 20, 2014).
Hubbard M.R. (2001): Statistical Quality Control for the
Food Industry. 2nd Ed. Caithersburg, Aspen Publishers, Inc.
Liu G.D., Simonne E.H., Hochmuth G.J. (2013): Soil and Fertilizer Management for Vegetable Production in Florida. Available at http://edis.ifas.ufl.edu/pdffiles/CV/CV10100. pdf (accessed Oct 2, 2014).
Liu G.D., Sui D., Li Y.C. (2012): Optimizing phosphorus rate for the sustainability of commercial snap bean production in South Florida. Proceedings of Florida State Horticutural Society, 125: 158–161.
Maynard D.N., Hockmuth G.J. (2013): Knott’s Handbook for
Vegetable Growers (5th Ed.). Hoboken, John Wiley & Sons, Inc.
McCormick P.V., Newman S., Vilchek L.W. (2009): Landscape responses to wetland eutrophication: loss of slough habitat in the Florida Everglades, USA. Hydrobiologia, 621: 105–114. Muñoz-Carpena R., Ritter A., Li Y.C. (2005): Dynamic factor analysis of groundwater quality trends in an agricultural
area adjacent to Everglades National Park. Journal of
Con-taminant Hydrology, 80: 49–70.
Munter R.C., Halverson T.L., Anderson R.D. (1984): Quality assurance for plant tissue analysis by ICP-AES. Communi-cations in Soil Science and Plant Analysis, 15: 1285–1322. Olson S.M., Simonne E. (2007): Vegetable Production
Hand-book for Florida 2006–2007. Gainesville, UF-IFAS. Payne G., Bennett T., Weaver K. (2003): Development of a
numeric phosphorus criterion for the Everglades Protection
Area. Chapter 5. In:2002 Everglades Consolidated Report.
South Florida Water Management District, West Palm Beach. Raghothama K.G. (1999): Phosphate acquisition. Annual Review
of Plant Physiology and Plant Molecular Biology, 50: 665–693. SAS Institute (2009): SAS/STAT User’s Guide. Version 9.1.3.
Cary, SAS Inst.
Sato S., Morgan K.T., Ozores-Hampton M., Simonne E.H. (2008): Spatial and temporal distributions in sandy soils with seepage irrigation: II. Phosphorus and potassium. Soil Science Society of America Journal, 73: 1053–1060. Schroder J.L, Zhang H., Richards J.R. Payton M.E. (2009):
Interlaboratory validation of the Mehlich III method as a universal extractant for plant nutrients. Journal of AOAC International, 92: 995–1008.
Sims J.T. (1989): Comparison of mehlich 1 and mehlich 3 ex-tractants for P, K, Ca, Mg, Mn, Cu and Zn in atlantic coastal plain soils. Communications in Soil Science and Plant Analysis, 20: 1707–1726.
U.S. Environmental Protection Agency (1993): Methods for chemical analysis of water and wastes. Environmental Monitoring and Support Laboratory Cincinnati, OH, Report Number: EPA/600/R-93/100.
USDA (2002): Snap Bean: Shipping Point and Market Inspec-tion InstrucInspec-tions. U.S. Standards for Grades of Snap Beans, Section 51.3829. Available at http://www.ams.usda.gov/ AMSv1.0/getfile?dDocName=STELPRDC5098288 USDA (2012): Agricultural Prices. Available at http://www.
ers.usda.gov/data-products/fertilizer-use-and-price. aspx#26727 (accessed Aug 20, 2014).
Received for publication August 28, 2014 Accepted after corrections November 20, 2014
Corresponding author:
Assist. Prof. Guodong Liu, IFAS, University of Florida, Horticultural Sciences Department, 1253 Fifield Hall, Gainesville, FL 32611, USA
phone: + 001 352 273 4814, e-mail: [email protected]
101
Hort. Sci. (Prague) Vol. 42, 2015 (2): 94–101