The world’s annual production of common wheat is 600 million tons and about 17% of this total amount is used for animal feeding. Nevertheless, common wheat in north-western Europe including the Czech Republic is predominantly used for
live-stock feeding (Rose, 2003). The ratio of this com-modity utilized for animal feeding in the Czech Republic in the marketing year of 2004/2005 was 58.5% according to the Ministry of Agriculture (Vaculová and Horáčková, 2007).
Supported by the Ministry of Agriculture of the Czech Republic (Projects No. 1G57065. and No. 0002700602).
Nutritive effect of protein composition and other grain
properties of doubled haploid wheat lines with/without
translocation 1B/1R in a model feeding test
V. Dvořáček
1, A. Kodeš
2, Z. Stehno
1, B. Hučko
2, Z. Mudřík
21Crop Research Institute in Prague, Prague, Czech Republic
2Department of Microbiology, Nutrition and Dietetics, Czech University of Life Sciences
in Prague, Prague-Suchdol, Czech Republic
ABSTRACT: The frequent presence of rye translocation 1B/1R in common wheat is well known as well
as its unfavourable effect on bread-making quality.These translocated materials make up more than one
tenth of allwheat varieties registered in the Czech Republic and due to their lower technological value they
are predominately used for livestock feedingin spite of the lack of information abouttheir desirability for
monogastric animals.Our study was aimed at a general effect of 1B/1R translocation, including other grain
characteristicsin model feeding tests with laboratory rats. Triennial evaluation of selected chemical and
technological characteristics of winter wheat grain, including feeding characteristics in the model set of 18 DH lines with/without 1B/1R translocation, confirmed a highly significant effect of year on evaluated parameters. Wheat lines with the presence of 1B/1R translocation showed a significantly higher value of relative viscosity, crude protein content and higher proportion of the albumin + globulin fraction. This was manifested negatively in the technological characteristics of the gluten index (GI) and the Zeleny sedimenta-tion test of these wheat lines. Detected values of relative viscosity, grain hardness (PSI) and albumin-globulin fraction were significantly influenced by the genotype of the wheat line. The relationships of evaluated grain characteristics to the results of feeding test were not unequivocal. The presence of 1B/1R translocation
sig-nificantly decreased the values of balance in these characters:net protein utilization (NPU) and biological
value of proteins (BV), however the effect of the 1B/1R translocation on protein efficiency ratio (PER) was
not confirmed. Correlation analyses showed low mutualrelationships among the parameters of balance and
growth tests. A lower but significant positive correlation of the albumin + globulin fraction and a negative correlation of storage proteins with growth parameter PER were also observed. It is possible to summarize that individual relation between albumins + globulins and gluten protein composition of grains influenced
the values of PER more significantly than thepresenceof 1B/1R translocation.
Besides the basic source of energy, cereals in a feed ration are also an important source of proteins (Zeman et al., 2003). In animal nutrition it is neces-sary to calculate with a lower nutritional value of wheat proteins due to the lower content of more easily digestible albumin and globulin fraction and totally lower content of the essential amino acids lysine, threonine, tryptophan and sulphuric amino acids (methionine, cysteine) especially in the gluten storage proteins (gliadins and glutenins) of grain (Henry and Kettlewell, 1997). Kasarda et al. (1976) classified wheat proteins soluble in dilute salt so-lutions (albumins and globulins) as cytoplasmatic proteins. These “soluble” proteins differ distinctly in their amino acid (AA) composition from the glu-ten storage proteins and are nutritionally important because the essential AAs amount to about 45% of the total AAs content.
Because of its agronomic benefits (yield increase, rust and powdery mildew resistance) the
chromo-some 1R of rye (Secale cereale L.) has been widely
used in wheat (Triticum aestivum L.) breeding,
es-sentially in the form of the Robertsonian translo-cation 1B/1R. Several hundreds of wheat cultivars are known to possess this translocated chromo-some and many others will bear it unrecognized (Rabinovich, 1998). More than one tenth of wheat varieties currently registered in the Czech Republic bears this 1B/1R translocation and, in connection with their lower bread-making quality (Bartoš, 1993; Graybosch, 2001) they are predominately used for livestock feeding.
The relationship between wheat varieties and their feeding values is not investigated and pub-lished frequently in comparison with technological (bread-making) quality. For example, wheat variety experiments with rats, broilers and pigs were pub-lished in the eighties and nineties. All results re-ferred to variety differences in feeding value (Fuller et al., 1989; Heger et al., 1989; Annison, 1991). The recent work of Pirgozliev et al. (2003) tested select-ed grain parameters in 23 wheat varieties in relation
to true metabolisation energy (AMEN) obtained
from a broiler feeding test. On the basis of calcu-lated step regression, the highest signification for
the explanation of AMEN variabilitywas confirmed
for starch, protein and fat content in grains. Rose (2003) reported significant negative corre-lations between the content of nonstarch polysac-charides (NSP) and apparent metabolisable energy (AME) in chicken broilers. Boros et al. (1993) and Saulnier et al. (1994) confirmed a medium strong
or even strong correlation between NSP and rela-tive viscosity of aqueous extract. Higher values of NSP and viscosity in connection with the presence of 1B/1R translocation were documented by Choct and Annison (1992). Thus, it is possible to expect a lower feeding value especially for poultry in such “translocated” wheat materials. Nevertheless, present feeding tests with materials with and with-out 1B/1R translocation did not confirm this hy-pothesis unambiguously and feeding test results were enough variable without significant evidence of the lower feeding value in translocated materials (McCracken, 2001; McCann et al., 2006). Besides the lack of general criteria of the high feeding value of wheat grain, only little information is still avail-able about the effect of 1B/1R translocation on this area of wheat application.
This submitted study still represents only a part of wider research focused on the determination of wheat grain properties and parameters with higher relation to feeding value for monogastric animals (poultry and pigs). This part was aimed at the effect of 1B/1R trans-location as well as at the impact of selected chemical and technological characteristics of wheat grain on biological parameters of model feeding test.
MATERIAL AND METHODS
A set of 80 doubled haploid (DH) wheat lines was developed by Ladislav Kučera, from the crossing of wheat cultivar Šárka with advanced line UH 410 (donor of 1B/1R translocation) in the Department of Molecular Biology of CRI in Prague. A set of se-lected 18 DH wheat lines with a higher agronomical potential and according to the presence or absence of allele Gli 1B3 characterizing 1B/1R transloca-tion was subsequently divided into two numerically comparable subsets (8 lines with 1B/1R transloca-tion and 10 lines without translocatransloca-tion).
Each selected DH line was genetically evaluated by means of gliadin alleles to confirm the lines with/without 1B/1R translocation. Gliadin blocks were identified according to Metakovsky (1991) in conditions of Acid-PAGE.
The lines including two standard cultivars Šárka and Nela were multiplied in large plot experiments with plot size from 0.3 ha (2004) to 0.7 ha (2006) in the Kralovice locality for three years (2004–2006). Fertilization was applied according to soil analysis in the nitrogen range of 120–135 kg N and 50 to
The following grain parameters were tested: con-tent of crude protein – Kjeldahl method; Zeleny sedimentation test; wet gluten content (WG) and gluten index (GI) – Glutomatic 2200 (AACC 38-12); content of protein fractions (albumins + globulins and their proportions in crude protein; gliadins) – modified Osborne method according to Dvořáček et al. (2001). Content of total glutenins was calcu-lated as a difference between the content of crude protein and the sum of albumins + globulins and gliadins.
Relative viscosity was measured with an Anton Paar micro-viscosimeter according to Saulnier et al. (1994). Grain hardness – Particle Size Index (PSI) – according to AACC Method 55-30.
The content of the two selected essential ami-no acids lysine (Lys) and methionine (Met) was measured with an AAA 400 automatic analyzer ac-cording to Kacerovský et al. (1990). Other chemical analyses of grain were also carried out according to the same author: content of crude fat – Soxhlet’s extraction; content of crude fibre – two-step al-kaline and acid hydrolysis on Fibertec; content of ash – mineralization method at 550°C; gross energy (GE) – calorimetric method – burning of grain sample in oxygen atmosphere; content of ni-trogen free extract – according to the equation: NFE (%) = 100 – water content – crude nitrogen content – crude fat content – crude fibre content – ash content.
Biological testing performed at an accredited station of the Czech University of Life Sciences in Prague was based on balance and growth experi-ments with model animals – male laboratory rat (Rattus norvegicus) of outbred race Wistar. All the used animals were of the age 21 days and their body
mass was 55 ± 3 g. They were kept individually and
grouped by the principle of maximal similarity.
Growth and balance experiments in vivo were
carried out according to the methodology of Heger et al. (1989) with minimally 10 animals in each
groupand for the period of 25 days (growth
ex-periment) and 28 days (balance exex-periment). The experimental diet contained ground grains of the
tested wheat samples (as the solesourceof
pro-tein) on a suboptimal level of 10% protein ratio in the whole diet, vitamin and mineral supplement (U-aminovitan 331), uniform source of energy (soy-bean oil), icing sugar for flavouring and a uniform starch vehicle.
The following parameters were measured: pro-tein efficiency ratio – (PER) in growth experiments,
biological value of proteins (BV), net protein
utili-zation (NPU) and coefficient of proteindigestibility
(CPD) in balance experiments. Nitrogen balance (NB) is the expression of the difference in nitro-gen accepted and excreted by excrements (faeces and urine). The coefficient of true digestibility of protein (CPD) shows the ratio of digested nitrogen (diminished by the percentage of metabolic N) to accepted nitrogen. The biological value (BV) was determined according to Thomas and Mitchell as the relationship between nitrogen balance (en-larged by metabolic and endogenous nitrogen) and true digestibility of nitrogen. Net protein utilization (NPU) expresses the relationship between nitrogen balance (enlarged by metabolic and endogenous nitrogen) and nitrogen intake.
Faecal metabolic nitrogen (Y) in mg/day and uri-nary endogenous nitrogen (Z) in mg/day were calcu-lated from the average weight (W) of laboratory rats (g) in balance period according to the formula:
Y = –3.601 + 0.110 W and Z = 10.30 + 0.076 W
Protein efficiency ratio (PER) expresses the rela-tionship between live weight gain and consumption of crude protein.
The software “Statistica 7.0 CZ” was used for the evaluation of results. Significance of evaluated fac-tors (genotype, year and translocation) and differ-ences among grain parameters of DH-lines were tested by ANOVA/MANOVA with subsequent Tukey’s HSD test. The application of correlation analysis, PCA (Principle Component Analysis) and also multiple stepwise regression enabled to analyze relationships among biological testing and wheat grain parameters. The parameter transformations because of the high year impact were carried out according to the following equation:
Atrans (Lx; y) = A(Lx; y)/Â(y) where:
A = the value of the respective tested parameter
Lx = the respective tested wheat line
Y = the respective year
Â(y) = the average value of the parameter in the year (y)
RESULTS AND DISCUSSION
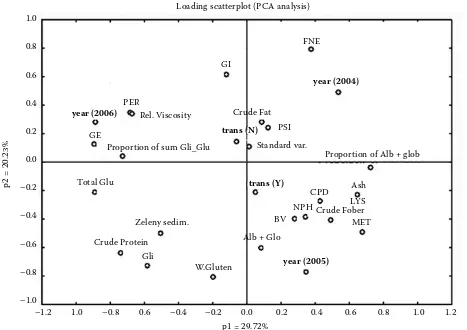
significant effect of annual weather conditions with their dominant incidence on the variability of monitored traits, which is documented in Figure 1. Different positions of the particular years are evi-dent along with their influence on the monitored parameters which correspond with their tabu-lated statistical significance e.g. the effect of the warmer year 2006 on GE, relative viscosity and PER (Table 1). The effect of weather conditions on changes in chemical and technological properties in wheat grain is documented in many publications and the significant effects on parameters of feeding tests were also confirmed by Svihus and Gullord (2002) or Pirgozliev et al. (2003).
In accordance with the results there was a signifi-cant increase in the presence of 1B/1R transloca-tion in DH lines, in crude protein content, content of albumin + globulin fraction, its proportion in crude protein and in the content of gliadins as well. In spite of the gliadin increase, the total propor-tion of storage proteins was on average significantly lower in the translocated lines namely on behalf of a
nutritionally more valuable proportion of albumins and globulins (Table 1). The observed higher con-tents of two important essential amino acids (Lys and Met) in translocated DH lines were not signifi-cant. Among the other technological parameters, the 1B/1R translocation significantly decreased the values of GI and Zeleny sedimentation tests, on the contrary it induced the growth of grain rela-tive viscosity (Table 3). Worse technological (bak-ing) properties of the material with translocation are usually explained by losses of alleles GLU B3 and GLI B1 which affect the properties of LMW glutenins and gliadins, respectively, and total quali-ty of gluten macropolymer (Martin and Stewart, 1990).
In spite of similar technological and chemical parameters of parental components, published in
our previouspaper (Dvořáček et al., 2006), highly
significant differences in the albumin + globulin fraction and its proportion in crude protein and in some technological parameters (Zeleny sedi-mentation, PSI, relative viscosity) were detected
Loading scatterplot (PCA analysis) 1.0
0.8
0.6
0.4
0.2
0.0
–0.2
–0.4
–0.6
–0.8
–1.0
p2
=
2
0.
23
%
p1 = 29.72%
–1.2 1.0 –0.8 0.6 –0.4 –0.2 0.0 0.2 0.4 0.6 0.8 1.0 1.2
year (2005)
W.Gluten Gli
Crude Protein Alb + Glo
Zeleny sedim. Crude FoberMET
Total Glu trans (Y)
BV NPH
Proportion of Alb + glob
CPD Ash
LYS
year (2006)
trans (N)
year (2004)
FNE
Crude Fat GI
PSI Standard var. Rel. Viscosity
Proportion of sum Gli_Glu PER
[image:4.595.67.534.83.413.2]GE
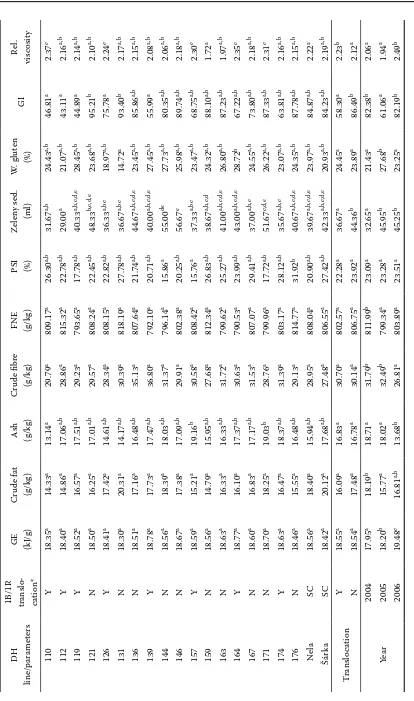
Table 3. Balance and growth characteristics of feeding test with wheat DH lines (2004–2006)
DH line/parameters
1B/1R
translocation CPD BV NPU PER
110 Y 84.70c,d,e 58.18a,b 50.59a,bc 1.37d
112 Y 79.50a 50.90a 42.85a 1.19a,b,c,d
119 Y 82.37a,b,c 57.38a,b 49.07a,b 1.13a,b,c,d
121 N 81.13a,b 64.14b,c,d 54.26b,c,d 1.16a,b,c,d
126 Y 83.32b,c,d 63.64b,c,d 55.58b,c,d 1.30b,c,d
131 N 84.77c,d,e 66.56b,c,d 58.14b,c,d 1.20a,b,c,d
136 N 86.90e 71.48d 64.34d 1.27b,c,d
139 Y 86.81e 61.65a,b,c,d 54.94b,c,d 1.03a,b
144 N 84.05b,c,d,e 66.84b,c,d 57.85b,c,d 1.23a,b,c,d
146 N 84.74b,c,d,e 65.90b,c,d 57.42b,c,d 1.20a,b,c,d
157 Y 86.02de 68.04b,c,d 60.61c,d 1.29b,c,d
159 N 85.91cde 67.84b,c,d 59.94b,c,d 1.21a,b,c,d
163 N 85.41c,d,e 58.04a,b 51.08a,b,c 0.96a
164 Y 86.09d,e 63.95b,c,d 56.60b,c,d 1.12a,b,c,d
167 N 85.55c,d,e 63.47b,c,d 55.47b,c,d 1.24b,c,d
171 N 86.09d,e 67.88b,c,d 60.37c,d 1.09a,bc
174 Y 84.98c,d,e 59.71a,bc 52.31a,bc 1.33c,d
176 N 85.07c,d,e 63.14b,c,d 55.67b,c,d 1.20a,b,c,d
Nela SC 84.22b,c,d,e 65.15b,c,d 56.41b,c,d 1.10a,b,c,d
Šárka SC 83.58b,c,d,e 69.37c,d 59.84c,d 1.31c,d
Translocation Y 84.25a 60.84a 53.20a 1.20a
N 84.97a 65.09b 57.07b 1.19a
Year
2004 85.73b 62.74b 55.82b 0.98a
2005 86.27b 71.05c 62.85c 0.98a
2006 81.86a 58.78a 49.70a 1.58b
the values of parameters marked by different letters are significantly different at P ≤ 0.05; SC – standard cultivar
among the particular DH lines. These differences reflected a tighter genetic linkage in comparison with other characteristics. Strong genetic condi-tionality of the parameters PSI and relative viscos-ity was also proved by Martinant et al. (1998) and Greffeuille (2006). Significant differences among DH lines were also found in the contents of total and storage proteins, which had a dominant im-pact on the variability of technological properties similarly like on the Zeleny sedimentation test, wet gluten content and GI, as mentioned above. On the contrary, statistically insignificant differ-ences among the lines were detected in contents of both amino acids (Lys and Met), determined level of GE, content of crude fat, and NFE (Tables 1 and 2).
The results of feeding tests were not markedly influenced by the years as above-mentioned, but by the 1B/1R translocation, which significantly decreased the parameters of balance test (BV and NPU), however without a significant effect on PER.
translocation. On the other hand, the lowest weight gain was recorded in non-translocated line 163 (Table 3). Thus, these results also confirmed the equivocation of this factor on the level of feeding tests described by McCracken (2001) and McCann et al. (2006). It is necessary to emphasize an impor-tant fact that all three lines (110, 174 and 126) and also parental cultivar Šárka showed a high content and proportion of albumin + globulin fraction and a low proportion of storage proteins (mainly total glutenins), respectively.
Mutual relations among chemical and technolog-ical parameters and also their effect on the param-eters of feeding tests were studied in detail using correlation method and PCA analysis, see Table 4 and Figure 2. With regard to the strong effect of years and to the requirement of their elimination (Figure 1), the values of all tested parameters were transformed in the particular years by the quotient of achieved annual average for each corresponding
[image:9.595.65.536.82.429.2]parameter. The transformed PCA graph documents an elimination of the influence of the year factor and thus it reveals significantly different prop-erties of lines with/without 1B/1R translocation (Figure 2).
The closer relation of the DH lines with 1B/1R translocation and content of albumin + globulin fraction is evident from positions of the particular parameters. A similar trend of angular coefficients was characteristic of relative viscosity. On the con-trary, the parameters of balance test jointly with technological parameters GI, and/or also Zeleny sedimentation test showed a positive increase in the group of the lines without 1B/1R transloca-tion. The position of the growth parameter PER situated more closely to the centre of the graph (similarly like parameters GE, ash, crude fibre, crude fat) confirmed a low effect of the 1B/1R translocation. It is in accordance with the analy-sis of variance of untransformed data (mentioned
Loading scatterplot (PCA analysis) 1.0
0.8
0.6
0.4
0.2
0.0
–0.2
–0.4
–0.6
–0.8
–1.0
p2
=
1
6.
61
%
p1 = 22.18%
–1.2 1.0 –0.8 0.6 –0.4 –0.2 0.0 0.2 0.4 0.6 0.8 1.0 1.2 W.Gluten
Gli
Crude Protein Alb + Glo
Zeleny sedim.
Crude Fiber MET
Total Glu
trans (Y)
BV NPU
Proportion of Alb + Glob
CPD
Ash LYS
trans (N)
years (2004–2006)
FNE
Crude Fat GI
PSI
(Standard var.)
Rel. Viscosity
Proportion of sum Gli_Glu PER
GE
above) and lower correlation coefficients of these parameters (Tables 3 and 4). In spite of that there evidently exist opposite relationships between PER on the one hand and contents of total and storage proteins on the other hand or a positive correlation of PER with NFE and proportion of albumin + globulin fraction.
The PCA graphical expression of parameter re-lations generally corresponded with correlation analysis (Table 4), which enabled to quantify
rela-tions among these transformed dataincluding their
evaluation of statistical significance. It is possible
to emphasize a mutual highly significant medium or highly strong correlation among grain protein fractions including closer relationships with indi-rect technological parameters of baking quality (Zeleny sedimentation and GI). A close relation-ship of storage proteins with properties of gluten results logically from the chemical composition of gluten, which is composed of gliadins and glute-nins. Negative correlations among the growth of albumin-globulin fraction and evaluated techno-logical parameters are particularly related to the presence of 1B/1R translocation in these materi-als and production of secalins which significantly decreases the technological quality of gluten as detected by Zeller et al. (1982) and Martin and Stewart (1990).
Positive correlations were noted between both evaluated amino acids including their negative cor-relation with an increase in total protein, which leads to an increase in nutritionally less valuable gliadin and glutenin fractions (Wrigley and Bietz, 1988).
Lower but highly significantly negative correla-tions between PER and the content of crude and storage proteins (sum of gliadins and total glute-nins) described already by PCA analysis were also confirmed by correlation calculation. It is evident that a higher storage protein content in grain de-creased the efficiency of protein utilization for weight gain of animal body. Petr (2003) came to analogous results about the influence of storage proteins on PER. The generally accepted statement that elite baking wheat varieties have lower feeding value is possible to be indirectly explained by our results as well. These varieties show a generally higher ratio of gluten proteins – especially glute-nins responsible for the firmness and elasticity of gluten. The protein composition of three of the best DH-lines in our growth test indicates, besides a higher detected content of albumin + globulin
fraction, a lower content of glutenin fraction which could be, in the case of a comparable content of al-bumin + globulin fraction among tested materials, a crucial factor for the prediction of feeding value.
An interesting fact was provided by a comparison of the effects of albumins and globulins and stor-age proteins on growth and balance parameters. Whereas an increase in the proportion of albumin + globulin fraction and a simultaneous decrease in gluten storage proteins (gliadins and glutenins) evoked an increase in PER, the effect of these pro-tein fractions on balance experiments was opposite. The reasons for these findings can be explained only hypothetically. In suboptimal levels of protein content in feeding rations we can expect a limiting position in any of the essential amino acids which are deposited mainly in the albumin and globulin fraction. For instance, Wrighly and Bietz (1988) indicated a 5–7 times higher content of lysine in the albumin and globulin fraction. So, in the lines having a lower proportion of albumin + globulin fraction, the energy requirement for nitrogen reten-tion increases in dependence on the growth of less valuable grain storage proteins. Such an increase in energy requirements jointly with metabolic stress of an organism could decrease the productive ef-ficiency of wheat protein despite of its higher di-gestibility. Metabolic stress, caused by the feeding of rats with unbalanced amino acid composition, was already reported by Heger et al. (1989).
In our tests no negative effects of relative viscos-ity on the parameters of feeding test were proved. On the contrary, all three lines that reached the highest values of PER including the standard variety Šárka had on average the highest level of relative viscosity. The negative role of this character, ob-served mainly in feeding tests on chicken broilers by Rose (2003), was not confirmed in the case of our model feeding test. In spite of the published negative role of higher grain viscosity on digestion, our results could indicate its possible positive effect because of an absorption decrease in unbalanced proteins from the gluten part of grain.
On the basis of the evaluated chemical and tech-nological parameters transformed by reason of the year impact, there was a combination of param-eters searched as having the best ability to
pre-dict the growth parameter PER(trans). The obtained
significant regression equation for prediction of transformed parameter PER (see below) had total
correlation R = 0.48, measurement error = 0.14 and
PER(trans) = 1.62 – 0.50 × Gli – 0.46 × Total Glu + + 0.33 × Rel. Viscosity + 0.19 × W. gluten – 0.18 × × Fat
This output must be approached as a mathematical model valid for the existing set of materials and it is not possible to generalize it due to the lower correla-tion. Nevertheless, we can emphasize the importance of storage proteins again. Their increase significantly decreases values of PER. In contrast to published
findings,a positive effect of relative viscosity was
also confirmed. The last two parameters (wet gluten and crude fat) did not have a strong influence on PER modification because of their low partial significance and index coefficient in the equation.
Finally, we can conclude that the relationships of evaluated grain characters to the results of feeding tests were not fully unambiguous. The presence of 1B/1R translocation significantly decreased the values of balance parameters (NPU and BV). Nevertheless, no similar effect of the translocation was proved in growing test (PER). A lower, but significantly posi-tive correlation of albumin + globulin fraction and a negative correlation of storage proteins with PER parameter were confirmed by correlation analysis. The calculated correlation coefficients in frequently declared characteristics (grain hardness and relative viscosity) with relation to the feeding value PER were
low and not statistically significant. It is possible to
assume that individual ratios between albumins + globulins and gluten protein composition of grains influenced the values of PER more significantly than the presence of 1B/1R translocation, which is only one of many genetic factors participating in the pro-tein composition of grain.
REFERENCES
Annison G. (1991): Relationship between the levels of soluble non-starch polysaccharides and the apparent metabolizable energy of wheats assayed in broiler-chickens. Journal of Agricultural and Food Chemistry, 39, 1252–1256.
Bartoš P. (1993): Chromosome 1R of rye in wheat breed-ing. Plant Breeding Abstracts, 63, 1203–1211. Boros D., Marquardt R.R., SlominskiB.A., Guenter W.
(1993): Extract viscosity as an indirect assay for water-soluble pentosan content in rye. Cereal Chemistry, 70, 575–580.
Choct M., Annison G. (1992): The inhibition of nutrient digestion by wheat pentosans. British Journal of Nutri-tion, 67, 123–132.
Dvořáček V., Moudrý J., Čurn V. (2001): Studies of protein fraction in grain of spelt wheat (Triticum spelta L.) and common wheat (Triticum aestivum L.). Scientia Agri-culturae Bohemica, 3, 287–305.
Dvořáček V., Bradová J., Stehno Z. (2006): Effect of 1B/1R translocation on selected grain quality parameters in a set of doubled haploid wheat lines. Czech Journal of Genetic and Plant Breeding, 42, 50–57.
Fuller M.F., Cadenhead A., Brown D.S., Brewer A.C., Carver R.M., Robinson R. (1989): Varietal differences in the nutritive value of cereal grains for pigs. Journal of Agricultural Science, 113, 149–163.
Graybosch R.A. (2001): Uneasy union: quality effects of rye chromatin transfers to wheat. Journal of Cereal Science, 33, 3–16.
Greffeuille V., Abecassis J., Rousset M., Oury F.X., Faye A., Bar-L’Helgouac’h C., Lullien-Pellerin V. (2006): Grain characterization and milling behaviour of near-isogenic lines differing by hardness. Theoretical and Applied Genetics, 114, 1–12.
Heger J., Černý J., Malý J. (1989): Feeding value of some winter wheat and triticale varieties. Rostlinná Výroba, 35, 1189–1199 (in Czech).
Henry R.J., Kettlewell P.S. (1997): Cereal Grain Quality. Chapman and Hall, London, UK, 488 pp.
Kacerovský O. et al. (1990): Testing and Appraisal of Feedstuffs. SZN, Prague, CR, 213 pp. (in Czech) Kasarda D.D., Bernardin J.E., Nimmo C.C. (1976): Wheat
proteins. In: Pomeranz Y. (ed.): Advances in Cereal Sci-ence and Technology. American Association of Cereal Chemists, St. Paul, USA, No 1, 58–236.
Martin D.J., Stewart B.G. (1990): Dough stickiness in rye-derived wheat cultivars. Euphytica, 51, 77–86. Martinant J.P., Cadalen T., Biolog A., Chartier S., Leroy
P., Bernard M., Saulnier L., Branlard L. (1998): Genetic analyses of water-extractable arabinoxylans in bread wheat endosperm. Theoretical and Applied Genetics, 97, 1069–1075.
McCracken K.J. (2001): Variety differences of impact of 1B/1R rye translocation on ileal digestibility of nutri-ents in broiler diets containing high levels of wheat. British Poultry Science, 42, 93–93.
McCann M.E.E., McEvoy J.D.G., McCracken K.J., Sim-mins P.H. (2006): Effect of variety, endosperm hardness, the 1B/1R translocation and enzyme addition on the nutritive value of wheat for growing pigs. Irish Journal of Agricultural and Food Research, 45, 173–185. Petr J. (2003): What we know and don’t know about
feed-ing value of wheat. In: Questionsof feedfeed-ing value. Bree-ding Seminary,VÚRV Prague, CR, 25–29. (in Czech) Pirgozliev V.R., Birch C.L., Rose S.P., Kettlewell P.S.,
nutri-tive quality of different wheat cultivars for broiler chickens. British Poultry Science, 44, 464–475. Rabinovich S.V. (1998): Importance of wheat-rye
trans-locations for breeding modern cultivars of Triticum
aestivum L. Euphytica, 100, 323–340.
Rose S.P. (2003): The nutritional value of different wheat cultivars for farm animals. In: Questionsof feeding value. Breeding Seminary, VÚRV Prague, CR, 2–6. Saulnier L., Peneau N., Thibault J.F. (1994): Variability
grain extract viscosity and water-soluble arabinoxylan content in wheat. Journal of Cereal Science, 22, 259–264.
Svihus B., Gullord M. (2002): Effect of chemical content and physical characteristics on nutritional value of wheat, barley and oats for poultry. Animal Feed Science and Technology, 102, 71–92.
Vaculová K., Horáčková S. (2007): Non-starch polysac-charides in grain of winter wheat. Obilnářské listy, 15, 25–31. (in Czech)
Wrigley C.W., Bietz J.A. (1988): Protein and amino acids In: Pomeranz Y. et al. (ed.): Wheat Chemistry and Tech-nology I. American Association of Cereal Chemists, Minnesota, USA, 159–253.
Zeller F.J., Günzel G., Fischbeck G., Gerstenkorn P., Weipert D. (1982): Veränderungen der Backeigenschaf-ten des Weizens durch die Weizen-Roggen-Chromo-somentranslokation 1B/1R. Getreide, Mehl und Brot, 36, 141–143.
Zeman L., Procházková J., Pípalová S., Klecker D. (2003): Crop varietal evaluation form in term of food science and technology. In: Questionsof feeding value. Breeding Seminary, VÚRV Prague, CR, 20–23. (in Czech).
Received: 2008–02–11 Accepted after corrections: 2008–08–08
Corresponding Author