Original citation:
Das, Abhishek, Franciosa, Pasquale, Pesce, Achille and Gerbino, Salvatore. (2017) Parametric
effect analysis of free-form shape error during sheet metal forming. International Journal of
Engineering Science and Technology, 9 (09S). pp. 117-124.
Permanent WRAP URL:
http://wrap.warwick.ac.uk/93407
Copyright and reuse:
The Warwick Research Archive Portal (WRAP) makes this work of researchers of the
University of Warwick available open access under the following conditions.
This article is made available under the Attribution-NonCommercial-NoDerivatives 4.0 (CC
BY-NC-ND 4.0) license and may be reused according to the conditions of the license. For
more details see:
http://creativecommons.org/licenses/by-nc-nd/4.0/
A note on versions:
The version presented in WRAP is the published version, or, version of record, and may be
cited as it appears here.
Parametric Effect Analysis of Free-form
Shape Error during Sheet Metal Forming
Abhishek Das, Pasquale Franciosa
Warwick Manufacturing Group (WMG), University of Warwick Coventry, United Kingdom
[email protected]; [email protected]
Achille Pesce, Salvatore Gerbino
DiBT Department, University of Molise, Campobasso, Italy [email protected]; [email protected]
Abstract—Compliant sheet metal parts or free-form shaped parts are widely used for automotive bodies, aerospace fuselage/wing or home appliances. Intrinsic flexibility of sheet metal along with forming process variability throws a number of challenges to produce geometrically conforming parts. Additionally, emerging optical non-contact metrology scanners offer to capture entire part geometric quality information which enables virtual design and manufacturing at early stage. This paper focuses on developing a generic functional data analysis based approach to quantify geometric error/shape error which are generated by process or material parameters (such as material thickness, stamping speed and blank holding force) during sheet metal forming process. The research methodology involves: (i) experimental investigation by varying the design parameters; (ii) capturing entire surface based shape error information (i.e. high density cloud-of-points, CoPs) by using optical scanner; (iii) functional mapping of shape error to design parameters (responsible to generate the data) by using deviation field decomposition approach; and (iv) parametric analysis of process parameters by developing analytical surrogate model. The proposed approach concentrates on finding root causes of failure, usually unforeseen if only based on heuristic approaches. The applicability and effectiveness of the proposed methodology have been illustrated with industrial case study.
Keywords—sheet metal forming; shape error modelling; deviation field decomposition; parametric effect analysis
I. INTRODUCTION
Many industrial processes involve compliant sheet metal parts for building body structures, especially for automotive and aerospace industries. These sheet metal parts consist of geometric error /shape error which are the result of materials and manufacturing process variation such as spring-back, fabrication variations [1]. Because of intrinsic flexibility of sheet metal, it is usually difficult to control the final product shape with complex geometries and it affects assemblability and finished product quality [2, 3]. Additionally, tight quality requirements for GD&T specification cannot be met by inspecting few key points, such as, measured by Coordinate Measuring Machine (CMM). Alternatively, emerging optical non-contact metrology scanners enable to capture entire surface information of formed part or machined component which requires efficient method to quantify the shape error associated with it. Current industrial practice of identifying influential design parameters and their effects/sensitivity are based on trial-and-error approach which is repetitive, time expensive and costly [4]. As a result, it increases production cost and ramp-up time. In order to control global shape error by adjusting influential design (i.e. process and material) parameters, a proactive shape error quantification model is required by linking the parameters to the measured shape error.
This on-going research is a step towards root cause analysis related to sheet metal components. The key idea of the proposed methodology is to correlate design parameters (such as material thickness, stamping speed and blank holding force) to shape error arising during pre- and production stage. The proposed methodology will allow to identify the most influential parameters and subsequently, their contributions towards generation of shape error. By analysing the effect size of identified parameters, real forming process can be adjusted. Further, enhanced shape quality within the specified tolerance limit can be achieved by tuning the parameters.
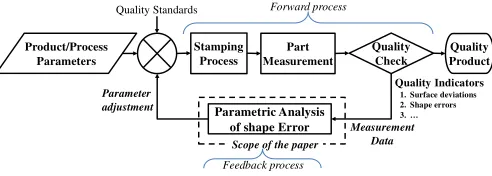
the process parameters to achieve given quality standards [6]. A part of feedback process is to identify the sensitivity of design parameters and consequently, their effect.
Stamping Process
Part Measurement
Quality Product
Parametric Analysis of shape Error
Quality Check Product/Process
Parameters
Measurement Data Parameter
adjustment
Scope of the paper
Quality Indicators
1. Surface deviations 2. Shape errors 3. …
Quality Standards Forward process
[image:3.595.174.420.103.191.2]Feedback process
Fig. 1. Measurement data driven process adjustment of sheet metal forming.
Current literature is mainly focusing on sensitivity analysis of stamping process which is either relies on finite element based numerical approach [7-9] or neural network training based on finite element simulation [10, 11]. Finite element based techniques are necessary to predict the shape quality but not adequate to achieve closed-loop solution as it lacks integration of real measurement data. On the contrary, limited attempts have been made to link the measurement data to process parameters [4, 12], which are mainly point-based CMM data. Therefore, there is a requirement to develop a surface data (i.e. CoP) driven feedback control which can correlate the product and process parameters with the entire surface based shape error. Further, to quantify the shape error contributions coming from process parameters and understand effect size, the following challenges have been identified: (1) unavailability of a functional data analysis based parametric approach by correlating the measured shape error (i.e CoP data) with product and process parameters; (2) analytical representation (surrogate model) of the relationship between shape error and process parameters; and (3) techniques required to quantify the individual parameter’s effect.
This paper addresses those challenges by decomposing the captured data into orthogonal (i.e. independent) error modes and uses the modes as a parametric approach to identify and quantify the influence of process parameters on shape error generation. Further, the parameters are ranked based on their effects on response behavior (i.e. shape error).
The reminder of the paper is organized as follows: Section II proposes the methodology, Section III demonstrates the methodology with an industrial case study, and Section IV draws final remarks.
II. PROPOSED METHODOLOGY
The research methodology, to quantify the effect of process parameters and rank them considering entire surface information, is developed in three major steps as follows:
A. Functional Decomposition of Shape Error Generated by Varying Parameters
Firstly, non-contact optical measurement scanner is used for capturing entire part surface which digitizes the surface by representing millions of data points (Cloud of Points-CoP). These CoP data can be classified as non-functional data as it cannot be used directly [13], which requires non-functional data analysis approach to transform non-functional data into functional basis. This paper uses Geometric Modal Analysis (GMA) approach [14] which decomposes shape error into orthogonal error modes. The decomposed modes can be parameterized by means of its values to represent shape variation associated with the parts, produced through varying process parameters. GMA uses 3D Discrete-Cosine-Transform (3D-DCT) as main kernel to decompose the shape error/deviation field into significant shape error modes. The deviation field can be defined as difference between nominal and actual surfaces as stepwise illustrated in Fig. 2. Further, the decomposed shape error modes can be used from process design stage [15, 16] to process control stage for adjustments. This paper is a step forward towards process adjustments.
Secondly, the deviation field is computed at mesh nodes (i.e. polygonal mesh of CAD model) when comparing with CoP. Design of Experiments (DOE) is chosen to characterize the shape error under varying process
parameter conditions. Assuming m number of mesh node, and p number of DOE experiments, the deviation
field (D) can be expressed as in (1), where, Dz,j denotes zth node deviation of pth experimental sample.
{
(1) (2) ( )}
( ){ }
,
;
, , ; ,
p j
z j
D D D D D D
z 1,2 m j 1,2, p
= =
∀ = ∀ =
L
L L
1 – Nominal CAD Geometry
2 – CoP Measurement Data
4 – Deviation at Mesh Nodes 3 – CoP Alignment
with CAD
Dev[mm]
10 4 0 -4
5 – Deviation Field
Fig. 2. Generation of deviation field from measured CoP data.
Lastly, the obtained deviation field is also non-parametric in nature and it cannot be linked to the process parameters. To overcome this limitation, functional data analysis based GMA approach has been adopted to extract geometric features/shape error features from the deviation field (see Fig. 3). These extracted features are parametric modes which are also orthogonal and can be linked with the process parameters. Due to orthogonality of the shape error modes, they can be varied independently to fit different set of shape error by
changing the amplitude of the modes. A set of decomposed modes for p number of experiments is defined as in
(2), where n is the number of modes. The transformed modes are expressed as a function of the given deviation
field, as in (3), where F denotes the GMA function. Inverse GMA function can be used to recover deviation
field.
{
(1) (2) ( )}
( ){ }
,;
, , ; ,
p j
t j
M M M M M M
t 1,2 n j 1,2, p
= =
∀ = ∀ =
L
L L
(2)
(j) ( ( ))
(j) j
t, j
M = F(D ) ; D =invF M (3)
Mode 1 (M1,j)
Dev[mm]
10 4 0 -4
Shape Error Modes
…
Mode 2 (M2,j)
Deviation Field Mode 3 (M
3,j)
Mode n(Mn,j)
Fig. 3. GMA decomposition of deviation field into orthogonal modes.
B. Analytical Surrogate Model of Decomposed Modes
Due to parametric behavior of decomposed geometric error modes, they can be mapped with the process
parameters by developing analytical surrogate model. For example, stamping process parameters, SP, as in (4),
are used to identify the relationship with each mode, where NSP is the total number of process parameters.
{
(1) (2) (p)}
(j){ }
s, j
SP
SP = SP SP SP ; SP = SP
s = 1,2, ,N ; j = 1,2, , p
∀ ∀
L
L L
(4)
After conducting the parametric DOE study, the output responses (i.e. each shape error modes) are fitted to the analytical response surface model which is represented as a meta-model for further effect analysis and parametric effect visualization. Fig. 4 illustrates surrogate model development for each decomposed mode. The
tth mode can be expressed as function (g
t) of a set of stamping parameters (SP(j)). The analytical function as in
(5), gt, is computed in two consecutive phases: (i) model training; and, (ii) model development. Model Training
uses experimental data from the experimental characterisation. Model Development identifies the analytical
relationship between process parameters and error modes, as per (5). Adaptive polynomial fitting, spline or Kriging methods can be utilized for this purpose [17].
( )
( ), 1, 2,
j (j)
t
… … … … … … … Dev[mm] 1 0.5 0 -0.5 -1 Dev[mm] Dev[mm] Dev[mm] 2 1 0 -1 -2 0.7 0.0 -0.7 0.1 0.0 -0.1 Dev[mm] 2 1 0 -1 -2 Dev[mm] Dev[mm] Dev[mm] 1 .5 0 -.5 -1 0.5 0.0 -0.5 0.3 0.0 -0.3 Dev[mm] 4 2 0 -2 -4 Dev[mm] Dev[mm] Dev[mm] 1 .5 0 -.5 -1 0.5 0.0 -0.5 0.3 0.0 -0.3 … …
M1,1 M1,2 M1,p
M2,2 M2,2 M2,p
Mn,1 Mn,2 M
n,p
D(1) D(2) D(p)
…
SP(1) SP(2) SP(p)
g1
Model Training
Model Development
g2 gn
SP= D= M= Dev[mm] 10 4 0 -4 Dev[mm] 4 0 -4 -8 Dev[mm] 6 3 0 -3
M3,2 M3,2 M3,p
Fig. 4. Pictorial representation of analytical surrogate model development.
C. Shape Error Quantification and Effect Analysis of Process Parameters
The section focuses on a sensitivity analysis of the process parameters and quantifies the effect of process parameters on the part shape error. As the process parameters are analytically linked with each decomposed shape error modes, analysis of variance (ANOVA) has been carried out to identify the effect of parameters on each mode.
For identifying the effect size of each parameter on each mode, five steps are adapted: (i) parameter is
grouped into two levels based on medium value of each parameter (higher side of parameter value, i.e. SPs+ and
lower side of parameter value, i.e. SPs─); (ii) mean values of each response shape error mode is computed for
higher and lower group of parameter values (i.e. Mt+and Mt─ at SPs+ and SPs─ respectively); (iii) effect size calculated by taking the difference between Mt+and Mt─ ; (iv) inverse GMA applied (on Mt+─Mt─) to obtain mesh node deviations as per (5); and (v) aggregating individual modal effect (as modes are orthogonal to each other), overall shape error effect of each parameter by using (6) is determined. By applying these steps, effect size is computed for each process parameter. The corresponding effect size can be quantified by borrowing tools from signal processing, i.e. total energy of the shape error surface as per (7).
Effect of parameter SPs, 1
( )
n
z t t
t
D invF M+ M−
=
=
∑
− (6)2 1 ( ) s m SP z z
E abs D
=
=
∑
(7)III. INDUSTRIAL CASE STUDY
The developed methodology on parametric effect analysis is demonstrated with an industrial case study, where the entire part surface has been considered. Therefore, entire part shape error is analyzed for determining the effect of process parameters. The selected top-hat geometry mapped with CoP and nominal polygonal mesh geometry are shown in Fig. 5(a) and 5(b). Three parameters are chosen as case-in-point investigation: (i) material thickness (SP1); (ii) blank holding force (SP2); (iii) stamping speed (SP3). A set of top hat parts has been stamped varying stamping parameters as per DOE Table I. Each experimental run has been repeated for 5 times (the average deviation field is utilised for further calculations).
TABLE I.EXPERIMENTAL RUNS
DOE Table
Parameters
Thickness [mm] Holding Force [kN] Speed [mm/s]
E
xp
er
im
en
ta
l
R
u
n
s
(p
) SP(1) 0.6 150 10
SP(2) 0.6 150 50
SP(3) 0.6 375 10
SP(4) 0.6 375 50
SP(5) 1.2 150 10
SP(6) 1.2 150 50
SP(7) 1.2 375 10
SP(8) 1.2 375 50
The computed deviation field for SP(1) is shown in Fig. 5(c) where the color map showing the deviation of
measured CoP from nominal mesh. Deviation field is calculated for each node of the mesh model, by using the morphing mesh technique, as originally proposed in [18]. Entire part surface has been captured using GOM
optical scanner (measuring volume 320×240×240 mm3; specified accuracy of probing error 0.005 mm) and
represented as CoP data (see Fig. 6).
8.0 6.0 4.0 2.0 0.0 -1.0
(b) (c)
[image:6.595.141.456.188.338.2](a)
Fig. 5. Top-hat part (a) CoP alignment with CAD part; (b) nominal mesh; (b) deviation field (mm) computation for run SP(1).
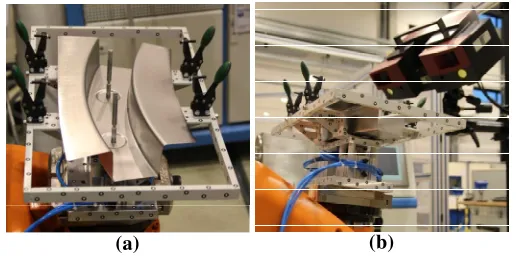
[image:6.595.153.443.412.464.2](a) (b)
Fig. 6. Experimental setup used to measure CoP of stamped parts (a) fixture to hold parts; (b) measurement setup with GOM optical scanner.
The obtained deviation field for each experimental run is decomposed by using GMA. Fig. 7 shows a sample set of GMA transformed modes, used as parameters to map with process parameters (i.e. material thickness; blank holding force; and stamping speed). Further, Fig. 8 illustrates the surrogate model (contour plots) for modes in
relation with varying blank holding force (SP2) and speed (SP3).
[image:6.595.169.427.488.616.2]D ev ia ti o n F ie ld
…
M o d e 1…
M o d e 2…
…
…
…
…
M o d e n…
8.0 6.0 4.0 2.0 0.0 -1.0 8.0 6.0 4.0 2.0 0.0 -1.0 .20 .10 .00 -.10 -.20 .30 .15 .00 -.15 -.30 1.0 .50 .00 -.50 -1.0 .50 .25 .00 -.25 -.50 .20 .10 .00 -.10 -.20 1.0 .50 .00 -.50 -1.0 M1,1 D(1)Experimental Run 1 - SP(1) Experimental Run 8 - SP(8)
M2,1 D(8) Mn,1 M1,8 M2,8 Mn,8
Fig. 7. Deviation field decomposition for each experimental run into shape error modes by using GMA approach (Deviation in mm).
Mode 1 … Mode n
…
g1 600 gn
550 500 450 400 350 -40 -45 -50 -55 -60
Fig. 8. Surrogate model linking shape error modes and process parameters (at SP1=0.6 mm).
Main Effect of Material Thickness
(SP1) on Shape Error
Main Effect of Blank Holding Force
(SP2) on Shape Error
Main Effect of Stamping Speed
(SP3) on Shape Error
2.5 2.0 1.5 1.0 0.5 0.0 -0.2 2.5 2.0 1.5 1.0 0.5 0.0 -0.2 2.5 2.0 1.5 1.0 0.5 0.0 -0.2
Interaction Effect of Material Thickness
&
Blank Holding Force on Shape Error
Interaction Effect of Material Thickness
& Stamping Speed
on Shape Error
Interaction Effect of Blank Holding Force
& Stamping Speed
on Shape Error
1.4
1.0
0.6
0.2
-0.2
1.4
1.0
0.6
0.2
-0.2
1.4
1.0
0.6
0.2
-0.2
Fig. 10. Interaction effect plot of process parameters on shape error generation.
By using (7), each parametric contribution is quantified and they are ranked in descending order as per their contributions (See Table II). The total energy associated with each shape error surface generated by main and interaction of factors is shown in Fig. 11 with their relative contribution (%).
32.39
18.27 17.88
10.91 11.98
8.57
Material Thickness Blank Holding Force Stamping Speed
Material Thickness * Blank Holding Force Material Thickness * Stamping Speed Blank Holding Force * Stamping Speed
Fig. 11. Relative contribution (%) of factors on shape error generation.
TABLE II.RANKING OF ALL EFFECTS
Rank Factor Total Energy (Relative
Contribution, %)
1 Material Thickness 10801.44 (32.39%)
2 Blank Holding Force 6092.33 (18.27%)
3 Stamping Speed 5963.25 (17.88%)
4 Material Thickness* Stamping Speed 3638.04 (11.98%)
5 Material Thickness*Blank Holding Force 3994.21 (10.91%)
6 Blank Holding Force*Stamping Speed 2857.53 (8.57%)
IV. CONCLUSION AND FINAL REMARKS
The proposed methodology allows to quantify the contributions coming from process parameters on generating the shape error. The methodology uses CoP data measured by optical measurement gauge which represents whole part surface based shape error. Shape error is defined as deviation field using CoP data which is non-parametric in nature. Therefore, deviation field decomposition (i.e. GMA techniques) has been implemented to convert CoP data into functional parametric shape error modes. Subsequently, surrogate model technique has been applied to link shape error with process parameters. Furthermore, effect size of each process parameter has been calculated and quantified by using total energy indicator. The proposed methodology significantly explores and contributes to the following areas:
• The developed model-driven technique represents a step towards automatic closed-loop process control
and subsequently process adjustment for stamping process.
• Costly and time-consuming trial-and-error approaches can be reduced by automatic selection and tuning
• The model-driven approach can forecast geometrical variations for given set of process parameters (forward process), and consequently can optimise (feedback process) the process parameters to achieve given quality standards.
Further investigations will be focused on root cause identification of global/local shape error occurring during production and development of intelligent closed-loop process adjustments.
Acknowledgment
This research has been partially supported by the IDEAS joint Lab at the University of Naples (IT). We acknowledge Fraunhofer IWU (Dresden, Germany) for the technical support to conduct stamping trials.
References
[1] T. de Souza and B. Rolfe, "Multivariate modelling of variability in sheet metal forming," Journal of Materials Processing Technology, vol. 203, pp. 1-12, 2008.
[2] A. Das, P. Franciosa, P. K. S. Prakash, and D. Ceglarek, "Transfer function of assembly process with compliant non-ideal parts," Procedia CIRP, vol. 21, pp. 177-182, 2014.
[3] P. Franciosa, A. Das, D. Ceglarek, L. Bolognese, C. Marine, and A. Mistry, "Design synthesis methodology for dimensional management of assembly process with compliant non-ideal parts," presented at the Proceedings of Joint Conference on Mechanical, Design Engineering & Advanced Manufacturing, Toulouse, France, 2014.
[4] K. Majeske and P. Hammett, "Identifying sources of variation in sheet metal stamping," International Journal of Flexible Manufacturing Systems, vol. 15, pp. 5-18, 2003.
[5] Foresight, "The factory of the future," Government Office for Science, London, UK2013.
[6] A. Das, P. Franciosa, S. Gerbino, and D. Williams, "Prediction of Geometric Errors of Stamped Sheet Metal Parts using Deviation Field Decomposition," in International Conference on Competitive Manufacturing (COMA), Stellenbosch, South Africa, 2016. [7] H. S. Kim and M. Koç, "Numerical investigations on springback characteristics of aluminum sheet metal alloys in warm forming
conditions," Journal of Materials Processing Technology, vol. 204, pp. 370-383, 2008.
[8] V. D. Nguyen, P.-A. Adragna, and P. Lafon, "Predicting the effects of material and process parameters on springback by fem numerical simulation in sheet metal forming," in 10th International Conference on Modeling, Optimization and Simulation, Nancy, France, 2014.
[9] F.-Z. Oujebbour, A. Habbal, and R. Ellaia, "Optimization of stamping process parameters to predict and reduce springback and failure criterion," Structural and Multidisciplinary Optimization, vol. 51, pp. 495-514, 2015.
[10] J. Cao, B. Kinsey, and S. A. Solla, "Consistent and Minimal Springback Using a Stepped Binder Force Trajectory and Neural Network Control," Journal of Engineering Materials and Technology, vol. 122, pp. 113-118, 1999.
[11] S. Kashid and S. Kumar, "Applications of artificial neural network to sheet metal work - a review," American Journal of Intelligent Systems, vol. 2, pp. 168-176, 2012.
[12] Z. Zhou and X.-R. Cao, "Optimal process control in stamping operation," Quality Engineering, vol. 6, pp. 621-631, 1994. [13] J. Ramsay and B. W. Silverman, Functional data analysis: Springer, 2005.
[14] A. Das, "Shape variation modelling, analysis and statistical control for assembly system with compliant parts," University of Warwick, 2016.
[15] A. Das, P. Franciosa, and D. Ceglarek, "Fixture design optimisation considering production batch of compliant non-ideal sheet metal parts," Procedia Manufacturing, vol. 1, pp. 157-168, 2015.
[16] A. Das, P. Franciosa, D. Williams, and D. Ceglarek, "Physics-driven shape variation modelling at early design stage," Procedia CIRP, vol. 41, pp. 1072-1077, 2016.
[17] R. Jin, W. Chen, and T. W. Simpson, "Comparative studies of metamodelling techniques under multiple modelling criteria," Structural and Multidisciplinary Optimization, vol. 23, pp. 1-13, 2001.