Manuscript version: Author’s Accepted Manuscript
The version presented in WRAP is the author’s accepted manuscript and may differ from the published version or Version of Record.
Persistent WRAP URL:
http://wrap.warwick.ac.uk/110261
How to cite:
Please refer to published version for the most recent bibliographic citation information. If a published version is known of, the repository item page linked to above, will contain details on accessing it.
Copyright and reuse:
The Warwick Research Archive Portal (WRAP) makes this work by researchers of the University of Warwick available open access under the following conditions.
© 2018 Elsevier. Licensed under the Creative Commons Attribution-NonCommercial-NoDerivatives 4.0 International http://creativecommons.org/licenses/by-nc-nd/4.0/.
Publisher’s statement:
Please refer to the repository item page, publisher’s statement section, for further information.
Subsystem identification in structures with a human occupant
1
based on composite frequency response functions
2
3
Xiaojun Wei* a, c, Stana Živanović b, c, Justin Russell c, John E. Mottershead d 4
a Department of Mechanical and Vehicle Engineering, Hunan University, Changsha 410082,
5
China 6
b College of Engineering, Mathematics and Physical Sciences, University of Exeter, Exeter,
7
EX4 4QF, UK 8
c School of Engineering, University of Warwick, Coventry, CV4 7AL, UK
9
d Department of Mechanical, Materials and Aerospace Engineering, University of Liverpool,
10
Liverpool, L69 3GH, UK 11
*Corresponding author, E-mail: [email protected] 12
13
Abstract
14
A method is proposed for the subsystem identification of a composite system composing a 15
lightweight low-frequency civil engineering structure and a human occupant. It is shown for 16
the first time that the dynamics of the structure and the stiffness and damping of the human 17
occupant can be determined from the frequency response functions of the composite system 18
and the known mass of the human occupant. The advantage of the proposed approach over 19
existing methods is not only in the simplicity of problem formulation but also in the substantial 20
reduction of experimental complexity. Subsystem identification is demonstrated using a 21
numerical example and two experimental case studies. In the first experimental case study, the 22
method is applied to a laboratory bridge with a human occupant in a standing posture and 23
frequency response functions are measured using shaker testing. In the second case study, the 24
method is applied to a laboratory bridge with a hammer operator crouching on the bridge to 25
perform impact hammer tests. It is demonstrated that subsystem dynamics can be accurately 26
identified. The method is especially applicable to the correction of the effect of the hammer 27
generalised for the compenstation of the effects of the electrodynamic shaker in shaker testing 29
for civil engineering applications. 30
Keywords: Human-structure interaction; subsystem identification; impact hammer testing; 31
frequency response function. 32
1. Introduction
33
Human-structure interaction is a well-recognised phenomenon which involves the interplay of 34
the dynamics of the two subsystems in human-structure systems, i.e. the human occupant(s) 35
and the structure supporting the human occupant(s). This mechanism can lead to various 36
modifications of the dynamic properties of the structure, including the increase [1, 2] or 37
decrease [1-4] of natural frequencies, increase [1-4] or decrease [2] of damping ratios, and even 38
the appearance of new modes [1, 2]. The actual change of dynamic properties and the extent of 39
human-structure interaction are dependent upon the mass, damping and frequency ratios 40
between the occupant(s) and the structure [2, 5]. 41
The effect of human-structure interaction has become of major importance in vibration 42
serviceability design of lightweight and slender structures in the last two decades [1, 6-9]. In 43
structural design applications, the dynamics of the human body are commonly represented by 44
a single degree of freedom (SDOF) mass-spring-damper model [10-18]. The research mainly 45
concerns identifying human body dynamics [10-18] and predicting the dynamics of human-46
structure systems [5, 18-22]. The human body dynamics may be identified directly by curve 47
fitting measured driving-point apparent masses [11, 12] or derived indirectly from the known 48
dynamics of the empty structure and the human-structure system [10, 13-18]. When the 49
dynamics of the human occupant and the empty structure are known, the dynamic prediction 50
of the joint system is relatively straightforward. Specifically, a spatial or modal model of the 51
joint system is first constructed by combining the known spatial or modal model of the empty 52
structure and the human model, based on which the dynamic prediction is performed. 53
Manually operated impact hammer testing is another structural engineering application which 54
involves human-structure interaction. It has been widely utilised for modal analysis of small 55
and medium civil engineering structures thanks to its convenience, efficiency and economy [23, 56
Consequently, the identified dynamic properties are essentially those of the human-structure 58
system rather than those of the empty structure. For some lightweight low-frequency structures, 59
especially with frequencies close to the frequency of the human body, the influence of the 60
human occupant can be significant [18, 25]. Unfortunately, existing system identification 61
methods using data from impact hammer tests routinely neglect the effect of the hammer 62
operator, which might lead to significant errors in the dynamic identification of the empty 63
structure. Little attention has been paid to the elimination of the effect of the hammer operator 64
in impact hammer testing. Recently, Wei and Živanović [18] stressed the importance of the 65
effect of the hammer operator on the dynamic identification of the empty structure and 66
presented explicit formulas for deriving the frequency response functions (FRFs) of the empty 67
structure provided that the human body dynamics and the measured FRFs of the human-68
structure system are both known. In addition, other methods for identifying human body 69
dynamics [13-16] could also be used for the dynamic identification of the empty structure if 70
the dynamics of the human body and the human-structure system are both known. However, 71
the aforementioned methods [13-16, 18] require the identification of the dynamics of the 72
particular hammer operator from laboratory experiments, in which the hammer operator should 73
keep the same posture as that employed in the on-site impact hammer tests. An alternative 74
might be to adopt existing human-body models from the literature, but this introduces errors 75
due to inter- and intra-subject variations [11, 15, 26, 27]. 76
This paper proposes a new method for identifying the dynamics of the human body and the 77
empty structure in a human-structure system, based only on the measured FRFs of the 78
composite system. A pair of eigenvalues of the empty structure are first identified using three 79
measured direct FRFs of the structure with a human occupant at three different locations. In 80
the next step, the human body dynamics are explicitly derived in terms of the identified 81
eigenvalues of the empty structure and FRFs of the human-structure system. Finally, the FRFs 82
of the empty structure are explicitly deduced in terms of the FRFs of the human-structure 83
system and the identified human body dynamics. Therefore, the proposed method is superior 84
to the existing methods for identifying human body dynamics [10, 13-18] which require 85
knowledge of both the dynamics of the empty structure and the human-structure system. In 86
addition, the proposed method is superior to the existing methods for identifying the dynamics 87
of the empty structure which require knowledge of the human body dynamics, typically 88
either a lightweight low-frequency structure by the indirect method [10, 13-18], or a shaker 91
and a force platform directly [11]. The necessary equipment may not be available to industrial 92
engineers and even to researchers. The proposed method, requiring only on-site experiments 93
for obtaining the FRFs of the structure occupied by a human occupant, is more economical 94
than existing methods and avoids the effects of the inter- and intra-subject variations caused by 95
adopting standard human-body dynamic models from literature. The proposed method is 96
especially applicable to the elimination of the effect of the hammer operator in manually 97
operated impact hammer testing. Additionally, this approach can be generalised to correct the 98
effects of the electrodynamic shaker in shaker testing. Furthermore, this paper dicusses the 99
effects of the time delay between the response and force signal measurement on measured FRFs 100
of the structure under test and proposes appropriate strategies for correcting these effects. This 101
paper concerns a single human occupant interaction with lightweight low-frequency structures 102
(i.e. vibration modes with natural frequencies up to about 8 Hz) with well-sperated modes. In 103
this frequency region, the first vibration mode of the human occupant is likely to interact with 104
the structure, and therefore the human body is modelled as a SDOF system. The effect of the 105
uncertainty in human body dynamics on the dynamic identification of the empty structure can 106
be investigated using the perturbation method presented in the paper [18], therefore it is not 107
elaborated here. 108
Following this introductory section, Section 2 introduces the theory for the identification of the 109
dynamics of the human body and the empty structure in a human-structure system. A numerical 110
illustration of the working of the method is presented in Section 3, whilst its experimental 111
demonstrations are presented in Section 4. Conclusions are drawn in Section 5. 112
2. Theory
113
This section presents the theory for the identification of the dynamics of both the human body 114
and the empty structure from the measured FRFs of a human-structure system. 115
2.1.The relationship between the FRFs of the empty structure and the human-structure
116
system
117
The dynamics of a linear structure having 𝑛 DOFs are modified when occupied by a stationary
118
human. The SDOF dynamics of the human body are represented by mass 𝑚 , damping 𝑐 and
119
previous studies [3, 10, 18, 28-31]. Therefore, the presence of the human occupant introduces 121
an additional DOF, denoted as the (𝑛 + 1)-th DOF. Without loss of generality, it is assumed
122
that the human occupant is located at the 𝑝-th DOF (𝑝 ≤ 𝑛) of the structure. The stiffness and 123
damping elements of the human body are connecting the 𝑝-th and (𝑛 + 1)-th DOFs and the
124
mass of the human body is considered to be concentrated at the (𝑛 + 1)-th DOF.
125
Wei and Živanović [18] showed that the direct receptance at the 𝑝-th DOF of the empty 126
structure ℎ (𝑠) and that of the human-structure system ℎ , (𝑠), where 𝑠 is the Laplace 127
variable and 𝑝 in the superscript indicates the location of the human occupant, may be 128
expressed as 129
ℎ (𝑠) =
( ) , ( )
( ) ( ) , ( ) (1)
130
and the cross receptance between the 𝑞-th DOF (𝑞 ≤ 𝑛) and the 𝑝-th DOF of the empty
131
structure ℎ (𝑠) and that of the human-structure system ℎ , (𝑠) are given by 132
ℎ (𝑠) = ℎ , (𝑠) +
, ( )( ) , ( )
( ) ( ) , ( ). (2)
133
2.2.Identification of a pair of eigenvalues of the empty structure
134
The denominator of Eq. (1) or (2) generates the characteristic equation 135
1 + (𝑐 𝜇 + 𝑘 ) − (𝑐 𝜇 + 𝑘 )ℎ , (𝜇 ) = 0 (3) 136
where 𝜇 is the 𝑖-th eigenvalue corresponding the 𝑖-th mode of the empty structure. 137
Similarly, if the human occupant is located at the 𝑞-th DOF of the structure, then 138
where ℎ , (𝑠) is the direct receptance at the 𝑞-th DOF of the structure with the human 140
occupant at the 𝑞-th DOF. 141
Subtracting Eq. (4) from Eq.(3) leads to 142
(𝑐 𝜇 + 𝑘 ) ℎ , (𝜇 ) − ℎ , (𝜇 ) = 0. (5) 143
Since the eigenvalues of an actual underdamped stable structure are complex, 144
(𝑐 𝜇 + 𝑘 ) ≠ 0. (6)
145
Therefore, Eq. (5) is equivalent to 146
ℎ , (𝜇 ) − ℎ , (𝜇 ) = 0 (7)
147
which indicates that the eigenvalues of the empty structure are zeros of the rational function 148
𝛥ℎ (𝑠) = ℎ , (𝑠) − ℎ , (𝑠) = 0. (8) 149
However, 𝛥ℎ (𝑠) generally has additional zeros that are not related to the dynamics of the
150
empty structure. The selection of correct eigenvalues for the empty structure requires additional 151
checks. 152
Due to relatively small changes of the human-structure system properties compared to the 153
properties of the empty structure, the eigenvalues of any particular mode of the empty structure 154
will be close to those of the corresponding mode of the human-structure system. Let us assume 155
that the 𝑖-th pair of complex conjugate eigenvalues 𝜇 and 𝜇̄ of the empty structure are the 156
targets for identification. The 𝑖-th pair of complex conjugate eigenvalues 𝜇 and 𝜇̄ , 157
corresponding to the 𝑖-th mode dominated by the structural motion of the human-structure 158
system, should be good initial guesses for 𝜇 and 𝜇̄ , respectively, when solving Eq. (8) by 159
using algorithms for solving nonlinear equations, e.g. the trust region algorithm [32]. In the 160
frequency range around the 𝑖-th mode dominated by the structural motion of the human-161
nearest to their peaks (under the assumption that vibration modes of the empty structure are 163
well sperated). The zeros of 𝛥ℎ (𝑠) related to the dynamics of the empty structure can be
164
checked since the correct eigenvalues of the empty structure should also be the zeros of 165
𝛥ℎ (𝑠) = ℎ , (𝑠) − ℎ , (𝑠) and 𝛥ℎ (𝑠) = ℎ , (𝑠) − ℎ , (𝑠) where ℎ , (𝑠) is the 166
measured direct receptance at the 𝑟-th DOF of the human-structure system with the human
167
occupant at the 𝑟-th DOF. 168
2.3.Identification of the dynamics of the human body
169
Let us assume that the eigenvalues 𝜇 and 𝜇̄ of the empty structure have been identified by 170
the proposed approach described in Section 2.2. The eigenvalues 𝜇 and 𝜇̄ should satisfy 171
Eq.(3), i.e. 172
𝑐
𝑘 =
𝜇 1
𝜇̄ 1 ⎣ ⎢ ⎢ ⎢
⎡ ,
̄
̄ , ̄ ⎦⎥
⎥ ⎥ ⎤
(9)
173
Eq. (9) infers that the damping 𝑐 and stiffness 𝑘 of the human body can be calculated using
174
the mass 𝑚 of the human body and the direct receptance of the human-structure system 175
ℎ , (𝑠) evaluated at a pair of eigenvalues 𝜇 and 𝜇̄ of the empty structure. Eq. (9) always 176
results in real solutions for 𝑐 and 𝑘 due to the use of the complex conjugate pair 𝜇 and 𝜇̄ .
177
If the measured quantity is accelerance rather than receptance, an alternative form of Eq. (9) 178
should be used. It is known that the acceleration 𝒂(𝑠) and the displacement 𝒙(𝑠) are related by 179
𝒂(𝑠) = 𝑠 𝒙(𝑠). The receptance matrix 𝑯 (𝑠) and the accelerance matrix 𝑯 (𝑠) satisfy the 180
relationship 181
𝑯 (𝑠) =𝑯 ( ) (10)
182
𝑐 𝑘 = 𝜇 1 𝜇̄ 1 ⎣ ⎢ ⎢ ⎢ ⎡ , , ̄ , , ̄ ⎦⎥ ⎥ ⎥ ⎤ (11) 184
Note that the same human body dynamics will be identified if any other direct receptance (e.g. 185
ℎ , or ℎ , ) of the human-structure system is used in Eq. (9) because they are equal to each 186
other at the eigenvalues of the empty structure. 187
2.4.Identification of the dynamics of the empty structure
188
The direct and cross receptances of the empty structure can be calculated using Eqs. (1) and 189
(2), the human body dynamics and the direct and cross receptances of the human-structure 190
system. The frequencies and damping ratios can then be obtained by solving the characteristic 191
equation of the receptances of the empty structure. Since the human body dynamics can be 192
identified from measured direct receptances of the human-structure system, the dynamics of 193
the empty structure can be obtained entirely from measured direct and cross receptances of the 194
human-structure system. 195
3. Numerical example
196
A numerical example was conducted based on an actual glass fibre reinforced polymer simply 197
supported bridge [25]. A schematic of the bridge is shown in Fig. 1. The bridge model has a 198
span of 𝐿 = 16.9 m, density 𝜌 = 1.9 × 10 kg∙m-3, area of cross section 𝐴 = 4.89 × 10 m2, 199
longitudinal modulus of elasticity 𝐸 = 2.47 × 10 N∙m-2, second moment of area 𝐼 = 3.5 ×
200
10 m4, shear modulus 𝐺 = 3.9 × 10 N∙m-2 and shear coefficient 𝜅 = 0.08. A human 201
occupant having mass 𝑚 = 62 kg, natural frequency 𝑓 = 5.0 Hz and damping ratio 𝜁 =
202
37.0%, corresponding to the human model for standing posture specified in ISO 5982 [33], is 203
assumed to stand on the bridge. The bridge systems with the human occupant located at points 204
1, 2 and 3 are designated as the systems SH1, SH2 and SH3, respectively. 205
A two-dimensional finite element (FE) model of the bridge was developed using an improved 206
two-node Timoshenko beam finite element [34]. The FE model consisted of 120 elements of 207
equal length. Proportional damping 𝑪 = 𝛼𝑴 + 𝛽𝑲 (𝛼 = 𝛽 = 0.0008) was assumed. Similarly,
208
210
Fig. 1 A schematic of a simply supported bridge with a human occupant and a linear chirp excitation at
211
point 1
212
The four FE models were first used for eigenvalue analysis, which generated the modal 213
parameters of the corresponding actual systems. The natural frequencies and damping ratios of 214
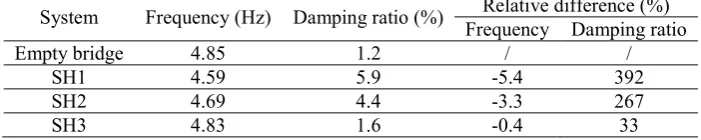
the first mode dominated by structural motion are summarised in Table 1. It is shown that while 215
the relative differences of frequencies of the systems SH1, SH2 and SH3 with respect to the 216
fundamental frequency of the empty bridge are -5.4%, -3.3% and -0.4%, respectively, the 217
counterparts of the damping ratios are 392%, 267% and 33%, respectively. It can be seen that 218
the presence of the human occupant can significantly modify the dynamics of the empty bridge 219
and its effect depends upon the human occupant location. 220
Table 1 Modal parameters of the first structural motion dominated mode
221
System Frequency (Hz) Damping ratio (%) Frequency Damping ratio Relative difference (%)
Empty bridge 4.85 1.2 / /
SH1 4.59 5.9 -5.4 392
SH2 4.69 4.4 -3.3 267
SH3 4.83 1.6 -0.4 33
Based on the FE model, the time-domain responses were numerically calculated for the empty 222
bridge driven by a linear chirp excitation force (having magnitude 100 N and sweeping from 1 223
Hz to 10 Hz) at point 1 for 112 seconds (s) and then left to return to rest over the next 8 s. The 224
actual direct receptance ℎ (𝑠) of the empty bridge was then calculated using the excitation
225
force and the resultant vertical displacement response at point 1. Similarly, the direct 226
receptances of the systems SH1, SH2 and SH3, i.e. ℎ , (𝑠), ℎ , (𝑠) and ℎ , (𝑠), were 227
calculated. In this example, the direct receptances ℎ , (𝑠), ℎ , (𝑠) and ℎ , (𝑠) play the role 228
of known (usually by measurement) FRFs of the systems SH1, SH2 and SH3. These three 229
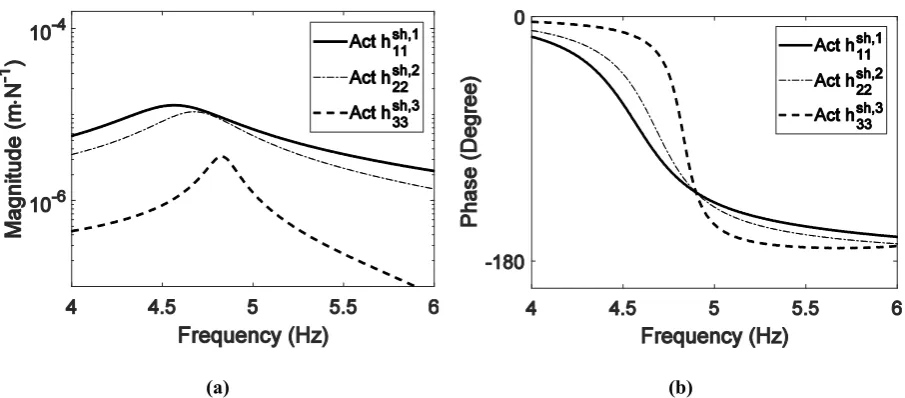
actual receptances (abbreviated to ‘Act’ in Fig. 2) are depicted by the thick solid line, thin dash-230
dotted line and thick dashed line in Fig. 2, respectively. They exhibit different peak frequencies 231
[image:10.595.122.473.437.507.2](a) (b) Fig. 2 Direct receptances 𝒉𝟏𝟏
𝒔𝒉,𝟏(𝒔),
𝒉𝟐𝟐
𝒔𝒉,𝟐(𝒔) and
𝒉𝟑𝟑
𝒔𝒉,𝟑(𝒔): (a) Magnitude, (b) Phase
233
The following demonstrates how to identify the subsystem dynamics from the known 234
receptances ℎ , (𝑠), ℎ , (𝑠) and ℎ , (𝑠). ℎ , (𝑠) was curve fitted in the frequency range 235
from 3 Hz to 7 Hz using the rational fraction polynomial method [35], which resulted in an 236
analytical expression 237
ℎ , = (12)
238
Where 𝑎 = 2.7933 × 10 s4, 𝑎 = −5.2539 × 10 s3, 𝑎 = 6.5769 × 10 s2, 𝑎 =
239
−1.9874 × 10 s, 𝑎 = 6.3407 × 10 , 𝑎 = 1.7085 × 10 s-1, 𝑎 = 0.0277 s-2, 𝑏 = 240
24.1786 N∙s2∙m-1, 𝑏 = 82.3920 N∙s∙m-1 and 𝑏 = 2.0072 × 10 N∙m-1. It should be noted 241
that the rational expression of ℎ , (𝑠) shown in Eq. (12) is improper and cannot be
state-242
space realisable. Extra numerator polynomial terms in Eq. (12) are used for the compensation 243
of the residual effects of out-of-band modes such that a good fit is achieved. More information 244
about the use of this technique in modal parameter identification applications can be found 245
elsewhere [35]. Its characteristic equation generated the eigenvalue pair 𝜇 ,, = −1.7038 ±
246
28.7617i s-1 for the first mode dominated by the structural motion of the system SH1. The 247
analytical expressions for ℎ , (𝑠) and ℎ , (𝑠) were obtained by the same method. Using 248
𝜇 ,, as the initial guesses, a pair of eigenvalues of the empty bridge was identified as 𝜇 , =
249
−0.3735 ± 30.4551i s-1 , i.e. the roots 𝑠 = 𝜇
, of the function
250
𝜇 , were also found to be the zeros of 𝛥ℎ (𝑠) and 𝛥ℎ (𝑠), which confirms 𝜇 , were the 252
eigenvalues of the empty structure. The corresponding natural frequency and damping ratio 253
were then calculated to be 4.85 Hz and 1.2%, which agree with the actual modal parameters of 254
the empty bridge given in Table 1. While the magnitude curves of ℎ , (𝑠), ℎ , (𝑠)
255
andℎ , (𝑠), shown in Fig. 2(a), do not exhibit their intersections at 𝜇 , because the 256
intersections are located away from the imaginary axis, their phase curves, shown in Fig. 2(b), 257
indicate the intersections. 258
[image:12.595.182.410.243.423.2]259
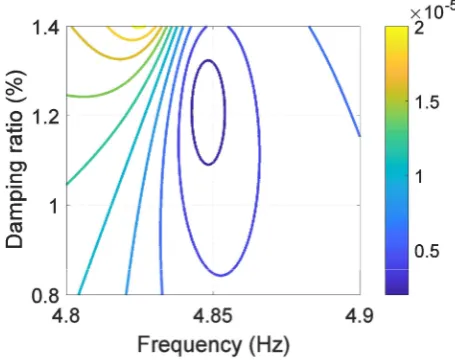
Fig. 3 The magnitude of 𝜟𝒉𝟏𝟑(𝒔) against frequency and damping ratio.
260
In addition, the initial guesses for the solultions to Eq. (13) can be predicted graphically. Fig. 261
3 shows the contour map of the magnitude of 𝛥ℎ (𝑠) against frequency and damping ratio,
262
which indicates that values around 4.85 Hz and 1.2% are good initial guesses for the frequency 263
and damping ratio of the empty structure, respectively, around which 𝛥ℎ (𝑠) is at its 264
minimum. Note that such a contour map is suggested to be plotted around the eigenvalues of 265
the human-structure system since the eigenvalues of any particular mode of the empty structure 266
will be close to those of the corresponding mode of the human-structure system. 267
Based on the human body mass, 𝑚 = 62 kg, the analytical expression ℎ , (𝑠) described by
268
Eq. (12) and the identified eigenvalues 𝜇 , of the empty bridge, the damping and stiffness of 269
the human body were calculated as 270
𝑐
= 𝜇 1
( )
( ) , ( )
The corresponding frequency and damping ratio of the human body were then calculated as 272
𝑓 = 5.0 Hz and 𝜁 = 37.0%, which are exactly the properties of the actual human occupant 273
stated at the outset. 274
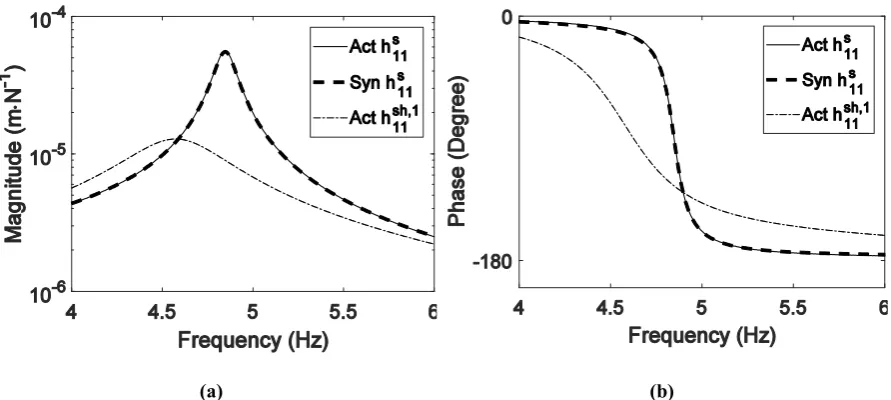
[image:13.595.79.525.156.356.2](a) (b)
Fig. 4 Direct receptances of SH1 and the empty structure: (a) Magnitude, (b) Phase
275
The direct receptance at point 1 of the empty bridge was then synthesised using Eq.(1), denoted 276
as Syn ℎ (𝑠) and shown by the thick dashed curve in Fig. 4. The synthesised receptance is in 277
good agreement with its actual counterpart (abbreviated to ‘Act’ and depicted by the thin solid 278
curve in Fig. 4). By solving the characteristic equation for Syn ℎ (𝑠) the fundamental 279
frequency and damping ratio of the empty bridge were found to be 4.85Hz and 1.2%, which 280
agree with the actual counterparts of the empty bridge. Similarly, the receptances ℎ (𝑠) and 281
ℎ (𝑠) of the empty structure were also obtained. The three direct receptances of the empty 282
structure exhibited the same peak frequency after the elimination of the effect of the human 283
occupant. 284
4. Experimental case studies
285
This section presents two experiments for verifying the theory of subsystem identification. The 286
first experiment aims to identify the dynamics of the subsystems of a steel-concrete composite 287
bridge with a human occupant in a standing posture. In this experiment, FRFs were measured 288
by using shaker testing. The second experiment demonstrates how to eliminate the effect of the 289
hammer operator in manually operated impact hammer testing performed on the same bridge. 290
The experiments were approved by the Biomedical and Scientific Research Ethics Committee 291
4.1.Subsystem identification using measured FRFs from shaker testing
293
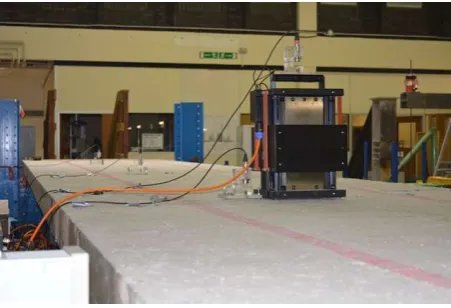
A steel-concrete composite bridge situated in the Structures Laboratory at the University of 294
Warwick (Fig. 5) with a human occupant in a standing posture was considered for subsystem 295
identification. The bridge is 19.9 m long and 2 m wide and sits on two meccano frames with 296
1.78 m overhang at each end. The bridge and the human occupant weigh 16,500 kg and 100 297
kg, respectively. 298
4.1.1.Shaker testing
299
The accelerances of the empty bridge and the human-bridge system were measured using 300
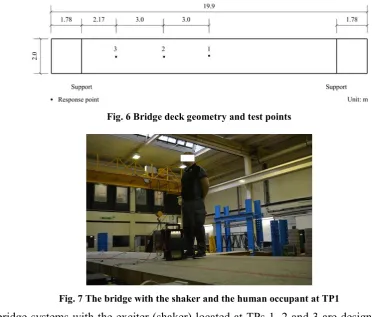
shaker testing. The test points (TPs) are shown in Fig. 6. An electrodynamic shaker of mass 301
105.5 kg (Model APS 400), as shown in Fig. 5, was placed sequentially at TPs 1, 2 and 3 on 302
the deck to excite the bridge. The generated force was indirectly measured using an 303
accelerometer (Honeywell QA750, nominal sensitivity 1300 mV/g) attached to the moving 304
armature. Another three accelerometers of the same type were placed at TPs 1, 2 and 3 to 305
measure the vibration responses of the unoccupied bridge and the human-bridge systems in the 306
vertical direction. The data acquisition system consisted of a laptop, a 16-channel data logger 307
(SignalCalc Mobilyser by Data Physics), a signal conditioner and a power amplifier (Model 308
APS 145). A chirp excitation force in the frequency range 1 - 9 Hz was applied to the structure 309
for 64 seconds. A data acquisition window was set to 128 seconds. The sampling frequency 310
was 512 Hz. Four averages were used to minimise the effects of noise. No window was used 311
since the vibration responses returned to the ambient vibration level at the end of the acquisition 312
window. The typical standing posture of the human is shown in Fig. 7. 313
[image:14.595.185.411.547.701.2]314
Fig. 5 The bridge with the shaker at TP1
316
Fig. 6 Bridge deck geometry and test points
317
[image:15.595.98.471.71.388.2]318
Fig. 7 The bridge with the shaker and the human occupant at TP1
319
The bridge systems with the exciter (shaker) located at TPs 1, 2 and 3 are designated as the 320
systems SE1, SE2 and SE3, respectively. The bridge systems with the human occupant and the 321
shaker at TPs 1, 2 and 3 are designated as the systems SHE1, SHE2 and SHE3, respectively. 322
The bridge systems with the human occupant at TPs 1, 2 and 3 are designated as the systems 323
SH1, SH2 and SH3, respectively. 324
The systems SE1, SE2, SE3, SHE1, SHE2 and SHE3 were excited at three different force levels. 325
The maximum accelerations at TP1 of SE1, TP2 of SE2 and TP3 of SE3 ranged from 0.30 m∙s
-326
2 to 0.70 m∙s-2, from 0.22 m∙s-2 to 0.50 m∙s-2 and from 0.14 m∙s-2 to 0.32 m∙s-2, respectively. 327
The maximum accelerations at TP1 of SHE1, TP2 of SHE2 and TP3 of SHE3 ranged from 328
0.27 m∙s-2 to 0.68 m∙s-2, from 0.21 m∙s-2 to 0.49 m∙s-2 and from 0.13 m∙s-2 to 0.28 m∙s-2, 329
respectively. The frequencies and damping ratios of SE1 showed negligible variation with the 330
response level. The same conclusion was drawn for SE2, SE3, SHE1, SHE2 and SHE3. These 331
findings suggest that the systems SE1, SE2, SE3, SHE1, SHE2 and SHE3 exhibited linear 332
behaviour in the observed amplitude range. Therefore, it is reasonable to assume that the human 333
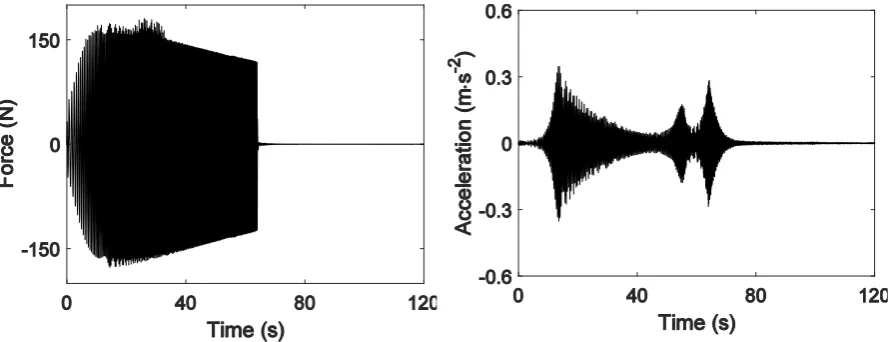
body exhibited linear behaviour during the testing as well. The force level when excited at TP2 334
of SHE2 chosen for presentation in this paper is shown in Fig. 8 whilst the corresponding 335
Fig. 8 Excitation force at TP2 of SHE2 Fig. 9 Acceleration at TP2 of SHE2
While the direct accelerances at TP1 of SE1, TP2 of SE2 and TP3 of SE3, denoted as ℎ ,, ,
337
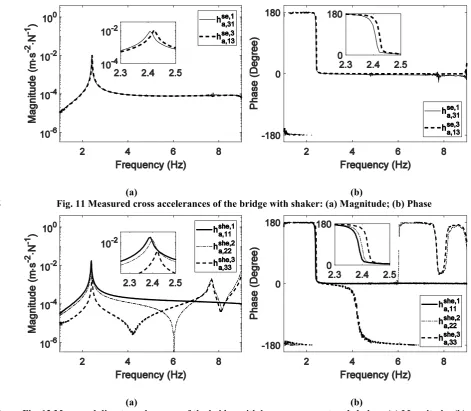
ℎ ,, and ℎ ,, , respectively, are shown in Fig. 10, the cross accelerances of SE1, excited at 338
TP1 and measured at TP3, and of SE3, excited at TP3 and measured at TP1, denoted as ℎ ,,
339
and ℎ ,, , respectively, are shown in Fig. 11. The direct accelerances at TP1 of SHE1, TP2 of 340
SHE2 and TP3 of SHE3, denoted as ℎ , , , ℎ , , and ℎ , , respectively, are shown in Fig.
341
12. Fig. 10 and Fig. 11 show that the presence of the shaker on the deck slightly modifies the 342
dynamics of the bridge under test, i.e. it shifts the natural frequency and affects the reciprocity 343
check. Therefore, the effect of the shaker should be first eliminated from the measured 344
accelerences shown in Fig. 12 before they are used to identify the dynamics of the human body 345
and the empty bridge. 346
[image:16.595.79.524.70.241.2](a) (b)
Fig. 10 Measured direct accelerances of the bridge with shaker: (a) Magnitude; (b) Phase
[image:16.595.78.523.511.703.2](a) (b)
Fig. 11 Measured cross accelerances of the bridge with shaker: (a) Magnitude; (b) Phase
348
[image:17.595.53.525.67.478.2](a) (b)
Fig. 12 Measured direct accelerances of the bridge with human occupant and shaker: (a) Magnitude; (b)
349
Phase
350
4.1.2.The elimination of the effect of the electrodynamic shaker
351
The electrodynamic shaker concentrates the majority of its mass on its base (79 kg), while the 352
moving mass is only 26.5 kg. In this research, the shaker is modelled as a mass block of 105.5 353
kg. By using Eqs. (21) and (22) from Appendix A, the effect of the shaker on the measured 354
accelerences of the empty bridge can be eliminated. Fig. 13 shows the corrected cross 355
accelerances ℎ , (thin solid curve) and ℎ , (thick dashed curve) of the empty bridge, which 356
indicate that the principle of reciprocity is now satisfied. In addition, the natural frequency and 357
damping ratio identified from the corrected accelerances of the empty bridge agree well with 358
the measured counterparts from impact hammer testing in which the hammer operator stood 359
(a) (b)
Fig. 13 Corrected cross accelerances of the empty bridge: (a) Magnitude; (b) Phase
361
Similarly, the effect of the shaker embedded in the measured accelerances ℎ , , , ℎ , , , ℎ , , , 362
ℎ , , and ℎ , , can be eliminated. For instance, the measured accelerance of SHE1 ℎ , ,
363
was first curve fitted using the rational fraction polynomial method [35]. Good agreement 364
between the curve-fitted accelerance (thick dashed curve) and its measured counterpart (thin 365
solid curve) is demonstrated in Fig. 14. The analytical expression of the curve-fitted 366
accelerance is 367
ℎ , , (𝑠) = (14)
368
where 𝑎 = 2.4738 × 10 , 𝑎 = −1.2842 × 10 s-1, 𝑎 = −1.6082 × 10 s-2, 𝑏 =
369
[image:18.595.78.525.555.755.2]According to Eq. (21) from Appendix A, the direct accelerance at TP1 of SH1 ℎ ,, may be 372
synthesised as 373
ℎ ,, (𝑠) = (15)
374
where 𝑎 = 2.4765 × 10 , 𝑎 = −1.2855 × 10 s-1, 𝑎 = −1.6099 × 10 s-2, 𝑏 =
375
1.8176 N∙s2∙m-1, 𝑏 = 0.1983 N∙s∙m-1 and 𝑏 = 413.9403 N∙m-1. 376
Similarly, the accelerances ℎ ,, , ℎ ,, , ℎ ,, and ℎ ,, were synthesised. The corrected 377
acelerances ℎ ,, , ℎ ,, and ℎ ,, are shown in Fig. 15, in which the peak shift was induced by 378
the presence of the human occupant at different locations only. 379
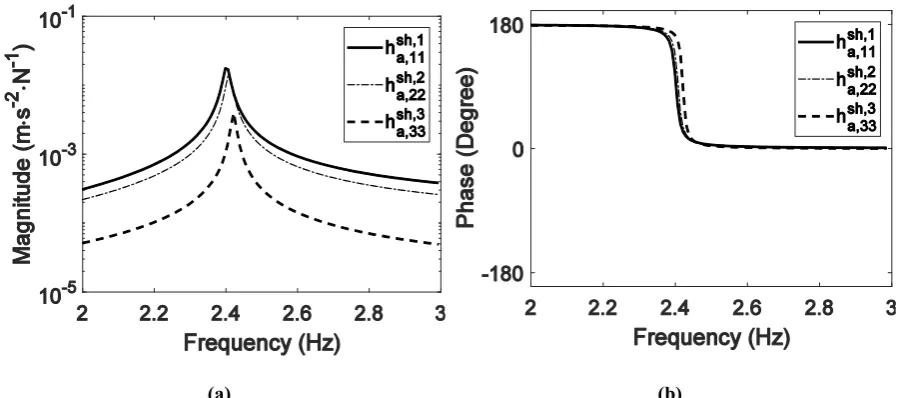
[image:19.595.75.526.348.547.2](a) (b)
Fig. 15 Comparison of corrected 𝒉𝒂,𝟏𝟏𝒔𝒉,𝟏, 𝒉𝒂,𝟐𝟐𝒔𝒉,𝟐 and𝒉𝒂,𝟑𝟑𝒔𝒉,𝟑: (a) Magnitude; (b) Phase
380
4.1.3.The identification of the dynamics of the human body and the empty structure
381
A pair of eigenvalues of the human-bridge system SH1 may be obtained as 𝜇 ,, = −0.0545 ±
382
15.0910𝑖 s-1 by solving the characteristic equation of ℎ
,, . Using 𝜇 , , or the points around
383
the minimum point in Fig. 16 as the initial guesses for the zeros of 𝛥ℎ (𝑠) = ℎ ,, (𝑠) −
384
ℎ ,, (𝑠), a pair of eigenvalues may be obtained as 𝜇 , = −0.0351 ± 15.2338i s-1, which were 385
also found to be zeros of 𝛥ℎ (𝑠) and 𝛥ℎ (𝑠). This confirms that 𝜇 , were the eigenvalues 386
2.42 Hz and 0.23%, which agree well with the measured counterparts from impact hammer 388
testing in which the hammer operator stood next to the bridge. 389
[image:20.595.182.407.132.309.2]390
Fig. 16 The magnitude of 𝜟𝒉𝟏𝟑(𝒔) against frequency and damping ratio
391
Based on the analytical expression of ℎ ,, given by Eq.(15), the identified eigenvalues of the 392
empty bridge and the human mass (𝑚 = 100 kg), the damping and stiffness of the human
393
body were calculated as 394
𝑐
𝑘 =
𝜇 1
𝜇 1
( )
, , ( )
( )
, , ( )
= 1.75 × 10 𝑁 ⋅ 𝑠 ⋅ 𝑚
7.21 × 10 𝑁 ⋅ 𝑚 (16)
395
from which the corresponding frequency and damping ratio were calculated to be 𝑓 = 4.27
396
Hz and 𝜁 = 33%, respectively. These results are in the ranges of natural frequency and 397
damping ratio for a human body in a standing posture availabe in the literature [20]. 398
Based on the corrected accelerances ℎ ,, , ℎ ,, , ℎ ,, , ℎ ,, and ℎ ,, , the identified human 399
body dynamics and Eqs. (1) and (2), the direct accelerances ℎ , , ℎ , and ℎ , and the cross 400
accelerances ℎ , and ℎ , of the empty bridge can be synthesised, which are shown in Fig.
401
17 and Fig. 18. As can be seen from Fig. 17, the three direct accelerances of the empty bridge 402
exhibit the same frequency. Fig. 18 implies that the principle of structural reciprocity is 403
satisfied. In addition, the accelerances obtained by eliminating the effect of the shaker from the 404
the bridge with the human occupant and shaker. These suggest that the effects of the human 407
occupant and shaker have been eliminated correctly. 408
[image:21.595.46.528.128.540.2](a) (b)
Fig. 17 Synthesised direct accelerances 𝒉𝒂, 𝟏𝟏𝒔 , 𝒉𝒂, 𝟐𝟐𝒔 and 𝒉𝒂, 𝟑𝟑𝒔 of the empty bridge: (a) Magnitude; (b)
409
Phase
410
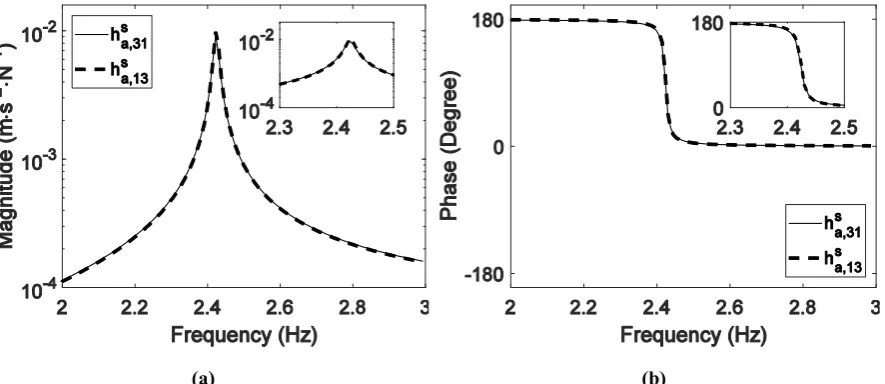
(a) (b)
Fig. 18 Synthesised cross accelerances 𝒉𝒂,𝟏𝟑𝒔 and 𝒉𝒂,𝟑𝟏𝒔 of the empty bridge: (a) Magnitude; (b) Phase
411
4.2.The elimination of the effect of hammer operator in manually operated impact
412
hammer testing
413
The same steel-concrete composite bridge used in Section 4.1 was considered again, but with 414
3.41 m overhang at each end, i.e. a span length of 13.08 m. The accelerances of the empty 415
bridge and the hammer operator-bridge system were measured using manually operated impact 416
4.2.1.Manually operated impact hammer testing
418
To obtain the accelerances of the empty bridge, the hammer operator stood next to the bridge 419
to impact sequentially at TPs 1, 2 and 3 on the deck using an instrumented sledge hammer 420
(Dytran Model 5803A, sensitivity 0.231 mV/N). Three accelerometers (Honeywell QA750, 421
nominal sensitivity 1300 mV/g) were placed at TPs 1, 2 and 3 to measure the vibration 422
responses of the empty bridge in the vertical direction. The data acquisition system consisted 423
of a laptop, a 16-channel data logger (SignalCalc Mobilyser by Data Physics) and a signal 424
conditioner. The sampling frequency was chosen to be 1024 Hz and the data acquisition 425
window was set to 64 seconds. Four averages were used to minimise the effects of noise. No 426
window was used since the vibration responses returned to the ambient vibration level at the 427
end of the acquisition window. The accelerance measurement of the hammer operator-bridge 428
system was performed in the same way. The only difference was that the hammer operator 429
crouched on the deck (sequentially close to at TPs 1, 2 and 3) to perform the impact hammer 430
testing. The typical crouching posture of the hammer operator is shown in Fig. 20. The hammer 431
operator and the hammer weigh 62 kg and 5.5 kg, respectively. The bridge systems with the 432
hammer operator crouching at TPs 1, 2 and 3 are designated as the systems SH1, SH2 and SH3, 433
respectively. 434
[image:22.595.125.471.443.544.2]435
Fig. 19 Bridge deck geometry and test points
[image:22.595.186.412.573.750.2]The measured cross accelerances ℎ , and ℎ , of the empty bridge are compared in Fig. 21. 439
It can be seen that the reciprocity holds for the empty bridge, which indicates that the dynamic 440
behaviour of the bridge was linear in the response range of the tests. The bridge with the 441
hammer operator crouching at TPs 1, 2 or 3 was also found to behave linearly by using shaker 442
testing. The response range of the shaker tests covers the range of the responses, bandpass 443
filtered with cutoff frequencies 2 Hz and 6 Hz, of the impact hammer tests. Therefore, it is 444
reasonable to assume that the dynamics of the hammer operator is linear during the testing. Fig. 445
22 shows that the cross accelerance ℎ ,, of the system SH1 did not agree with the cross 446
accelerance ℎ ,, of the system SH3. This is due to the change in location of the hammer 447
operator. 448
[image:23.595.46.528.304.707.2](a) (b)
Fig. 21 Measured cross accelerances 𝒉𝒂,𝟏𝟑𝒔 and 𝒉𝒂,𝟑𝟏𝒔 of the empty bridge: (a) Magnitude; (b) Phase
449
(a) (b)
Fig. 22 Measured cross accelerances 𝒉𝒂,𝟑𝟏𝒔𝒉,𝟏 and 𝒉𝒂,𝟏𝟑𝒔𝒉,𝟑: (a) Magnitude; (b) Phase
4.2.2.The elimination of the effect of the time delay of the measurement system
451
Fig. 21(b) and Fig. 22(b) show that there was a phase shift at low frequencies (below 8 Hz) in 452
the measured accelerances of the empty bridge and the hammer operator-bridge systems, 453
indicating a time delay in the acceleration measurement compared to the impulse force 454
measurement. By contrast, there was no time delay observed in the accelerance measurement 455
in the shaker testing presented in Section 4.1.1. It is noted that three QA750 accelerometers 456
were used for the response measurement in both the impact hammer testing and the shaker 457
testing. While a load cell (an integral piezoelectric force sensor of low impedance voltage mode 458
type) at the tip of an hammer Dytran Model 5803A was used for impulse force measurement, 459
a QA750 accelerometer was used in the shaker testing to measure the excitation force. The 460
time delay in the low frequency range in measured accelerances from the impact hammer 461
testing was mainly due to the difference between the time constant of the load cell for force 462
measurement and that of the accelerometer for response measurement [36]. In the shaker 463
testing, these two time constants are equal, and therefore they do not affect measured 464
accelerances [36]. Appendix B demonstrates that this time delay affects the estimation of actual 465
accelerances of the system under test but not eigenvalues. The effect of the time delay must be 466
corrected for accurate subsystem identification since the proposed theory for the dynamic 467
identification of the human body (i.e. Eq.(9)) and the empty structure (i.e. Eqs. (1) and (2)) 468
requires the estimation of actual accelerances of the human-structure system. 469
Eq. (26) in Appendix B shows that measured accelerances should be multiplied by 𝑒 , where
470
𝜏 (s) is the time delay of the measurement system. For the data acquisition system used in the 471
impact hammer testing, an averaged time delay around the first mode may be approximately 472
estimated as 473
𝜏 = (17)
474
where 𝜃 (degree) is the averaged delayed phase angle and 𝑓 (Hz) is the natural frequency of 475
the first mode. For example, the averaged delayed phase angle for the measured accelerance 476
ℎ , of the empty bridge was 19 degrees. The natural frequency was estimated to be 3.22 Hz.
477
The time delay was calculated as 0.0164 s using Eq. (17). The comparison of the measured 478
accelerance ℎ , (thin solid line) and its phase corrected counterpart (thick dashed line) is 479
is almost 180 degrees before the phase drop at the fundamental frequency, while there are no 481
changes of the eigenvalues and magnitude of the FRF. In addition, it is reasonable to assume 482
that all the measured accelerances had the same time delay since the same measurement system 483
was used throughout the impact hammer testing. 484
[image:25.595.71.527.170.381.2](a) (b)
Fig. 23 Comparison of the measured accelerance 𝒉𝒂,𝟏𝟏𝒔 and its phase corrected counterpart: (a)
485
Magnitude; (b) Phase
486
4.2.3.The identification of the dynamics of the hammer operator and the empty bridge
487
After phase correction, the measured direct accelerance ℎ ,, was curve fitted around the first 488
mode using the rational fraction polynomial method [35]. The estimated eigenvalues were 489
𝜇 ,, = −0.1930 ± 20.0834i s-1 (the corresponding natural frequency and damping ratio were 490
3.20 Hz and 0.96%), and the corresponding analytical expression was 491
ℎ ,, (𝑠) = (18)
492
where 𝑎 = 1.4493 × 10 , 𝑎 = −3.1393 × 10 s-1, 𝑎 = −0.0101 s-2, 𝑏 = 1.1569
493
N∙s2∙m-1, 𝑏 = 0.4466 N∙s∙m-1 and 𝑏 = 466.6605 N∙m-1. 494
Similarly, the phase corrected ℎ ,, was curved fitted and the eigenvalues were identified to be 495
𝜇 ,, = −0.1030 ± 20.2371i s-1 (natural frequency and damping ratio were 3.22 Hz and 496
0.51%). Its analytical expression was 497
ℎ ,, (𝑠) = (19)
Where 𝑎 = 2.9953 × 10 , 𝑎 = −1.1264 × 10 s-1, 𝑎 = −0.0581 s-2, 𝑏 = 8.0321 499
N∙s2∙m-1, 𝑏 = 1.6684 N∙s∙m-1 and 𝑏 = 3289.7 N∙m-1. 500
With 𝜇 , , or the points around the minimum point shown in Fig. 24 as the initial guesses,
501
𝜇 , = −0.0868 ± 20.2622i s-1 were found to be the common zeros of 𝛥ℎ (𝑠), 𝛥ℎ (𝑠) and 502
𝛥ℎ (𝑠), which confirms that 𝜇 , were the eigenvalues of the empty bridge. The 503
corresponding natural frequency and damping ratio of the empty bridge were found to be 3.22 504
Hz and 0.43%, which agree with those identified from accelerances directly measured on the 505
empty bridge. 506
[image:26.595.181.410.283.451.2]507
Fig. 24 The magnitude of 𝜟𝒉𝟏𝟑(𝒔) against frequency and damping ratio
508
By using the eigenvalues 𝜇 , , 𝑚 = 62 + 5.5 = 67.5 kg, Eq. (11) and Eq.(18), the human 509
body dynamics were identified as 510
𝑐
𝑘 =
𝜇 1
𝜇 1
( )
, , ( )
( )
, , ( )
= 8.86 × 10 𝑁 ⋅ 𝑠 ⋅ 𝑚
3.71 × 10 𝑁 ⋅ 𝑚 (20)
511
from which the natural frequency and damping ratio of the human occupant operating a 512
hammer in a crouching posture were calculated to be 3.73 Hz and 28%. 513
With the identified human body dynamics and the analytical expression of the phase corrected 514
well with the measured counterpart of the empty bridge with phase corrected (thin solid line). 517
The comparison of the identified frequencies and damping ratios of the hammer operator-518
bridge systems and the empty bridge indicates that the presence of the hammer operator causes 519
the decrease of the natural frequency of the empty bridge and the increase of the damping ratio. 520
This also explains the difference between the phase corrected accelerance of the hammer-521
operator system (thin dash-dotted line) and that of the empty bridge shown in Fig. 25. Similarly, 522
other accelerances of the empty bridge can be synthesised by eliminating the effect of the 523
hammer operator. 524
[image:27.595.74.525.253.450.2](a) (b)
Fig. 25 Comparison of the synthesised accelerance of the empty bridge and the phase corrected
525
accelerances measured on the empty bridge and the human-bridge system: (a) Magnitude; (b) Phase
526
5. Conclusions
527
A novel method for subsystem identification in a human-structure system has been proposed. 528
It enables the identification of the dynamic properties of the human body and the empty 529
structure from measured FRFs of the human-structure system. The proposed theory is verified 530
by a numerical example and two experimental case studies. The method is especially relevant 531
to the elimination of the effect of the hammer operator in manually operated impact hammer 532
testing on lightweight civil engineering structures. In addition, the method can be generalised 533
to compensate for the effects of the shaker in shaker testing. Furthermore, the time delay 534
between the force and response signals on the measured FRFs of the structure under test are 535
discussed, and appropriate strategies for their correction are proposed. The proposed method, 536
which focuses on the presence of a single human occupant on lightweight low-frequency 537
structures (up to 8 Hz) in this paper, will be extended to the crowd-structure interaction in the 538
540
Appendix A: The elimination of the effect of shaker on measured FRFs of the empty
541
structure
542
The method for the elimination of the effect of a human occupant on the dynamic identification 543
of the empty structure presented in the paper [18] can be extended to the elimination of the 544
effect of shaker on measured FRFs. Under the assumption that a shaker is a mass block of the 545
total mass 𝑚 , the resultant formulas are the same as those used for the elimination of 546
transducer mass loading effects in some studies [37, 38]. Hence, the derivation of the formulas 547
is not presented here, instead they are shown in the final form. 548
Namely, the direct receptance at the 𝑝-th DOF (𝑝 ≤ 𝑛) of the empty structure ℎ (𝑠) and that 549
of the structure with the shaker at the 𝑝-th DOF ℎ , (𝑠) are related by 550
ℎ (𝑠) =
, ( )
, ( ) (21)
551
Similarly, the cross receptance between the 𝑞-th DOF (𝑝 ≤ 𝑛) and the 𝑝-th DOF of the empty 552
structure ℎ (𝑠) and that of the structure with the shaker at the 𝑝-th DOF ℎ , (𝑠) are related 553
by 554
ℎ (𝑠) =
,
( )
,
( ) (22)
555
Appendix B: The effect of the time delay of the measurement system on measured FRFs
556
The equation of forced vibration of a linear structure having 𝑛 DOFs may be written in the
557
Laplace domain as 558
𝒙 (𝑠) = 𝑯 (𝑠)𝒇 (𝑠) (23)
559
where 𝑯 (𝑠) is the receptance matrix, 𝑠 is the Laplace variable, whilst 𝒙 (𝑠) and 𝒇 (𝑠) are the 560
In the modal testing of the above system, if the measurement system is an ideal system but 562
there is a time delay, 𝜏, between the response and force signal measurement, then the 563
measurement system FRF can be expressed as 𝑒 . The equation of forced vibration of the
564
structure combined with the measurement system then becomes 565
𝒙 (𝑠) = 𝑯 (𝑠)𝑒 𝒇 (𝑠) (24)
566
where 𝒙 (𝑠) is the Laplace transform of the measured output of the structure combined with
567
the measurement system. 568
The measured receptance then becomes 569
𝑯 (𝑠) =𝒙 ( )
𝒇 ( )= 𝑯 (𝑠)𝑒 (25)
570
which shows that the actual receptance of the structure may be obtained by correcting the 571
measured receptance by 572
𝑯 (𝑠) = 𝑯 (𝑠)𝑒 (26)
573
ACKNOWLEDGMENT 574
This research was supported by the UK Engineering and Physical Sciences Research Council 575
[grant number EP/M021505/1: Characterising dynamic performance of fibre reinforced 576
polymer structures for resilience and sustainability]. 577
DATA AVAILABILITY 578
Electronic format of the data collected in this research can be downloaded freely from the 579
University of Warwick webpages http://wrap.warwick.ac.uk/108822.
580
581
References 582
[1] B.R. Ellis, T. Ji, Human-structure interaction in vertical vibrations, Proceedings of the 584
Institution of Civil Engineers - Structures and Buildings, 122 (1997) 1-9. 585
[2] R. Sachse, A. Pavic, P. Reynolds, Parametric study of modal properties of damped two-586
degree-of-freedom crowd–structure dynamic systems, Journal of Sound and Vibration, 274 587
(2004) 461-480. 588
[3] J.M.W. Brownjohn, Energy dissipation from vibrating floor slabs due to human-structure 589
interaction, Shock and Vibration, 8 (2001). 590
[4] S. Živanović, I. Diaz, A. Pavić, Influence of walking and standing crowds on structural 591
dynamic properties, in: Proceeding of Conference & Exposition on Structural Dynamics 592
(IMAC XXVII), 2009. 593
[5] J. Sim, Human-structure interaction in cantilever grandstands, PhD Thesis, The University 594
of Oxford 2006. 595
[6] R. Sachse, A. Pavic, P. Reynolds, Human-structure dynamic interaction in civil engineering 596
dynamics: A literature review, Shock and Vibration Digest, 35 (2003) 3-18. 597
[7] S. Živanović, A. Pavic, P. Reynolds, Vibration serviceability of footbridges under human-598
induced excitation: a literature review, Journal of Sound and Vibration, 279 (2005) 1-74. 599
[8] S. Živanović, G. Feltrin, J.T. Mottram, J.M.W. Brownjohn, Vibration performance of 600
bridges made of fibre reinforced polymer, in: F.N. Catbas (Ed.) Dynamics of Civil Structures, 601
Volume 4: Proceedings of the 32nd IMAC, A Conference and Exposition on Structural 602
Dynamics, 2014, Springer International Publishing, Cham, 2014, pp. 155-162. 603
[9] E. Shahabpoor, A. Pavic, V. Racic, Interaction between walking humans and structures in 604
vertical direction: a lterature review, Shock and Vibration, 2016 (2016) 22. 605
[10] R.O. Foschi, G.A. Neumann, F. Yao, B. Folz, Floor vibration due to occupants and 606
reliability-based design guidelines, Canadian Journal of Civil Engineering, 22 (1995) 471-479. 607
[11] Y. Matsumoto, M.J. Griffin, Dynamic response of the standing human body exposed to 608
vertical vibration: Influence of posture and vibration magnitude, Journal of Sound and 609
Vibration, 212 (1998) 85-107. 610
[12] L. Wei, M.J. Griffin, Mathematical models for the apparent mass of the seated human 611
body exposed to vertical vibration, Journal of Sound and Vibration, 212 (1998) 855-874. 612
[13] X. Zheng, J.M.W. Brownjohn, Modeling and simulation of human-floor system under 613
vertical vibration, in: L.P. Davis (Ed.) Proc. SPIE 4327, Smart Structures and Materials 2001: 614
Smart Structures and Integrated Systems, Newport Beach, CA, USA, 2001, pp. 513-520. 615
[14] R. Sachse, The influences of human occupants on the dynamic properties of slender 616
structures, PhD Thesis, University of Sheffield, 2003. 617
[15] K. Van Nimmen, K. Maes, S. Zivanovic, G. Lombaert, G. De Roeck, P. Van den Broeck, 618
Identification and modelling of vertical human-structure interaction, in: J. Caicedo, S. Pakzad 619
(Eds.) Dynamics of Civil Structures, Volume 2: Proceedings of the 33rd IMAC, A Conference 620
and Exposition on Structural Dynamics, 2015, Springer International Publishing, Cham, 2015, 621
pp. 319-330. 622
[16] E. Shahabpoor, A. Pavic, V. Racic, Identification of mass–spring–damper model of 623
walking humans, Structures, 5 (2016) 233-246. 624
[18] X. Wei, S. Živanović, Frequency response function-based explicit framework for dynamic 627
identification in human-structure systems, Journal of Sound and Vibration, 422 (2018) 453-628
470. 629
[19] J. Sim, A. Blakeborough, M. Williams, Modelling effects of passive crowds on grandstand 630
vibration, Proceedings of the Institution of Civil Engineers - Structures and Buildings, 159 631
(2006) 261-272. 632
[20] C.A. Jones, P. Reynolds, A. Pavic, Vibration serviceability of stadia structures subjected 633
to dynamic crowd loads: A literature review, Journal of Sound and Vibration, 330 (2011) 1531-634
1566. 635
[21] C.C. Caprani, E. Ahmadi, Formulation of human–structure interaction system models for 636
vertical vibration, Journal of Sound and Vibration, 377 (2016) 346-367. 637
[22] J.W. Qin, S.S. Law, Q.S. Yang, N. Yang, Finite element analysis of pedestrian-bridge 638
dynamic interaction, Journal of Applied Mechanics, 81 (2013) 041001-041001-041015. 639
[23] A. Pavic, R. Pimentel, P. Waldron, Instrumented sledge hammer impact excitation: 640
worked examples, in: Proceedings-Spie the International Socienty for Optical Engineering, 641
Spie The International Socienty for Optica, 1998, pp. 929-935. 642
[24] D. Tirelli, Modal analysis of small & medium structures by fast impact hammer testing 643
method, in, 2011. 644
[25] S. Živanović, X. Wei, J. Russell, J.T. Mottram, Vibration performance of two FRP 645
footbridge structures in the United Kingdom, in: Footbridge 2017, Berlin, Germany, 2017. 646
[26] M.G.R. Toward, M.J. Griffin, Apparent mass of the human body in the vertical direction: 647
Inter-subject variability, Journal of Sound and Vibration, 330 (2011) 827-841. 648
[27] Y. Matsumoto, M.J. Griffin, Mathematical models for the apparent masses of standing 649
subjects exposed to vertical whole-body vibration, Journal of Sound and Vibration, 260 (2003) 650
431-451. 651
[28] IStructE/DTLR/DCMS, Dynamic performance requirements for permanent grandstands 652
subject to crowd action, recommendations for management, design and assessment, The 653
Institution of Structural Engineers (IStructE), London, 2008. 654
[29] A. Pavic, P. Reynolds, Experimental verification of novel 3DOF model for grandstand 655
crowdstructure dynamic interaction, in: 26th international modal analysis conference: IMAC-656
XXVI, Orlando, Florida, 2008. 657
[30] C.A. Jones, A. Pavic, P. Reynolds, R.E. Harrison, Verification of equivalent mass–spring– 658
damper models for crowd–structure vibration response prediction, Canadian Journal of Civil 659
Engineering, 38 (2011) 1122-1135. 660
[31] K.A. Salyards, N.C. Noss, Experimental evaluation of the influence of human-structure 661
interaction for vibration serviceability, Journal of Performance of Constructed Facilities, 28 662
(2014) 458-465. 663
[32] T. Coleman, Y. Li, An interior trust region approach for nonlinear minimization subject 664
to bounds, SIAM Journal on Optimization, 6 (1996) 418-445. 665
[33] ISO, ISO 5982:1981 Vibration and shock -- Mechanical driving point impedance of the 666
human body, International Organisation for Standarisation (ISO), Geneva, Switzerland, 1981. 667
[34] Z. Friedman, J.B. Kosmatka, An improved two-node Timoshenko beam finite element, 668
[35] M.H. Richardson, D.L. Formenti, Parameter estimation from frequency response 670
measurements using rational fraction polynomials, in: the 1st Internation Modal Analysis 671
Conference, Orlando, FL, 1982. 672
[36] K.G. McConnell, P.S. Varoto, Vibration testing: theory and practice, Wiley, New Jersey, 673
2008. 674
[37] J.M.M. Silva, N.M.M. Maia, A.M.R. Ribeiro, Cancellation of mass-loading effects of 675
transducers and evaluation of unmeasured frequency response functions, Journal of Sound and 676
Vibration, 236 (2000) 761-779. 677
[38] O. Cakar, K.Y. Sanliturk, Elimination of transducer mass loading effects from frequency 678
response functions, Mechanical Systems and Signal Processing, 19 (2005) 87-104. 679