Lancet Neurol 2019
Published Online March 14, 2019 http://dx.doi.org/10.1016/ S1474-4422(18)30499-X SeeOnline/Comment http://dx.doi.org/10.1016/ S1474-4422(19)30029-8 *Collaborators listed at the end of the Article
Correspondence to: Prof Valery L Feigin, National Institute for Stroke and Applied Neurosciences, School of Public Health and Psychosocial Studies, Faculty of Health and Environmental Sciences, Auckland University of Technology, Northcote, Auckland 0627, New Zealand
valery.feigin@aut.ac.nz
or
Prof Theo Vos, Institute for Health Metrics and Evaluation, University of Washington, Seattle, WA, USA
tvos@uw.edu
Introduction
The UN General Assembly report of December, 2017,
underscored that progress in reducing the burden of
non-communicable diseases, including neurologi cal
disord-ers, has been insufficient to meet the UN Sustainable
Development Goal targets by 2030.
1Neurological disorders
are the leading cause of disability and the second
lead-ing cause of death worldwide.
2Thus, strategies and
pro grammes that reduce the burden from neurological
disorders would potentially help to achieve the UN
Sustainable Development Goal targets.
Although age-standardised incidence, mortality, and
prevalence rates of many neurological disorders
de-clined for many countries from 1990 to 2015, the absolute
number of people affected by, dying, or remaining
dis-abled from neurological disorders over the past 25 years
Global, regional, and national burden of neurological
disorders, 1990–2016: a systematic analysis for the Global
Burden of Disease Study 2016
GBD 2016 Neurology Collaborators*
Summary
Background
Neurological disorders are increasingly recognised as major causes of death and disability worldwide.
The aim of this analysis from the Global Burden of Diseases, Injuries, and Risk Factors Study (GBD) 2016 is to
provide the most comprehensive and up-to-date estimates of the global, regional, and national burden from
neurological disorders.
Methods
We estimated prevalence, incidence, deaths, and disability-adjusted life-years (DALYs; the sum of years of
life lost [YLLs] and years lived with disability [YLDs]) by age and sex for 15 neurological disorder categories (tetanus,
meningitis, encephalitis, stroke, brain and other CNS cancers, traumatic brain injury, spinal cord injury, Alzheimer’s
disease and other dementias, Parkinson’s disease, multiple sclerosis, motor neuron diseases, idiopathic epilepsy,
migraine, tension-type headache, and a residual category for other less common neurological disorders) in
195 countries from 1990 to 2016. DisMod-MR 2.1, a Bayesian meta-regression tool, was the main method of estimation
of prevalence and incidence, and the Cause of Death Ensemble model (CODEm) was used for mortality estimation.
We quantified the contribution of 84 risks and combinations of risk to the disease estimates for the 15 neurological
disorder categories using the GBD comparative risk assessment approach.
Findings
Globally, in 2016, neurological disorders were the leading cause of DALYs (276 million [95% UI 247–308])
and second leading cause of deaths (9·0 million [8·8–9·4]). The absolute number of deaths and DALYs from all
neurological disorders combined increased (deaths by 39% [34–44] and DALYs by 15% [9–21]) whereas their
age-standardised rates decreased (deaths by 28% [26–30] and DALYs by 27% [24–31]) between 1990 and 2016. The only
neurological disorders that had a decrease in rates and absolute numbers of deaths and DALYs were tetanus,
meningitis, and encephalitis. The four largest contributors of neurological DALYs were stroke (42·2% [38·6–46·1]),
migraine (16·3% [11·7–20·8]), Alzheimer’s and other dementias (10·4% [9·0–12·1]), and meningitis (7·9% [6·6–10·4]).
For the combined neurological disorders, age-standardised DALY rates were significantly higher in males than in
females (male-to-female ratio 1·12 [1·05–1·20]), but migraine, multiple sclerosis, and tension-type headache were
more common and caused more burden in females, with male-to-female ratios of less than 0·7. The 84 risks
quantified in GBD explain less than 10% of neurological disorder DALY burdens, except stroke, for which
88·8% (86·5–90·9) of DALYs are attributable to risk factors, and to a lesser extent Alzheimer’s disease and other
dementias (22·3% [11·8–35·1] of DALYs are risk attributable) and idiopathic epilepsy (14·1% [10·8–17·5] of DALYs
are risk attributable).
Interpretation
Globally, the burden of neurological disorders, as measured by the absolute number of DALYs,
continues to increase. As populations are growing and ageing, and the prevalence of major disabling neurological
disorders steeply increases with age, governments will face increasing demand for treatment, rehabilitation, and
support services for neurological disorders. The scarcity of established modifiable risks for most of the neurological
burden demonstrates that new knowledge is required to develop effective prevention and treatment strategies.
Funding
Bill & Melinda Gates Foundation.
has been increasing globally.
2Regular assessments of
incidence, prevalence, mortality, and disability associated
with neurological disorders by cause and over time
are important for evidence-based health-care planning,
priority setting, and resource allocation. On a global
scale, this type of information has facilitated
between-country and between-region comparisons of the burden
from neurological disorders and their trends. The
infor-mation can also be used for hypothesis generation
on causal relationships and effects of sociodemographic
and health care factors on the burden from neurological
disorders.
In 2017, we published aggregated estimates of the
burden from neurological disorders
2(as measured by
prevalence, mortality, disability-adjusted life-years [DALYs],
and years lived with disability [YLDs]), based on the Global
Burden of Diseases, Injuries, and Risk Factors Study
(GBD) 2015 data. However, neurological disorders analysed
did not include traumatic brain injury (TBI) or spinal
cord injury, which are significant sources of global
dis ability. Additionally, newly available publications and
other data sources were added to the GBD 2016 estimates.
In the 2018–19 series of publications in
The Lancet Neurology,
3–12we pre sented global, regional,
and national estimates of the burden of individual
neuro-logical dis orders as meas ured by prevalence, mortality,
DALYs, YLDs, years of life lost (YLLs), and, for selected
disorders, also incidence, and their trends from 1990 to
2016 accord ing to Socio-demographic Index (SDI), a
summary indi
cator of income per capita, years of
schooling, and total fertility rate. Here, we present
updated aggregated estimates (compared with aggregated
estimates presented in the GBD 2015 study) of
neuro-logical disorders and their trends from 1990 to 2016 by
SDI, age, and sex.
Methods
Overview
The Institute for Health Metrics and Evaluation produces
annual updates of the GBD study and includes a growing
collaboration of scientists. Reported estimates span the
period from 1990 to 2016. Annual updates allow
incor-poration of new data and methodological improvements to
ensure that the most up-to-date information is avail able to
policy makers to help make resource allocation decisions.
In this analysis, we have aggregated results from GBD 2016
for 15 disease and injury outcomes that are generally
cared for by neurological services. These include infectious
conditions (tetanus, meningitis, and encephalitis), stroke,
brain and other CNS cancers, TBI, spinal cord injury,
Alzheimer’s disease and other dementias, Parkinson’s
disease, multiple sclerosis, motor neuron diseases,
idio-pathic epilepsy, migraine, tension-type head ache, and a
residual category of other less common neurological
disorders. Compared to a previous analy sis based on
GBD 2015,
2we added non-fatal outcomes of TBI and
spinal cord injury. Medication overuse headache is no
longer included as a separate cause but quantified as a
Research in context
Evidence before this study
Findings from the Global Burden of Diseases, Injuries, and Risk
Factors Study (GBD) 2015, showed that neurological disorders
are the world’s largest cause of disability. However, some
disabling neurological disorders, specifically traumatic brain
injury and spinal cord injury, were not included, thus
underestimating the global burden of this group of disabilities.
No other relevant efforts, beyond GBD, have been made to
quantify the global burden of neurological disorders as a whole.
The data sources identified after the GBD 2015 study are
detailed in the other GBD papers in the series of the
neurological disorders overvieved in this paper.
Added value of this study
This study improves upon GBD 2015 by including four significant
considerations. First, compared with a previous analysis based on
GBD 2015, we were able to add the non-fatal outcomes of
traumatic brain injury and spinal cord injury. Thus, in this analysis,
we have aggregated results from GBD 2016 for 15 disease and
injury outcomes that are generally cared for by neurological
services, such as CNS infectious conditions (tetanus, meningitis,
and encephalitis), stroke, brain and other CNS cancers, traumatic
brain injury and spinal cord injury, Alzheimer’s disease and other
dementias, Parkinson’s disease, multiple sclerosis, motor neuron
diseases, idiopathic epilepsy, migraine, tension-type headache,
and a residual category of other less common neurological
disorders. Second, we incorporated new data from sources
identified after GBD 2015, including peer-reviewed publications,
reports from statistical agencies or ministries of health, surveys,
and administrative and hospital data. Third, in the individual
papers of the burden of neurological disorders analysed,
we extended our analysis of GBD results by Socio-demographic
Index (SDI), a summary indicator of income per capita, years of
schooling, and total fertility rate, with new ways of presenting
and visualising changes over time and the relationship with SDI.
Fourth, we extended the terminal age group used in our analysis
from 80 years and older to 80–84 years, 85–89 year, 90–94 year,
and 95 years and older.
Implications of all the available evidence
Absolute numbers (thousands)
Age-standardised rate (per 100
000 people)
2016
Percentage change, 1990–2016
2016
Percentage change, 1990–2016
Males Females Male-to-female ratio All neurological disorders Deaths 9039 (8772 to 9364) 39% (34 to 44) 144 (140 to 149) –28% (–30 to –26) 160 (155 to 166) 129 (124 to 135) 1·24 (1·20 to 1·29) DA LY s 276 143 (246 544 to 307 994) 15% (9 to 21) 3968 (3557 to 4396) –27% (–31 to –24) 4204 (3855 to 4575) 3755 (3272 to 4279) 1·12 (1·05 to 1·20) Tetanus Deaths 37 (22 to 47) –89% (–91 to –86) 1 (0 to 1) –91% (–93 to –88) 1 (0 to 1) 0 (0 to 1) 1·55 (0·85 to 2·15) DA LY s 2367 (1446 to 3063) –90% (–93 to –88) 34 (20 to 43) –91% (–93 to –89) 41 (21 to 56) 26 (16 to 35) 1·59 (0·93 to 2·25) Incidence 90 (51 to 121) –89% (–92 to –86) 1 (1 to 2) –91% (–93 to –88) 2 (1 to 2) 1 (1 to 1) 1·72 (0·98 to 2·37) Meningitis Deaths 318 (265 to 409) –21% (–36 to 9) 5 (4 to 6) –36% (–47 to –12) 5 (4 to 7) 4 (3 to 6) 1·25 (0·86 to 1·86) DA LY s 21 866 (18 205 to 28 281) –28% (–42 to 3) 306 (254 to 398) –36% (–48 to –10) 328 (261 to 428) 284 (224 to 423) 1·18 (0·79 to 1·66) Incidence 2821 (2464 to 3310) 13% (10 to 16) 39 (35 to 46) –4% (–7 to –1) 42 (36 to 49) 37 (32 to 44) 1·12 (1·10 to 1·14) Encephalitis Deaths 103 (84 to 138) –2% (–36 to 70) 1 (1 to 2) –27% (–51 to 21) 2 (1 to 2) 1 (1 to 2) 1·19 (0·81 to 1·57) DA LY s 6704 (5469 to 857 4) –15% (–44 to 41) 93 (76 to 118) –32% (–54 to 10) 92 (75 to 124) 93 (7 4 to 124) 0·99 (0·73 to 1·26) Incidence 6534 (5957 to 7165) 29% (26 to 33) 90 (82 to 98) –5% (–6 to –4) 82 (75 to 90) 99 (90 to 109) 0·83 (0·80 to 0·85) Strok e Deaths 5528 (5335 to 5735) 28% (22 to 33) 87 (83 to 90) –36% (–39 to –34) 103 (99 to 107) 72 (69 to 77) 1·42 (1·35 to 1·50) DA LY s 116 445 (111 385 to 121 407) 22% (17 to 27) 1711 (1635 to 1784) –34% (–37 to –32) 2046 (1961 to 2126) 1408 (1320 to 1489) 1·45 (1·39 to 1·52) Incidence 13 677 (12 713 to 14 692) 78% (73 to 83) 203 (189 to 218) –8% (–11 to –6) 231 (215 to 248) 179 (166 to 192) 1·29 (1·27 to 1·31) Alzheimer ’s disease
and other dementias
Deaths 2382 (2060 to 2778) 148% (140 to 157) 41 (35 to 48) 4% (1 to 6) 37 (32 to 44) 43 (37 to 49) 0·88 (0·86 to 0·91) DA LY s 28 764 (24 511 to 33 952) 121% (115 to 127) 471 (401 to 556) 2% (0 to 4) 439 (373 to 523) 490 (417 to 576) 0·90 (0·88 to 0·92) Prevalence 43 836 (37 756 to 51 028) 117% (114 to 121) 712 (614 to 828) 2% (1 to 2) 645 (555 to 752) 757 (652 to 879) 0·85 (0·85 to 0·86) Parkinson’ s disease Deaths 211 (168 to 265) 161% (152 to 171) 3 (3 to 4) 19% (16 to 23) 5 (4 to 6) 3 (2 to 3) 1·81 (1·7 4 to 1·89) DA LY s 3235 (2564 to 4013) 148% (140 to 156) 51 (41 to 63) 22% (18 to 26) 67 (53 to 83) 39 (31 to 49) 1·70 (1·63 to 1·76) Prevalence 6063 (4971 to 7325) 145% (138 to 152) 94 (77 to 114) 22% (18 to 25) 112 (92 to 135) 80 (65 to 97) 1·40 (1·36 to 1·43)
Idiopathic epilepsy Deaths
126 (119 to 136) 9% (–3 to 30) 2 (2 to 2) –24% (–32 to –11) 2 (2 to 2) 1 (1 to 2) 1·50 (1·37 to 1·68) DA LY s 13 492 (11 015 to 16 503) 9% (–3 to 24) 183 (149 to 223) –19% (–28 to –9) 201 (167 to 241) 164 (131 to 204) 1·23 (1·16 to 1·31) Prevalence 23 962 (20 402 to 27 737) 48% (34 to 63) 327 (278 to 378) 6% (–4 to 17) 334 (286 to 387) 320 (272 to 372) 1·04 (1·02 to 1·06)
Multiple sclerosis Deaths
19 (17 to 21) 61% (19 to 7 4) 0 (0 to 0) –12% (–35 to –5) 0 (0 to 0) 0 (0 to 0) 0·7 4 (0·63 to 0·91) DA LY s 1151 (969 to 1346) 66% (45 to 75) 16 (13 to 18) –4% (–16 to 1) 12 (10 to 14) 19 (16 to 23) 0·60 (0·54 to 0·67) Prevalence 2221 (2034 to 2437) 88% (85 to 90) 30 (28 to 33) 10% (9 to 12) 19 (18 to 21) 41 (37 to 45) 0·48 (0·46 to 0·49)
Migraine DALY
s 45 122 (29 046 to 62 827) 51% (50 to 53) 599 (386 to 833) 0% (–1 to 0) 422 (27 4 to 587) 778 (500 to 1084) 0·54 (0·53 to 0·56) Prevalence 1044 771 (999 535 to 1087 969) 48% (47 to 49) 13 847 (13 255 to 14 418) –2% (–2 to –2) 9356 (8962 to 9753) 18 408 (17 623 to 19 194) 0·51 (0·50 to 0·51) Tension-type headache DA LY s 7195 (4615 to 10 500) 53% (47 to 58) 96 (62 to 140) 0% (–3 to 2) 77 (50 to 113) 115 (7 4 to 167) 0·68 (0·67 to 0·68) Prevalence 1890 670 (1707 786 to 2097 762) 37% (35 to 39) 25 130 (22 741 to 27 895) –7% (–8 to –7) 20 369 (18 312 to 22 765) 29 962 (27 231 to 33 041) 0·68 (0·67 to 0·69) (T
able 1 continues
consequence of the underlying headache types. For all
neurological disorders combined we report here estimates
of deaths and DALYs because aggregate incidence and
prevalence estimates of combined neuro logical disorders
are not useful for policy making.
In the methods section of this overview paper, we present
a summary of the general methods of the GBD as they
apply to neurological disorders. In the ten accompanying
disease-specific papers, we have concentrated on methods
that are specific to each disorder. Details on the methods
of estimates for tetanus, encephalitis, and the residual
category of other neurological disorders are provided in
the appendix. The guiding principle of GBD is to assess
health loss due to mortality and disability comprehensively,
defining disability as any departure from full health. In
GBD 2016, estimates were made for 195 countries and
territories and 579 subnational locations, for 27 years
starting from 1990, for 23 age groups, and for both sexes.
Deaths were estimated for 264 diseases and injuries,
whereas prevalence and incidence were estimated for
328 diseases and injuries. To allow meaningful
com-parisons between deaths and non-fatal disease outcomes
as well as between diseases, data for deaths from and
prevalence of neurological disorders are summarised in a
single indicator, the DALY. DALYs are the sum of YLLs and
YLDs. YLLs are estimated as the product of counts of
deaths and a standard ideal remaining life expectancy at
the age of death. The standard life expectancy is derived
from the lowest observed mortality rates by age in any
population in the world larger than 5 million people.
13YLDs are estimated as the product of prevalence of
in-dividual consequences of disease (or sequelae) multiplied
by their corresponding disability weights, which quantify
the relative severity of sequelae as a number between 0
(representing full health) and 1 (representing death).
Disability weights have been estimated in nine population
surveys and an open-access internet survey in which
respondents were asked to choose the healthier option
between random pairs of health states that were presented
with short descriptions of their main features.
14Mortality estimates
All-cause mortality rates are estimated from vital
reg-istration data in countries with complete coverage as
analysed by demographic growth balance methods
com-paring successive census population counts.
15For other
countries, the probabilities of death before age 5 years
and between ages 15 and 60 years are estimated from
censuses and surveys asking mothers to provide a
history of child ren ever born and those still alive, and
surveys asking adults about siblings who are alive or
have died. Using model life tables, these probabilities of
death are trans formed into age-specific death rates by
location, year, and sex. GBD has collated a large database
of cause-of-death data from vital registrations and verbal
autopsy surveys in which relatives are asked a standard
set of questions to ascertain the likely cause of death,
Absolute numbers (thousands)
Age-standardised rate (per 100
000 people)
2016
Percentage change, 1990–2016
2016
Percentage change, 1990–2016
Males
Females
Male-to-female ratio
(Continued from previous page) Motor
neuron diseases Deaths 34 (33 to 35) 94% (80 to 102) 1 (0 to 1) 8% (0 to 12) 1 (1 to 1) 0 (0 to 0) 1·46 (1·36 to 1·54) DA LY s 926 (882 to 962) 59% (45 to 72) 13 (13 to 14) –2% (–9 to 3) 16 (15 to 16) 11 (10 to 11) 1·47 (1·36 to 1·54) Prevalence 331 (300 to 367) 67 %(62 to 72) 5 (4 to 5) 5% (3 to 6) 5 (5 to 6) 4 (4 to 5) 1·25 (1·23 to 1·28) Brain and other CNS cancer Deaths 227 (205 to 241) 64% (54 to 82) 3 (3 to 3) –2% (–8 to 8) 4 (3 to 4) 3 (2 to 3) 1·41 (1·21 to 1·65) DA LY s 7660 (6923 to 8280) 36% (26 to 55) 105 (95 to 113) –10% (–16 to 3) 122 (106 to 135) 88 (77 to 97) 1·39 (1·18 to 1·64) Prevalence 781 (693 to 818) 97% (84 to 115) 11 (10 to 12) 25% (17 to 34) 12 (10 to 13) 10 (9 to 11) 1·14 (0·98 to 1·31)
Traumatic brain injuries DALY
s 8000 (5856 to 10 108) 77% (17 to 157) 111 (82 to 141) 9% (8 to 9) 141 (104 to 180) 82 (61 to 101) 1·76 (1·16 to 2·58) Incidence 27 082 (24 302 to 30 299) 47% (44 to 51) 369 (331 to 412) 4% (2 to 5) 471 (427 to 520) 264 (232 to 301) 1·79 (1·70 to 1·88)
Spinal cord injuries DALY
s 9522 (6700 to 12 449) 40% (36 to 44) 130 (90 to 170) –10% (–13 to –7) 145 (100 to 188) 113 (80 to 146) 1·29 (1·11 to 1·48) Incidence 935 (781 to 1155) 39% (33 to 49) 13 (11 to 16) –4% (–7 to 4) 15 (12 to 18) 11 (9 to 14) 1·37 (1·27 to 1·47) Other neurological disorders Deaths 53 (51 to 55) 66% (51 to 78) 1 (1 to 1) 1% (–5 to 5) 1 (1 to 1) 1 (1 to 1) 1·42 (1·29 to 1·54) DA LY s 3695 (3114 to 4353) 54% (39 to 68) 51 (43 to 60) 11% (2 to 20) 55 (47 to 64) 46 (38 to 55) 1·21 (1·13 to 1·31)
Numbers in brack
ets are 95%
uncertainty intervals. D
AL
Ys for
traumatic brain injuries and spinal cord injuries include
years liv ed with disability only (not years
of life lost), because International
Classification
of Disease rules for cause
of
death reporting
require
that injury
deaths are assigned
to causes rather
than consequences.
W
e report incidence
or prevalence
depending
on
what is
the most commonly
used
or relevant measure
of frequency
. Prevalence estimates
of other neurological disorders and all neurological disorders w
ere not computed because aggregates
of prevalence among
disparate
disease entities are not v
ery informativ
e to policy
. D AL YS=disability -adjusted life-years. Table 1: Global deaths, D AL
Ys, incidence, and prevalence per 100
000 people and age-standardised rates b
y neurological
disorder category
supple mented with police and mortuary data for injury
deaths in countries with no other data.
Cause-of-death informa tion is provided in a large number of
dif-ferent classifica tion systems based on versions of the
International Classification of Diseases (ICD) or bespoke
classifications in some countries. All data are mapped
into the disease and injury categories of GBD. All
classification systems contain codes that are less
inform-ative than ICD
because they do not have a specific
diagnosis (eg, unspecified cancer) or refer to codes that
cannot be the underlying cause of death (eg, low back
pain or senility) or are intermediate causes (eg, heart
failure or sepsis). Such deaths are redistributed to more
precise underlying causes of death.
13After these
re-distribu tions and corrections for under-registration, the
data are analysed with the Cause of Death Ensemble
model (CODEm), a highly systematised tool that runs
many different models on the same data and chooses an
ensemble of models that best reflects all the available
input data. The statistical performance of all models is
tested by withholding 30% of the data and checking how
well a model covers the data that were held out. To
enforce consistency from CODEm, the sum of all-cause
specific mortality rates is scaled to that of the all-cause
mortality rates in each age, sex, location, and year
category. All our estimates of causes of death are
categorical: each death is assigned to a single underlying
cause. This means that all estimates add to 100%.
Non-fatal estimates
Non-fatal estimates are based on systematic reviews of
published papers and unpublished documents, survey
microdata, administrative records of health encounters,
registries, and disease surveillance systems. These data
sources are catalogued in our Global Health Data Exchange
(GHDx), the largest repository of health data globally.
We first set a reference case definition or study method,
or both, that best quantifies each disease or injury or
consequence thereof. If there is evidence of a systematic
bias in data that used different case definitions or methods
compared to reference data, we adjust those datapoints to
reflect what their value would have been if measured as
the reference. DisMod-MR 2.1, a Bayesian meta-regression
tool, is our main method of analysing non-fatal data. It is
designed as a geographical cascade where a first model is
run on data from all countries, which produces an initial
global fit and estimates coefficients for predictor variables
and the adjustments for alternative study characteristics.
The global fit adjusted by the values of random effects
for each of seven GBD super-regions (appendix), the
coefficients on sex, and country predictors, is passed down
as data to a model for each super-region together with the
input data for that geography. The same steps are repeated
going from super-regions to 21 regions and then to
195 countries and, where applicable, a further level down
to subnational units. Below the global level, all models are
run separately by sex and for six time periods (1990, 1995,
[image:5.595.40.566.128.409.2]For GHDx metadata see http://ghdx.healthdata.org Figure 1: Ranking of age-standardised DALY rates for all neurological disorders by region, 2016
DALY=disability-adjusted life-year. Global East Asia Southeast Asia Oceania Central Asia
Central Europe Eastern Europe High-income
Asia Pacific
Australasia Western Europe Southern Latin
America
High−income North
America
Caribbean Andean Latin
America Central Latin America Tropical Latin America North
Africa and Middle East
South Asia Central sub−Saharan Africa Eastern sub−Saharan Africa Southern sub−Saharan Africa W estern sub−Saharan Africa
Motor neuron diseases Multiple sclerosis Tetanus Other neurological disorders Parkinson's disease Encephalitis Tension-type headache Brain and other CNS cancer Traumatic brain injury Spinal cord injury Epilepsy Meningitis Alzheimer's disease and other dementias Migraine Stroke 1 2 3 4 5 6 7 8 9 10 11 12 13 14 15 1 2 3 4 5 6 7 8 9 10 11 12 13 14 15 1 2 3 4 5 6 7 8 9 10 11 12 13 14 15 1 2 3 4 5 6 7 8 9 10 11 12 13 14 15 1 2 3 4 5 6 7 8 9 10 11 12 13 14 15 1 2 3 4 5 6 7 8 9 10 11 12 13 14 15 1 2 3 4 5 6 7 8 9 10 11 12 13 14 15 1 2 3 4 5 6 7 8 9 10 11 12 13 14 15 1 2 3 4 5 6 7 8 9 10 11 12 13 14 15 1 2 3 4 5 6 7 8 9 10 11 12 13 14 15 1 2 3 4 5 6 7 8 9 10 11 12 13 14 15 1 2 3 4 5 6 7 8 9 10 11 12 13 14 15 1 2 3 4 5 6 7 8 9 10 11 12 13 14 15 1 2 3 4 5 6 7 8 9 10 11 12 13 14 15 1 2 3 4 5 6 7 8 9 10 11 12 13 14 15 1 2 3 4 5 6 7 8 9 10 11 12 13 14 15 1 2 3 4 5 6 7 8 9 10 11 12 13 14 15 1 2 3 4 5 6 7 8 9 10 11 12 13 14 15 1 2 3 4 5 6 7 8 9 10 11 12 13 14 15 1 2 3 4 5 6 7 8 9 10 11 12 13 14 15 1 2 3 4 5 6 7 8 9 10 11 12 13 14 15 1 2 3 4 5 6 7 8 9 10 11 12 13 14 15 5 10 15 1 Rank
2000, 2005, 2010, and 2016). During each analysis, all data
for pre valence, incidence, remission (ie, cure rate), and
mort ality are forced to be internally consistent. For most
diseases, the bulk of data for prevalence or incidence are at
the disease level, with even fewer studies providing data
on the proportions of cases of disease in each of the
sequelae defined for the disease. The proportions in each
sequela are pooled using DisMod-MR 2.1 or meta-analysis,
or are derived from analyses of patient-level datasets.
The multiplication of prevalent cases for each disease
sequela and the appropriate disability weight produces
YLD estimates that do not yet take into account
comor-bidity. To correct for comorbidity, these data are used in a
simulation to create hypothetical individuals in each age,
sex, location, and year combination who have none, one,
or multiple sequelae simultaneously. We assume that
disability weights are multiplicative rather than additive
because this avoids assigning a combined disability weight
value in any individual exceeding 1—ie, worse off than a
year lost due to death.
Risk factors
For risks, we use a different, counterfactual approach—
ie, answering the question “what would the burden have
been if the population had been exposed to a theoretical
minimum level of exposure to a risk?” Thus, we need to
define what level of exposure to a risk factor leads to the
lowest amount of disease. We then analyse data on the
prevalence of exposure to a risk and derive relative risks
for any risk–outcome pair for which we find sufficient
evidence of a causal relationship.
16Prevalence of exposure
is estimated in DisMod-MR 2.1 using spatiotemporal
Gaussian process regression, or from satellite imagery in
the case of ambient air pollution. Relative risk data are
pooled using meta-analysis of cohort, case-control, and
intervention studies. From the prevalence and relative
risk results, population attributable fractions are
esti-mated relative to the theoretical minimum risk exposure
level (TMREL). Criteria for inclusion of risks into GBD
were the availability of sufficient evidence for a causal
relationship between a risk and one or more disease or
injury outcomes; evidence to support generalisability
of an effect size beyond the populations included in
epidemiological studies; availability of sufficient data and
methods to enable estimation of exposure levels by
country; and the likely importance of a risk factor to
disease burden or policy considerations.
17Uncertainty intervals (UIs)
Uncertainty is propagated throughout all these
calcula-tions by creating 1000 values for each prevalence, death,
YLL, YLD, or DALY estimate and performing
aggrega-tions across causes and locaaggrega-tions at the level of each of the
1000 values for all intermediate steps in the calculation.
The lower and upper bounds of the 95% UI are the 25th
and 975th values of the ordered 1000 values. Significance
of differences was established if 975 or more of the ordered
1000 values of difference were on either side of zero.
SDI
GBD uses a composite indicator of sociodemographic
development, SDI, which reflects the geometric mean of
normalised values of a location’s income per capita,
the average years of schooling in the population aged
15 years and older, and the total fertility rate.
Coun tries and territories are grouped into quintiles of
high, high-middle, middle, low-middle, and low SDI
[image:6.595.31.332.126.591.2]based on their 2016 values.
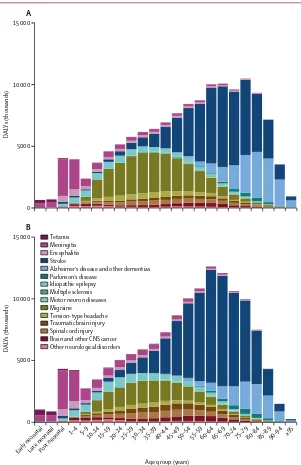
13Figure 2: Global DALYs for neurological disorders by sex and age, 2016
Early neonatal is 0–7 days; late neonatal is 7–28 days; and post-neonatal is 28 days to 1 year. (A) Females. (B) Males. DALY=disability-adjusted life-year.
Early neonata l
Late neonata l
Post neon
atal 1–4 5–9
10–1415–19 20–2425–2930–3435–3940–4445–4950–5455–5960–6465–69 70–7475–7980–8485–8990–94 ≥95
0 5000 10 000 15 000
DA
LY
s (thousands)
Age group (years)
A
0 5000 10 000 15 000
DA
LY
s (thousands)
B
Tetanus Meningitis Encephalitis Stroke
Alzheimer’s disease and other dementias Parkinson’s disease
Idiopathic epilepsy Multiple sclerosis Motor neuron diseases Migraine
Role of the funding source
The funder of the study had no role in study design,
data collection, data analysis, data interpretation, or the
writing of the report. All authors had full access to the data
in the study and had final responsibility for the decision
to submit for publication.
Results
In 2016, the neurological disorders included in this
analysis were responsible for 276 million (95% UI
247–308) DALYs, comprising 11·6% (10·7–12·4) of global
DALYs for all diseases. Combined, these disorders were
the underlying cause in 9·0 million (8·8–9·4) deaths or
16·5% (16·1–17·0) of total global deaths in 2016. Incidence
and prevalence estimates for each neurological disorder
can be found in the GBD online results tool. Results and
findings mentioned can also be viewed interactively
through an online data visualisation tool. Neurological
disorders were the leading cause group of global DALYs
in 2016, followed by cardiovascular diseases (excluding
stroke). In terms of deaths, these combined
neurologi-cal disorders ranked second after cardiovascular diseases.
Since 1990, the number of deaths from neurological
dis-orders increased by 39% (34–44) and DALYs for
neuro-logical disorders increased by 15% (9–21). However,
age-standardised mortality rates decreased by 28%
(26–30) over the same time, indicating that popula tion
increase and ageing are driving global numbers higher,
even though the global population is exposed to a lower
risk of death from these causes, as indicated by the lower
age-standardised rates. Sim ilarly, the age-standardised
DALY rates decreased by 27% (24–31) between 1990 and
2016. The only neuro logical disorders that had a decrease
in rates and absolute numbers of deaths and DALYs were
tetanus, meningitis, and encephalitis.
Stroke was the largest contributor to global neurological
DALYs, responsible for 42·2% (95% UI 38·6–46·1) of
these DALYs in 2016 (table 1). Migraine was the second
largest contributor (16·3% [11·7–20·8]), followed by
Alzheimer’s and other dementias (10·4% [9·0–12·1]) and
meningitis (7·9% [6·6–10·4]). Stroke ranked first among
neurological disorders in terms of age-standardised
DALY rates in 19 of 21 world regions (figure 1). In
Australasia and western Europe, migraine ranked first.
Migraine and Alzheimer’s disease and other dementias
were ranked among the top four contributing
neuro-logical conditions in all 21 GBD world regions. Large
variations in ranking were found for meningitis (ranked
second in central, eastern, and western sub-Saharan
Africa and 14th in high-income Asia Pacific), epilepsy
(ranked second in southern sub-Saharan Africa and
third in central Asia and eighth in eastern Europe),
and encephalitis (ranked fifth in south Asia and 14th
in Australasia, western Europe, and high-income North
America). Other high rankings of note are for spinal
cord injury (ranked fourth in all five high-income
regions), TBI (ranked fourth in central and eastern
Europe), and tetanus (ranked sixth in eastern
sub-Saharan Africa; figure 1).
[image:7.595.264.562.126.593.2]Across the aggregate of 15 neurological disorder
categories analysed, age-standardised DALY rates were
significantly higher in males than in females
(male-to-female ratio 1·12 [95% UI 1·05–1·20]). When
examin-ing individual disorders, a significantly higher burden (as
measured by age-standardised DALY rates) in males than
females was observed for TBI, Parkinson’s disease,
tetanus, motor neuron diseases, and stroke, with
male-to-female ratios of at least 1·5. By contrast, migraine,
Figure 3: Global YLLs and YLDs for neurological disorders by age, 2016YLLs (A) and YLDs (B). Early neonatal is 0–7 days; late neonatal is 7–28 days; post-neonatal is 28 days to 1 year. YLDs=years lived with disability. YLLs=years of life lost.
Early neonata l
Late neonata l
Post neon
atal 1–4 5–9
10–1415–19 20–2425–2930–3435–3940–4445–4950–5455–5960–6465–69 70–7475–7980–8485–8990–94 ≥95
0 5000 10 000 15 000
YLDs (thousands)
Age group (years)
B
0 5000 10 000 20 000
15 000
YLLs (thousands)
A
Tetanus Meningitis Encephalitis Stroke
Alzheimer’s disease and other dementias Parkinson’s disease
Idiopathic epilepsy Multiple sclerosis Motor neuron diseases
Brain and other CNS cancer Other neurological disorders
Migraine
Tension-type headache Traumatic brain injury Spinal chord injury
For the online results tool see http://ghdx.healthdata.org/gbd-results-tool
Absolute numbers of DALYs (thousands) Age-standardised DALY rates (per 100 000 people)
1990 2016 Percentage change,
1990–2016 1990 2016 Percentage change, 1990–2016
Global 240 379 (219 338 to 262 279) 276 143 (246 544 to 307 994) 15% (9 to 21) 5467 (5024 to 5913) 3968 (3557 to 4396) –27% (–31 to –24) High-income North
America 8455 (7193 to 9751) 11 780 (10 040 to 13 527) 39% (37 to 42) 2867 (2446 to 3305) 2629 (2208 to 3056) –8% (–10 to –7)
Canada 794 (667 to 932) 1137 (950 to 1331) 43% (37 to 50) 2807 (2366 to 3271) 2433 (1998 to 2884) –13% (–18 to –9)
Greenland 2 (2 to 2) 2 (1 to 2) –12% (–24 to 1) 6956 (6236 to 7848) 4262 (3552 to 4953) –39% (–47 to –30)
USA 7658 (6530 to 8823) 10 640 (9085 to 12 209) 39% (36 to 42) 2872 (2451 to 3310) 2652 (2232 to 3083) –8% (–10 to –6)
Australasia 624 (529 to 723) 860 (725 to 1007) 38% (32 to 44) 3047 (2602 to 3498) 2444 (2020 to 2902) –20% (–24 to –15)
Australia 516 (437 to 598) 722 (608 to 846) 40% (33 to 47) 3016 (2573 to 3482) 2430 (2002 to 2905) –20% (–24 to –15) New Zealand 108 (92 to 123) 138 (116 to 162) 28% (20 to 36) 3201 (2763 to 3650) 2518 (2082 to 2988) –21% (–27 to –16)
High-income Asia-Pacific 6136 (5368 to 6922) 7635 (6626 to 8723) 24% (18 to 31) 3643 (3210 to 4091) 2511 (2100 to 2959) –31% (–35 to –27)
Brunei 6 (5 to 7) 11 (9 to 13) 71% (53 to 91) 4183 (3693 to 4689) 3192 (2726 to 3738) –24% (–31 to –16)
Japan 4336 (3781 to 4904) 5715 (4977 to 6480) 32% (27 to 37) 3202 (2786 to 3626) 2410 (2012 to 2827) –25% (–28 to –22) Singapore 73 (63 to 86) 102 (83 to 122) 39% (26 to 55) 3436 (2998 to 3912) 2225 (1809 to 2670) –35% (–43 to –28) South Korea 1730 (1506 to 1959) 1807 (1453 to 2157) 4% (–12 to 22) 5929 (5300 to 6575) 2912 (2351 to 3455) –51% (–59 to –43)
Western Europe 16 002 (13 971 to 18 071) 16 727 (14 215 to 19 172) 4% (1 to 8) 3489 (3004 to 3973) 2686 (2219 to 3174) –23% (–27 to –20)
Andorra 2 (1 to 2) 3 (3 to 4) 74% (53 to 98) 3008 (2437 to 3591) 2686 (2180 to 3231) –11% (–21 to 0)
Austria 342 (299 to 389) 318 (264 to 375) –7% (–13 to –1) 3651 (3139 to 4178) 2632 (2137 to 3163) –28% (–33 to –23) Belgium 430 (375 to 489) 454 (385 to 530) 6% (–2 to 12) 3558 (3073 to 4108) 2823 (2329 to 3363) –21% (–27 to –15)
Cyprus 24 (21 to 27) 30 (25 to 36) 28% (19 to 37) 3663 (3169 to 4215) 2756 (2247 to 3268) –25% (–31 to –19)
Denmark 220 (192 to 250) 206 (174 to 240) –6% (–13 to 1) 3460 (2967 to 3962) 2693 (2232 to 3200) –22% (–28 to –16) Finland 227 (199 to 256) 245 (210 to 283) 8% (2 to 14) 3932 (3440 to 4459) 2995 (2498 to 3538) –24% (–29 to –19) France 2070 (1763 to 2376) 2349 (1985 to 2737) 13% (7 to 20) 3134 (2644 to 3638) 2576 (2101 to 3096) –18% (–24 to –11) Germany 3479 (3047 to 3951) 3290 (2798 to 3810) –5% (–12 to 2) 3498 (3020 to 4025) 2645 (2172 to 3159) –24% (–31 to –17) Greece 488 (434 to 545) 530 (464 to 601) 9% (3 to 15) 4000 (3515 to 4505) 3002 (2535 to 3501) –25% (–30 to –21)
Iceland 8 (7 to 10) 11 (9 to 13) 34% (27 to 42) 3229 (2748 to 3740) 2793 (2304 to 3319) –14% (–19 to –8)
Ireland 126 (108 to 144) 145 (120 to 173) 15% (6 to 24) 3578 (3078 to 4082) 2747 (2258 to 3298) –23% (–30 to –17) Israel 137 (116 to 158) 223 (183 to 268) 62% (47 to 78) 3432 (2939 to 3948) 2632 (2140 to 3188) –23% (–31 to –16) Italy 2448 (2118 to 2794) 2684 (2279 to 3088) 10% (4 to 17) 3533 (3010 to 4084) 2729 (2228 to 3269) –23% (–28 to –18) Luxembourg 18 (16 to 20) 20 (16 to 23) 8% (–1 to 17) 4068 (3555 to 4624) 2704 (2221 to 3233) –34% (–39 to –28)
Malta 12 (11 to 14) 15 (13 to 18) 22% (11 to 34) 3601 (3091 to 4140) 2700 (2187 to 3228) –25% (–32 to –18)
Netherlands 539 (463 to 624) 614 (517 to 713) 14% (7 to 21) 3232 (2770 to 3743) 2680 (2198 to 3191) –17% (–23 to –11) Norway 181 (159 to 204) 181 (153 to 210) 0% (–7 to 8) 3380 (2926 to 3859) 2653 (2200 to 3134) –22% (–27 to –15) Portugal 604 (550 to 663) 487 (424 to 555) –19% (–24 to –15) 5166 (4651 to 5701) 2964 (2488 to 3476) –43% (–47 to –38) Spain 1533 (1331 to 1744) 1791 (1511 to 2069) 17% (11 to 22) 3482 (2995 to 3982) 2596 (2118 to 3110) –26% (–30 to –21) Sweden 340 (297 to 385) 361 (305 to 415) 6% (–1 to 13) 2983 (2540 to 3451) 2531 (2074 to 2974) –15% (–21 to –10) Switzerland 266 (228 to 307) 292 (239 to 350) 10% (–1 to 23) 3244 (2744 to 3785) 2474 (1979 to 3010) –24% (–31 to –16) UK 2503 (2210 to 2814) 2467 (2113 to 2832) –2% (–5 to 1) 3538 (3087 to 4032) 2771 (2303 to 3255) –22% (–25 to –19)
Southern Latin America 1702 (1509 to 1908) 1849 (1557 to 2150) 9% (1 to 16) 3907 (3484 to 4353) 2680 (2256 to 3120) –31% (–36 to –27)
Argentina 1176 (1047 to 1313) 1214 (1033 to 1411) 3% (–4 to 11) 3960 (3535 to 4408) 2696 (2288 to 3135) –32% (–37 to –27) Chile 396 (344 to 458) 511 (414 to 616) 29% (13 to 47) 3757 (3330 to 4254) 2592 (2101 to 3120) –31% (–40 to –21) Uruguay 130 (117 to 144) 124 (108 to 141) –4% (–10 to 2) 4006 (3593 to 4464) 2927 (2500 to 3380) –27% (–32 to –22)
Eastern Europe 13 148 (11 851 to 14 406) 12 781 (10 708 to 15 168) –3% (–16 to 12) 5762 (5216 to 6301) 4723 (3975 to 5551) –18% (–28 to –6)
Belarus 522 (467 to 579) 495 (420 to 572) –5% (–15 to 5) 4969 (4467 to 5488) 4146 (3525 to 4771) –17% (–25 to –9) Estonia 92 (83 to 101) 56 (47 to 65) –39% (–46 to –33) 5442 (4910 to 5963) 3114 (2604 to 3640) –43% (–48 to –37) Latvia 172 (156 to 190) 123 (106 to 138) –29% (–34 to –22) 5881 (5336 to 6470) 4125 (3553 to 4712) –30% (–36 to –24) Lithuania 155 (137 to 174) 149 (132 to 167) –4% (–9 to 2) 4167 (3678 to 4658) 3633 (3156 to 4110) –13% (–17 to –8) Moldova 226 (203 to 250) 201 (176 to 230) –11% (–19 to –2) 5875 (5317 to 6431) 4492 (3944 to 5117) –24% (–31 to –17) Russia 8854 (7878 to 9776) 9137 (7442 to 11 332) 3% (–15 to 26) 5990 (5357 to 6584) 4972 (4087 to 6090) –17% (–30 to 0) Ukraine 3126 (2835 to 3440) 2622 (2169 to 3132) –16% (–27 to –3) 5460 (4916 to 6030) 4326 (3599 to 5155) –21% (–31 to –9)
Absolute numbers of DALYs (thousands) Age-standardised DALY rates (per 100 000 people)
1990 2016 Percentage change,
1990–2016 1990 2016 Percentage change, 1990–2016
(Continued from previous page)
Central Europe 6289 (5663 to 6896) 5701 (5055 to 6380) –9% (–13 to –6) 5172 (4678 to 5662) 3758 (3278 to 4241) –27% (–31 to –24)
Albania 116 (101 to 132) 140 (122 to 159) 21% (7 to 35) 4838 (4353 to 5362) 4437 (3879 to 5028) –8% (–17 to 1) Bosnia and Herzegovina 191 (168 to 216) 205 (179 to 235) 7% (–5 to 21) 5193 (4626 to 5763) 4137 (3593 to 4794) –20% (–29 to –11) Bulgaria 615 (563 to 669) 508 (441 to 572) –17% (–26 to –8) 6120 (5564 to 6659) 4637 (3997 to 5233) –24% (–31 to –17) Croatia 260 (233 to 290) 225 (198 to 256) –13% (–21 to –5) 5030 (4485 to 5606) 3662 (3173 to 4202) –27% (–34 to –20) Czech Republic 576 (520 to 635) 415 (355 to 479) –28% (–33 to –23) 5201 (4686 to 5744) 3112 (2635 to 3641) –40% (–45 to –35) Hungary 639 (579 to 703) 467 (400 to 531) –27% (–33 to –21) 5447 (4924 to 6007) 3496 (2976 to 4014) –36% (–42 to –30) Macedonia 102 (91 to 114) 124 (111 to 138) 21% (13 to 30) 6304 (5682 to 7012) 5154 (4606 to 5763) –18% (–24 to –12) Montenegro 30 (27 to 33) 36 (32 to 41) 21% (9 to 33) 5433 (4878 to 6006) 4772 (4218 to 5331) –12% (–20 to –4) Poland 1589 (1407 to 1770) 1555 (1335 to 1778) –2% (–9 to 5) 4390 (3910 to 4872) 3246 (2782 to 3753) –26% (–31 to –21) Romania 1352 (1226 to 1487) 1231 (1096 to 1376) –9% (–16 to –2) 5814 (5265 to 6371) 4492 (3961 to 5057) –23% (–28 to –17) Serbia 498 (440 to 559) 498 (438 to 561) 0% (–8 to 8) 5402 (4811 to 6057) 4260 (3697 to 4830) –21% (–27 to –15) Slovakia 225 (199 to 253) 219 (185 to 253) –3% (–11 to 7) 4579 (4069 to 5106) 3420 (2907 to 3952) –25% (–32 to –18) Slovenia 88 (77 to 101) 79 (67 to 92) –11% (–20 to –2) 4414 (3855 to 4983) 2909 (2431 to 3444) –34% (–41 to –27)
Central Asia 2740 (2477 to 3023) 3305 (2919 to 3726) 21% (15 to 27) 5522 (5055 to 6014) 4661 (4197 to 5173) –16% (–19 to –12)
Armenia 117 (102 to 135) 105 (89 to 122) –11% (–18 to –3) 4325 (3839 to 4844) 3184 (2714 to 3713) –26% (–32 to –20) Azerbaijan 247 (216 to 280) 359 (302 to 420) 45% (27 to 63) 4924 (4415 to 5463) 4248 (3627 to 4917) –14% (–24 to –4) Georgia 306 (276 to 338) 228 (199 to 261) –25% (–34 to –16) 5721 (5177 to 6290) 4543 (3947 to 5206) –21% (–29 to –11) Kazakhstan 703 (625 to 791) 694 (589 to 809) –1% (–12 to 12) 5586 (5029 to 6189) 4614 (3941 to 5317) –17% (–26 to –7) Kyrgyzstan 198 (179 to 218) 207 (181 to 235) 5% (–4 to 14) 6426 (5918 to 6973) 4867 (4364 to 5438) –24% (–30 to –18) Mongolia 95 (76 to 116) 141 (123 to 162) 50% (21 to 85) 5749 (5075 to 6485) 6460 (5729 to 7287) 13% (–2 to 29) Tajikistan 213 (185 to 242) 279 (238 to 326) 31% (12 to 53) 5819 (5211 to 6476) 5037 (4427 to 5718) –13% (–23 to –2) Turkmenistan 137 (122 to 153) 206 (181 to 232) 50% (37 to 65) 5646 (5164 to 6181) 5085 (4582 to 5587) –10% (–16 to –3) Uzbekistan 722 (637 to 820) 1083 (922 to 1262) 50% (34 to 67) 5300 (4761 to 5896) 4631 (4027 to 5309) –13% (–21 to –4)
Central Latin America 4147 (3576 to 4743) 5654 (4688 to 6652) 36% (29 to 43) 3410 (3016 to 3836) 2631 (2241 to 3048) –23% (–26 to –19)
Colombia 894 (758 to 1053) 1078 (875 to 1309) 21% (6 to 38) 3692 (3246 to 4213) 2542 (2119 to 3035) –31% (–38 to –23) Costa Rica 62 (51 to 75) 107 (87 to 130) 72% (53 to 92) 2799 (2395 to 3241) 2336 (1937 to 2803) –17% (–25 to –8) El Salvador 161 (138 to 185) 140 (114 to 168) –13% (–23 to –1) 4033 (3536 to 4548) 2538 (2106 to 3000) –37% (–44 to –30) Guatemala 220 (188 to 255) 346 (280 to 419) 58% (35 to 80) 3314 (2843 to 3777) 2823 (2315 to 3365) –15% (–27 to –2) Honduras 200 (173 to 228) 224 (185 to 269) 13% (–5 to 36) 4829 (4234 to 5470) 3461 (2887 to 4126) –28% (–39 to –14) Mexico 1979 (1695 to 2284) 2800 (2332 to 3313) 41% (35 to 48) 3158 (2755 to 3576) 2562 (2173 to 2977) –19% (–22 to –16) Nicaragua 101 (85 to 120) 128 (103 to 155) 27% (10 to 47) 3500 (3026 to 3996) 2644 (2195 to 3120) –24% (–33 to –15) Panama 61 (53 to 71) 94 (78 to 113) 55% (38 to 74) 3526 (3122 to 3997) 2681 (2256 to 3161) –24% (–32 to –16) Venezuela 467 (394 to 554) 732 (592 to 885) 57% (35 to 81) 3623 (3180 to 4140) 2837 (2350 to 3390) –22% (–31 to –11)
Andean Latin America 1114 (981 to 1258) 1248 (1037 to 1496) 12% (1 to 25) 3715 (3321 to 4148) 2457 (2073 to 2913) –34% (–40 to –28)
Bolivia 272 (234 to 310) 272 (225 to 322) 0% (–16 to 17) 4942 (4339 to 5634) 3022 (2517 to 3552) –39% (–47 to –30) Ecuador 267 (229 to 312) 346 (282 to 416) 29% (13 to 49) 3529 (3096 to 4029) 2467 (2061 to 2928) –30% (–38 to –21) Peru 575 (493 to 657) 630 (509 to 778) 10% (–5 to 28) 3411 (2964 to 3835) 2271 (1868 to 2742) –33% (–41 to –24)
Caribbean 1576 (1383 to 1786) 1544 (1346 to 1784) –2% (–14 to 9) 5057 (4518 to 5636) 3539 (3108 to 4056) –30% (–37 to –23)
Antigua and Barbuda 2 (2 to 2) 3 (2 to 3) 16% (3 to 30) 4249 (3780 to 4758) 2987 (2538 to 3492) –30% (–37 to –22) The Bahamas 7 (6 to 8) 12 (10 to 14) 68% (51 to 85) 3909 (3470 to 4375) 3142 (2683 to 3604) –20% (–27 to –12)
Barbados 10 (8 to 11) 10 (9 to 12) 6% (–2 to 16) 3853 (3421 to 4321) 2963 (2555 to 3428) –23% (–29 to –16)
Belize 5 (4 to 6) 8 (7 to 9) 63% (43 to 85) 3606 (3206 to 4065) 3253 (2830 to 3719) –10% (–18 to –1)
Bermuda 2 (1 to 2) 2 (1 to 2) 2% (–9 to 14) 3980 (3514 to 4491) 2492 (2081 to 2945) –37% (–44 to –30)
Cuba 341 (301 to 385) 395 (342 to 449) 16% (8 to 25) 3542 (3159 to 3965) 2795 (2394 to 3202) –21% (–27 to –15)
Dominica 2 (2 to 2) 2 (2 to 3) 15% (3 to 30) 3673 (3258 to 4145) 3155 (2712 to 3645) –14% (–22 to –4)
Dominican Republic 215 (188 to 246) 267 (222 to 313) 24% (8 to 40) 4168 (3716 to 4650) 3049 (2590 to 3540) –27% (–35 to –19)
Grenada 4 (3 to 4) 4 (3 to 4) –4% (–15 to 9) 4892 (4404 to 5433) 3881 (3384 to 4413) –21% (–30 to –11)
Absolute numbers of DALYs (thousands) Age-standardised DALY rates (per 100 000 people)
1990 2016 Percentage change,
1990–2016 1990 2016 Percentage change, 1990–2016
(Continued from previous page)
Haiti 698 (566 to 867) 513 (414 to 642) –26% (–43 to –7) 10 731 (9117 to 12 733) 6137 (5102 to 7235) –43% (–53 to –31) Jamaica 86 (76 to 98) 98 (84 to 114) 14% (0 to 28) 4332 (3848 to 4831) 3584 (3077 to 4127) –17% (–27 to –8) Puerto Rico 89 (76 to 105) 103 (87 to 121) 16% (7 to 27) 2696 (2305 to 3147) 2359 (1988 to 2789) –12% (–20 to –4)
Saint Lucia 5 (4 to 5) 6 (5 to 7) 17% (6 to 29) 4503 (4053 to 4964) 3139 (2723 to 3611) –30% (–36 to –24)
Saint Vincent and the
Grenadines 3 (3 to 4) 4 (3 to 4) 9% (–2 to 20) 4266 (3816 to 4750) 3758 (3307 to 4247) –12% (–19 to –4)
Suriname 15 (13 to 17) 20 (18 to 23) 37% (23 to 51) 4726 (4287 to 5218) 4318 (3845 to 4832) –9% (–16 to –1) Trinidad and Tobago 42 (37 to 47) 44 (38 to 51) 7% (–3 to 18) 4660 (4220 to 5122) 3310 (2880 to 3815) –29% (–35 to –22) Virgin Islands 3 (2 to 3) 4 (3 to 4) 43% (28 to 59) 3221 (2819 to 3705) 2752 (2328 to 3235) –15% (–23 to –6)
Tropical Latin America 5303 (4757 to 5894) 6470 (5604 to 7378) 22% (16 to 27) 5185 (4768 to 5648) 3345 (2941 to 3761) –36% (–39 to –32)
Brazil 5188 (4654 to 5761) 6288 (5443 to 7172) 21% (15 to 27) 5215 (4789 to 5681) 3341 (2939 to 3757) –36% (–39 to –33) Paraguay 114 (99 to 130) 181 (154 to 211) 59% (43 to 76) 4117 (3681 to 4567) 3541 (3074 to 4048) –14% (–22 to –5)
East Asia 51 041 (47 231 to 55 200) 61 366 (55 894 to 66 880) 20% (13 to 26) 6205 (5792 to 6702) 4115 (3752 to 4475) –34% (–38 to –30)
China 49 814 (46 115 to 53 839) 59 292 (54 070 to 64 582) 19% (12 to 25) 6273 (5853 to 6780) 4126 (3776 to 4497) –34% (–39 to –30) North Korea 646 (560 to 730) 1402 (1256 to 1555) 118% (94 to 142) 4663 (4091 to 5222) 5569 (5018 to 6138) 20% (7 to 34) Taiwan (Province of
China) 581 (514 to 651) 675 (575 to 785) 16% (6 to 27) 4011 (3635 to 4408) 2382 (2035 to 2761) –41% (–46 to –35)
Southeast Asia 17 191 (15 142 to 19 147) 22 694 (20 351 to 25 135) 32% (22 to 42) 5422 (4944 to 5880) 4293 (3910 to 4691) –21% (–25 to –16)
Cambodia 769 (575 to 1096) 541 (476 to 613) –28% (–53 to –4) 11 005 (8966 to 14 491) 5363 (4850 to 5922) –51% (–63 to –40) Indonesia 6849 (5419 to 8075) 9260 (8270 to 10 280) 36% (18 to 63) 5295 (4613 to 5961) 4785 (4345 to 5229) –9% (–18 to 0) Laos 338 (256 to 470) 263 (221 to 317) –20% (–46 to 6) 9753 (8128 to 12 675) 5511 (4862 to 6127) –43% (–57 to –31) Malaysia 516 (455 to 580) 806 (691 to 928) 56% (42 to 70) 4911 (4499 to 5356) 3456 (3035 to 3873) –30% (–35 to –25)
Maldives 6 (5 to 7) 7 (5 to 8) 9% (–11 to 30) 4917 (4312 to 5586) 2605 (2157 to 3116) –47% (–55 to –38)
Mauritius 37 (33 to 41) 40 (35 to 47) 9% (–2 to 21) 5367 (4940 to 5809) 3151 (2717 to 3635) –41% (–47 to –35) Myanmar 1913 (1648 to 2191) 2004 (1754 to 2303) 5% (–10 to 22) 7118 (6318 to 8037) 4964 (4438 to 5592) –30% (–39 to –21) Philippines 1779 (1585 to 2002) 3318 (2887 to 3780) 87% (69 to 107) 4486 (4078 to 4924) 4614 (4073 to 5176) 3% (–7 to 14) Sri Lanka 464 (398 to 534) 598 (493 to 713) 29% (13 to 48) 3720 (3254 to 4175) 3088 (2573 to 3625) –17% (–27 to –6)
Seychelles 3 (2 to 3) 3 (3 to 3) 15% (1 to 30) 4584 (4064 to 5100) 3279 (2846 to 3784) –28% (–36 to –20)
Thailand 1611 (1405 to 1837) 2149 (1829 to 2487) 33% (22 to 47) 4080 (3657 to 4524) 2936 (2517 to 3398) –28% (–34 to –21) Timor-Leste 38 (28 to 52) 32 (26 to 39) –13% (–41 to 17) 7358 (5973 to 10 288) 4356 (3547 to 5126) –40% (–60 to –24) Vietnam 2855 (2475 to 3286) 3643 (3217 to 4120) 28% (11 to 47) 6094 (5347 to 6967) 4403 (3930 to 4929) –28% (–37 to –17)
Oceania 278 (241 to 318) 453 (385 to 528) 64% (40 to 91) 6675 (5920 to 7501) 5708 (4950 to 6484) –14% (–25 to –2)
American Samoa 1 (1 to 1) 2 (2 to 2) 48% (28 to 68) 4475 (4013 to 4954) 3591 (3104 to 4107) –20% (–29 to –9) Federated States of
Micronesia 4 (3 to 4) 4 (3 to 5) 4% (–17 to 28) 6909 (5992 to 7925) 5898 (4870 to 7095) –14% (–31 to 4)
Fiji 20 (17 to 24) 29 (24 to 34) 42% (13 to 77) 4706 (3919 to 5562) 4149 (3461 to 4885) –11% (–29 to 9)
Guam 3 (3 to 3) 5 (5 to 6) 86% (67 to 108) 3497 (3090 to 3897) 3387 (2947 to 3860) –3% (–12 to 7)
Kiribati 4 (4 to 5) 6 (5 to 7) 37% (14 to 65) 8312 (7508 to 9152) 7477 (6596 to 8483) –10% (–22 to 4)
Marshall Islands 1 (1 to 2) 2 (2 to 3) 56% (33 to 80) 5425 (4834 to 5998) 4648 (4024 to 5336) –14% (–25 to –2) Northern Mariana Islands 1 (1 to 1) 2 (2 to 3) 134% (95 to 177) 4201 (3571 to 4858) 3300 (2815 to 3790) –21% (–34 to –7) Papua New Guinea 211 (179 to 249) 349 (290 to 420) 66% (36 to 102) 8172 (7063 to 9467) 6825 (5749 to 7933) –16% (–29 to –1)
Samoa 5 (4 to 6) 6 (5 to 7) 16% (–1 to 32) 5335 (4702 to 6048) 4235 (3630 to 4839) –20% (–31 to –10)
Solomon Islands 12 (10 to 15) 25 (21 to 29) 101% (69 to 142) 7860 (6720 to 9116) 7104 (6075 to 8391) –9% (–23 to 8)
Tonga 3 (2 to 4) 3 (3 to 4) 7% (–13 to 29) 4363 (3789 to 5000) 3793 (3287 to 4300) –13% (–25 to 1)
Vanuatu 6 (5 to 7) 12 (10 to 14) 99% (67 to 138) 7380 (6333 to 8453) 6726 (5726 to 7972) –9% (–22 to 8)
North Africa and Middle
East 12 521 (10 765 to 14 400) 17 300 (14 801 to 20 108) 38% (25 to 51) 5033 (4483 to 5597) 4048 (3534 to 4593) –20% (–24 to –15)
Absolute numbers of DALYs (thousands) Age-standardised DALY rates (per 100 000 people)
1990 2016 Percentage change,
1990–2016 1990 2016 Percentage change, 1990–2016
(Continued from previous page)
Egypt 2065 (1814 to 2328) 2790 (2331 to 3291) 35% (20 to 50) 5105 (4551 to 5697) 4204 (3607 to 4868) –18% (–25 to –9) Iran 1474 (1197 to 1787) 2244 (1816 to 2732) 53% (33 to 75) 4255 (3646 to 4909) 3601 (3005 to 4220) –15% (–25 to –4) Iraq 773 (607 to 984) 1335 (1068 to 1668) 74% (44 to 108) 6556 (5486 to 7823) 5711 (4692 to 6862) –13% (–25 to 1) Jordan 80 (67 to 94) 166 (132 to 203) 107% (80 to 137) 4463 (3903 to 5044) 3410 (2835 to 4053) –24% (–35 to –12)
Kuwait 35 (27 to 44) 76 (57 to 97) 118% (94 to 145) 2999 (2532 to 3548) 3033 (2443 to 3642) 1% (–12 to 15)
Lebanon 106 (75 to 150) 172 (122 to 239) 63% (44 to 87) 4910 (3743 to 6453) 3219 (2421 to 4359) –34% (–42 to –27) Libya 119 (98 to 146) 168 (136 to 205) 42% (19 to 65) 4050 (3501 to 4694) 3657 (3084 to 4280) –10% (–20 to 1) Morocco 991 (792 to 1210) 1023 (848 to 1216) 4% (–14 to 23) 4934 (4237 to 5684) 3643 (3114 to 4246) –26% (–35 to –18) Palestine 64 (50 to 78) 132 (110 to 158) 108% (74 to 149) 5366 (4612 to 6160) 5245 (4642 to 5888) –2% (–12 to 9)
Oman 73 (58 to 91) 97 (77 to 119) 35% (0 to 72) 4884 (4235 to 5577) 3149 (2699 to 3626) –35% (–43 to –26)
Qatar 11 (9 to 13) 40 (30 to 51) 272% (219 to 330) 3622 (3068 to 4223) 2643 (2124 to 3215) –27% (–38 to –15) Saudi Arabia 358 (296 to 424) 695 (559 to 840) 94% (78 to 112) 4133 (3574 to 4701) 3569 (3090 to 4081) –14% (–21 to –6) Sudan 800 (669 to 961) 1141 (943 to 1352) 43% (23 to 64) 5996 (5197 to 6950) 4513 (3907 to 5170) –25% (–32 to –18) Syria 433 (371 to 505) 499 (398 to 618) 15% (–6 to 37) 5065 (4514 to 5636) 3830 (3206 to 4582) –24% (–33 to –15) Tunisia 228 (193 to 267) 333 (273 to 394) 46% (30 to 64) 3992 (3466 to 4572) 3287 (2748 to 3849) –18% (–26 to –9) Turkey 2203 (1647 to 2782) 2302 (1891 to 2722) 6% (–16 to 39) 4665 (3760 to 5597) 3245 (2709 to 3788) –30% (–41 to –15) United Arab Emirates 49 (39 to 60) 251 (204 to 306) 415% (321 to 516) 4988 (4225 to 5937) 4025 (3461 to 4681) –19% (–33 to –4) Yemen 511 (417 to 646) 776 (650 to 911) 53% (23 to 86) 6744 (5797 to 7782) 5157 (4468 to 5856) –23% (–32 to –14)
South Asia 56 902 (49 124 to 64 150) 56 158 (49 114 to 63 659) –1% (–13 to 13) 6103 (5459 to 6731) 4193 (3768 to 4660) –31% (–38 to –25)
Bangladesh 5569 (4106 to 6565) 5549 (4751 to 6369) 1% (–17 to 33) 7063 (6076 to 7857) 4646 (4090 to 5217) –34% (–42 to –24) Bhutan 32 (23 to 43) 22 (18 to 26) –30% (–51 to –8) 6606 (5436 to 8048) 3552 (3035 to 4108) –46% (–57 to –36) India 43 351 (37 483 to 49 294) 42 665 (37 236 to 48 655) –1% (–14 to 13) 5912 (5244 to 6557) 4029 (3589 to 4500) –32% (–38 to –25) Nepal 1708 (1150 to 2543) 955 (797 to 1132) –42% (–62 to –20) 8424 (6611 to 10 789) 4217 (3628 to 4842) –49% (–61 to –38) Pakistan 6240 (5281 to 7377) 6958 (5932 to 8175) 12% (–9 to 38) 6415 (5671 to 7237) 5034 (4410 to 5746) –21% (–32 to –9)
Southern sub-Saharan
Africa 1503 (1327 to 1680) 2298 (2048 to 2577) 53% (43 to 64) 4091 (3662 to 4498) 3939 (3574 to 4330) –4% (–10 to 3)
Botswana 34 (28 to 40) 60 (41 to 79) 77% (25 to 129) 4752 (3945 to 5594) 4064 (2676 to 5292) –14% (–42 to 12)
Lesotho 50 (43 to 58) 77 (63 to 94) 54% (25 to 89) 5230 (4467 to 6024) 6010 (4831 to 7378) 15% (–8 to 43)
Namibia 46 (40 to 53) 61 (46 to 75) 32% (4 to 59) 5901 (5271 to 6590) 3989 (3028 to 4827) –32% (–47 to –19)
South Africa 1098 (966 to 1235) 1535 (1353 to 1735) 40% (30 to 49) 4019 (3615 to 4436) 3658 (3285 to 4072) –9% (–14 to –3) Swaziland 24 (20 to 28) 37 (28 to 47) 59% (28 to 94) 5304 (4559 to 6144) 4611 (3412 to 5928) –13% (–32 to 9) Zimbabwe 250 (199 to 299) 527 (443 to 619) 112% (74 to 167) 3926 (2959 to 4644) 4708 (3957 to 5516) 21% (–1 to 59)
Western sub-Saharan
Africa 12 407 (10 421 to 14 457) 14 438 (12 137 to 17 921) 17% (–2 to 43) 6383 (5667 to 7160) 4593 (4069 to 5283) –28% (–35 to –19)
Benin 331 (272 to 405) 404 (338 to 504) 23% (–5 to 59) 6792 (6005 to 7717) 5077 (4472 to 5836) –25% (–35 to –13) Burkina Faso 708 (540 to 919) 753 (593 to 984) 8% (–21 to 47) 6909 (5850 to 8250) 4950 (4288 to 5864) –28% (–40 to –14) Cameroon 590 (484 to 741) 904 (743 to 1104) 55% (21 to 94) 5672 (4947 to 6584) 5080 (4239 to 6031) –10% (–24 to 5) Cape Verde 12 (10 to 14) 14 (11 to 16) 16% (–5 to 39) 4611 (4045 to 5223) 3332 (2825 to 3919) –28% (–37 to –17) Chad 468 (367 to 645) 715 (582 to 887) 55% (4 to 102) 7412 (6314 to 9394) 5615 (4893 to 6518) –24% (–39 to –10) Côte d’Ivoire 614 (504 to 767) 877 (746 to 1037) 44% (15 to 74) 6351 (5591 to 7151) 5587 (4919 to 6332) –12% (–22 to –1) The Gambia 41 (34 to 49) 62 (50 to 80) 51% (21 to 90) 5289 (4619 to 6041) 4396 (3764 to 5170) –17% (–27 to –5) Ghana 806 (638 to 1040) 994 (837 to 1181) 25% (–4 to 54) 7023 (6048 to 8128) 5295 (4588 to 5998) –24% (–35 to –13) Guinea 523 (409 to 669) 554 (466 to 662) 8% (–22 to 40) 8021 (6821 to 9475) 5716 (5025 to 6495) –28% (–41 to –15) Guinea-Bissau 91 (74 to 111) 95 (78 to 124) 5% (–20 to 42) 9285 (8092 to 10 686) 6834 (5896 to 8044) –26% (–38 to –13) Liberia 144 (117 to 182) 151 (124 to 199) 6% (–20 to 38) 6374 (5514 to 7319) 4774 (4159 to 5480) –25% (–36 to –14) Mali 740 (584 to 988) 724 (562 to 1023) –1% (–28 to 32) 8601 (7195 to 11 257) 5078 (4299 to 6139) –40% (–55 to –27) Mauritania 83 (68 to 111) 116 (92 to 145) 41% (9 to 77) 5869 (4959 to 7561) 4025 (3274 to 4899) –31% (–44 to –17) Niger 1206 (842 to 1637) 1034 (799 to 1400) –12% (–42 to 32) 10 905 (8469 to 14 054) 5690 (4730 to 6878) –47% (–60 to –32) Nigeria 5169 (4160 to 6399) 5931 (4606 to 8011) 16% (–13 to 58) 5493 (4743 to 6341) 3701 (3088 to 4494) –32% (–44 to –18) São Tomé and Príncipe 5 (4 to 6) 5 (4 to 6) 9% (–13 to 34) 5152 (4512 to 5833) 4219 (3562 to 4882) –18% (–31 to –5)
multiple sclerosis, and tension-type headache had
male-to-female ratios of less than 0·7 (table 1). In children
younger than 5 years, infectious neurological conditions
(ie, tetanus, meningitis, and en cephalitis), particularly
meningitis, were the main causes of neurological DALYs
in both sexes (figure 2). DALYs from epilepsy were highest
in people aged 5 years to 29 years. Migraine and
tension-type headache were large contributors in young and
middle-aged adults, with much higher numbers in
females than males. Stroke burden rapidly increased up to
the age of about 80 years, and was the dominant cause of
neurological burden between ages 60 and 84 years, more
so in males than females. Although Alzheimer’s disease
and other dementias were the dominant cause of
neurological burden from age 90 years, the global number
of DALYs from dementias was greatest between ages 80
and 89 years (figure 2).
The patterns by age of YLLs and YLDs due to
neuro-logical conditions were very different. Deaths, and by
extension YLLs, were the dominant feature of infectious
causes, stroke, Alzheimer’s disease and other dementias,
and brain and other CNS cancer, whereas the burden
estimated for headaches, TBI, and spinal cord injury were
all YLDs, because headaches are not considered an
underlying cause of death and the ICD attributes injury
deaths to the cause and not the nature of injury. Epilepsy,
stroke, and Alzheimer’s disease and other dementias
were other substantial contributors to YLDs of
neuro-logical disorders (figure 3).
Five countries had age-standardised DALY rates of
combined neurological disorders exceeding 7000 DALYs
per 100 000 population in 2016: Afghanistan (9135 DALYs
[95% UI 7788–10 709] per 100 000), Kiribati (7477 DALYs
[6596–8483] per 100 000), Solomon Islands (7104 DALYs
[6075–8391] per 100 000), Central African Republic
(7283 DALYs [5974–8644] per 100 000), and Somalia
(7349 DALYs [5980–9416] per 100 000; table 2). All of these
countries have scarce general health data, and no data for
Absolute numbers of DALYs (thousands) Age-standardised DALY rates (per 100 000 people)
1990 2016 Percentage change,
1990–2016 1990 2016 Percentage change, 1990–2016
(Continued from previous page)
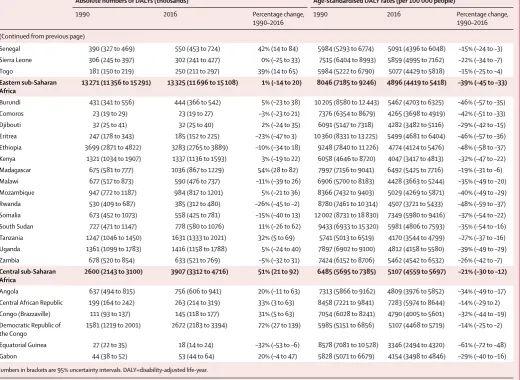
Senegal 390 (327 to 469) 550 (453 to 724) 42% (14 to 84) 5984 (5293 to 6774) 5091 (4396 to 6048) –15% (–24 to –3) Sierra Leone 306 (245 to 397) 302 (241 to 427) 0% (–25 to 33) 7515 (6404 to 8993) 5859 (4995 to 7162) –22% (–34 to –7) Togo 181 (150 to 219) 250 (211 to 297) 39% (14 to 65) 5984 (5222 to 6790) 5077 (4429 to 5818) –15% (–25 to –4)
Eastern sub-Saharan
Africa 13 271 (11 356 to 15 291) 13 325 (11 696 to 15 108) 1% (–14 to 20) 8046 (7185 to 9246) 4896 (4419 to 5418) –39% (–45 to –33)
Burundi 431 (341 to 556) 444 (366 to 542) 5% (–23 to 38) 10 205 (8580 to 12 443) 5467 (4703 to 6325) –46% (–57 to –35) Comoros 23 (19 to 29) 23 (19 to 27) –3% (–23 to 21) 7376 (6354 to 8679) 4265 (3698 to 4919) –42% (–51 to –33) Djibouti 32 (25 to 41) 32 (25 to 40) 2% (–24 to 35) 6091 (5147 to 7318) 4282 (3482 to 5116) –29% (–42 to –15) Eritrea 247 (178 to 343) 185 (152 to 225) –23% (–47 to 3) 10 360 (8331 to 13 225) 5499 (4681 to 6404) –46% (–57 to –36) Ethiopia 3699 (2871 to 4822) 3283 (2765 to 3889) –10% (–34 to 18) 9248 (7840 to 11 226) 4774 (4124 to 5476) –48% (–58 to –37) Kenya 1321 (1034 to 1907) 1337 (1136 to 1593) 3% (–19 to 22) 6058 (4646 to 8720) 4047 (3417 to 4813) –32% (–47 to –22) Madagascar 675 (581 to 777) 1036 (867 to 1229) 54% (28 to 82) 7997 (7156 to 9041) 6492 (5425 to 7716) –19% (–31 to –6) Malawi 677 (517 to 873) 590 (476 to 737) –11% (–39 to 26) 6906 (5700 to 8183) 4428 (3663 to 5244) –35% (–49 to –20) Mozambique 947 (772 to 1187) 984 (817 to 1201) 5% (–21 to 36) 8366 (7432 to 9403) 5029 (4269 to 5871) –40% (–49 to –29) Rwanda 530 (409 to 687) 385 (312 to 480) –26% (–45 to –2) 8780 (7461 to 10 314) 4507 (3721 to 5433) –48% (–59 to –37) Somalia 673 (452 to 1073) 558 (425 to 781) –15% (–40 to 13) 12 002 (8731 to 18 830) 7349 (5980 to 9416) –37% (–54 to –22) South Sudan 727 (471 to 1147) 778 (580 to 1076) 11% (–26 to 62) 9433 (6933 to 15 320) 5981 (4806 to 7593) –35% (–54 to –16) Tanzania 1247 (1046 to 1450) 1631 (1333 to 2021) 32% (5 to 69) 5741 (5013 to 6519) 4170 (3544 to 4799) –27% (–37 to –16) Uganda 1361 (1099 to 1783) 1416 (1158 to 1788) 5% (–24 to 40) 7897 (6902 to 9100) 4812 (4158 to 5580) –39% (–49 to –29) Zambia 678 (520 to 854) 633 (521 to 769) –5% (–32 to 31) 7424 (6152 to 8706) 5462 (4542 to 6532) –26% (–42 to –7)
Central sub-Saharan
Africa 2600 (2143 to 3100) 3907 (3312 to 4716) 51% (21 to 92) 6485 (5695 to 7385) 5107 (4559 to 5697) –21% (–30 to –12)
Angola 637 (494 to 815) 756 (606 to 941) 20% (–11 to 63) 7313 (5866 to 9162) 4809 (3976 to 5852) –34% (–49 to –17) Central African Republic 199 (164 to 242) 263 (214 to 319) 33% (3 to 63) 8458 (7221 to 9841) 7283 (5974 to 8644) –14% (–29 to 2) Congo (Brazzaville) 111 (93 to 137) 145 (118 to 177) 31% (5 to 63) 7054 (6028 to 8241) 4790 (4005 to 5601) –32% (–44 to –19) Democratic Republic of
the Congo 1581 (1219 to 2001) 2672 (2183 to 3394) 72% (27 to 139) 5985 (5151 to 6856) 5107 (4468 to 5719) –14% (–25 to –2) Equatorial Guinea 27 (22 to 35) 18 (14 to 24) –32% (–53 to –6) 8578 (7081 to 10 528) 3346 (2494 to 4320) –61% (–72 to –48)
Gabon 44 (38 to 52) 53 (44 to 64) 20% (–4 to 47) 5828 (5071 to 6679) 4154 (3498 to 4846) –29% (–40 to –16)
[image:12.595.38.559.138.518.2]Numbers in brackets are 95% uncertainty intervals. DALY=disability-adjusted life-year.