© 2019, IRJET | Impact Factor value: 7.211 | ISO 9001:2008 Certified Journal
| Page 7688
Parametric Study of CNC Turning Process Parameters for Surface
Roughness using ANN and GA
Mr. Ghatshile Atish Ashisharao¹, Prof. Overikar G.P², Prof. Surwase S.S³
¹PG Student, Department of Mechanical, S.T.B College of Engineering, Tuljapur, Dist.Osmanabad Maharashtra, India.
²Assistant Professor, Department of Mechanical, S.T.B College of Engineering, Tuljapur, Dist.Osmanabad,
Maharashtra, India.
³
Assistant Professor, Department of Mechanical, S.T.B College of Engineering, Tuljapur, Dist.Osmanabad,
Maharashtra, India.
---***---Abstract - Now a day’s achieving a good Surface Finish is the
main focus in the metal cutting industry during turning processes. The present work is to investigate the effect of speed, cutting speed (feed) and depth of cut in computer numeric control i.e. CNC machine. The experimental results will establish connection between speeds, feed and cutting speed and the surface roughness. Food industries use the stainless steel grade 304. So the material that will be used is SS304 and the application of it will be on shaft used for fruit pulper machine. The experimental results will be then collected and analyzed with the help of the ANN and GA. ANN and Genetic Algorithm is to be performed to find the significance of the cutting parameters on the Surface roughness. The optimal cutting parameter settings will be determined, as well as level of importance of the cutting parameters. Also ANN (Artificial Neural Networking) and GA (Genetic Algorithm) will be used to create relation between input data sets and predict the surface finish output for the given sets of inputs. So that input parameters can be decided for the requirements of different surface finishes directly. Mat lab software package will be used to perform ANN and GA analysis on the data sets.
Keywords: Stainless Steel 304 material, Surface Roughness Tester, CNC Machine, ANN, GA, Mat Lab.
1. INTRODUCTION
The surface quality is an important parameter to evaluate the productivity of machine tools as well as machined components. Hence, achieving the desired surface quality is of great importance for the functional behavior of mechanical parts. Surface roughness is used as the critical quality indicator for the machined surfaces and it affects the several properties such as wear resistance, fatigue strength, coefficient of friction, lubrication, heat transmission, wear rate and corrosion resistance of the
Machined parts today every manufacturing industry, special attention is given to dimensional accuracy and surface finish. Thus, measuring and characterizing the surface finish can be considered as a predictor for the machining performance. The
© 2019, IRJET | Impact Factor value: 7.211 | ISO 9001:2008 Certified Journal
| Page 7689
harmony search algorithm (HSA) [7] to the developedmathematical model of surface roughness based on ANN.
2. EXPERIMENTAL WORK
In the present work SS304was machined on Conventional lathe by using a Tungsten Carbide (Ti C) tool the chemical composition of SS304is given in Table-1. Full factorial design L27 (33) orthogonal array was chosen for the experimental
design. Experiments were conducted by varying the cutting parameters and the average surface roughness values (Ra) were measured by using Mituto211 Surf test with a sampling length of 5 mm. The considered cutting parameters and their level are shown in Table-2.
Component Wt. %
C Max 0.08
Cr 18 - 20
Fe 66.345 - 74
Mn Max 2
Ni 8 - 10.5
P Max 0.045
S Max 0.03
Si Max 1
Table-1: Chemical Composition of SS304
In the study, the average surface roughness (Ra) was considered. The machined surface was measured around the circumference of the work piece using the surface profilometer Surf test Mitutoyo SJ-210-P. To develop mathematical model based on ANN that relates the cutting parameters and average surface roughness (Ra), a plan of experiment is needed. The classical design of experiment (DOE) is sometimes too complex, time consuming and not easy to use. Hence, in the present investigation, the Full factorial design DOE was applied. Four cutting parameters, namely, cutting speed (s), feed rate (f), and depth of cut (d), were considered. The cutting parameter ranges were selected based on preliminary investigations and previous
Researches by the cutting parameters were arranged in standard full factorial design L27 Orthogonal Array.
Parameter Unit Levels
1 2 3
Speed RPM 1000 1250 1500
Feed mm/rev 0.1 0.2 0.3
Depth of cut mm/rev 0.1 0.2 0.3
Table-2: Cutting parameters and their levels
Machining operation is performed on the samples chosen of the standard size of 40 mm length and 32 mm diameter. Turning operation with the said input parameters in the table-2 are performed on these samples and 27 turned components are manufactured as a sample pieces to generate the data required performing ANOVA, ANN & GA. MRR can be measured by weighing the component before and after the machining operation performed, and dividing it with the number of minutes taken by the turning operation on that component. Table-3 shows all the measured MRR values for 27 experiments.
Sr.No. SPEED FEED DEPTH OF CUT MRR
1 1000 0.1 0.1 0.63
2 1000 0.2 0.1 1.26
3 1000 0.3 0.1 1.88
4 1000 0.1 0.2 1.26
5 1000 0.2 0.2 2.51
6 1000 0.3 0.2 3.77
7 1000 0.1 0.3 1.88
8 1000 0.2 0.3 3.77
9 1000 0.3 0.3 5.65
10 1250 0.1 0.1 0.79
11 1250 0.2 0.1 1.57
12 1250 0.3 0.1 2.36
13 1250 0.1 0.2 1.57
14 1250 0.2 0.2 3.14
15 1250 0.3 0.2 4.71
16 1250 0.1 0.3 2.36
17 1250 0.2 0.3 4.71
18 1250 0.3 0.3 7.07
19 1500 0.1 0.1 0.94
20 1500 0.2 0.1 1.88
21 1500 0.3 0.1 2.83
22 1500 0.1 0.2 1.88
23 1500 0.2 0.2 3.77
24 1500 0.3 0.2 5.65
25 1500 0.1 0.3 2.83
26 1500 0.2 0.3 5.65
27 1500 0.3 0.3 8.48
Table-3: Cutting parameters and their levels
2.1 Visual or Tactual
© 2019, IRJET | Impact Factor value: 7.211 | ISO 9001:2008 Certified Journal
| Page 7690
without a magnifier, are placed adjacent to the work pieceunder examination and the surfaces are compared visibly or tactually by drawing the tip of the fingernail across each at right angles to the tool marks. The fingernail touch or "feel" will be the same when both finishes are identical. In this case we have used the electronic measuring instrument and results for the all 27 components are shown in the table-4 below.
Fig: 2.1 Measurement of the Surface roughness for components
Sr. No. Ra
1 1.552
2 3.83
3 4.905
4 2.47
5 3.564
6 2.795
7 1.272
8 3.07
9 4.091
10 1.7
11 1.415
12 3.936
13 2.216
14 2.98
15 3.783
16 2.056
17 3.276
18 4.954
19 2.021
20 1.998
21 1.2
22 2.397
23 2.738
24 2.946
25 2.559
26 1.803
27 3.425
Table-4: Experimental Ra values
3. ANALYSIS OF VARIANCE (ANOVA) S/N ANALYSIS
The S/N ratio is a concurrent quality metric linked to the loss function (Barker, 1990). By maximizing the S/N ratio, the loss associated can be minimized. The S/N ratio determines the most robust set of operating conditions from variation within the results. The S/N ratio is treated as a response (transform of raw data) of the experiment. In the present investigation, the S/N data analysis has been performed. The effects of the selected turning process parameters on the selected quality characteristics have been investigated through the plots of the main effects based on raw data. The optimum condition for each of the quality characteristics has been established through S/N data analysis aided by the raw data analysis. Taguchi recommends the use of the loss function to measure the performance characteristic deviating from the desired value. The rationale for this switch over to S/N ratios instead of working directly with the quality characteristic measurement is, the S/N ratio is a concurrent statistic –a special kind of data summery. A concurrent statistic is able to look at two or more characteristics of distribution and roll these characteristic into a single number or figure of merit. Usually, there are three categories of performance characteristic in the analysis of the S/N ratio. The loss function for the lower gives better performance characteristic and can be expressed as
∑
Where Lij is the loss function of the ith performance
characteristic in the jth experiment,
yijk the experimental value of the ith performance
characteristic in the jth experiment at the kth trial, and
n the number of trials.
The loss function is further transformed into an S/N ratio. In the Taguchi method, the S/N ratio is used to determine the deviation of the performance characteristic from the desired value. The S/N ratio Lij for the ith performance characteristic in
the jth experiment can be expressed as
Sr.no. SPEED FEED DEPTH OF
CUT Ra
Calculated S/N ratio
(db.)
1 1000 0.1 0.1 1.552 3.81783
2 1000 0.2 0.1 3.83 11.664
3 1000 0.3 0.1 4.905 13.8128
4 1000 0.1 0.2 2.47 7.85394
5 1000 0.2 0.2 3.564 11.0388
6 1000 0.3 0.2 2.795 8.92764
7 1000 0.1 0.3 1.272 2.08974
© 2019, IRJET | Impact Factor value: 7.211 | ISO 9001:2008 Certified Journal
| Page 7691
9 1000 0.3 0.3 4.091 12.2366
10 1250 0.1 0.1 1.7 4.60898
11 1250 0.2 0.1 1.415 3.01513
12 1250 0.3 0.1 3.936 11.9011
13 1250 0.1 0.2 2.216 6.9114
14 1250 0.2 0.2 2.98 9.48433
15 1250 0.3 0.2 3.783 11.5567
16 1250 0.1 0.3 2.056 6.26046
17 1250 0.2 0.3 3.276 10.3069
18 1250 0.3 0.3 4.954 13.8991
19 1500 0.1 0.1 2.021 6.11133
20 1500 0.2 0.1 1.998 6.01191
21 1500 0.3 0.1 1.2 1.58362
22 1500 0.1 0.2 2.397 7.59336
23 1500 0.2 0.2 2.738 8.74867
24 1500 0.3 0.2 2.946 9.38465
25 1500 0.1 0.3 2.559 8.16141
26 1500 0.2 0.3 1.803 5.11991
27 1500 0.3 0.3 3.425 10.6932
Table-5: The experimental results for surface roughness and its S/N ratio.
Results for the ANOVA performed using Minitab are given in the figures 3.1 shown below. They show the effect of the inputs on the output.
Fig-3.1: Main effect plots for work-piece surface roughness Ra (μm)
The main effect plot for the three different surface parameters Ra has been shown in figure 4.1. Figure 3.1 shows the main effect plot for work-piece surface roughness Ra for spindle speed, feed rate and depth of cut. Figure 3.2 shows the
main effect plot for work-piece MRR for spindle speed, feed rate and depth of cut.
Fig-3.2: Main effect plots for work-piece MRR
Table-6: ANOVA result for work piece surface roughness
The high value of spindle speed, feed rate and depth of cut give high value of Material Removal Rate, i.e. high production rate. It was observed that the maximum MRR is obtained at the spindle speed 1500 RPM, 0.3 mm/rev of feed and 0.3 mm depth of cut.
Sourc e
Deg ree of free do m
Su m of Squ are
Vari anc e
F rat io P
%
Contributio n
Spindl e
Speed 2 7.1
06 3.553 7.13 0.005 6.710
Feed 2 44.41 3
22.2
07 44.55 0.000 41.938
Cut 2 44.41 3
22.2
07 44.55 0.000 41.938
Error 20 9.968 0.498 9.412
© 2019, IRJET | Impact Factor value: 7.211 | ISO 9001:2008 Certified Journal
| Page 7692
Table-7: ANOVA result for work piece MRR cc/mi4. ARTIFICIAL NEURAL NETWORKING
Backpropagation Algorithm:-
A key trigger for renewed interest in neural networks and learning was Werbos's (1975) backpropagation algorithm that effectively solved the exclusive-or problem by making the training of multi-layer networks feasible and efficient. Backpropagation distributed the error term back up through the layers, by modifying the weights at each node. In the mid-1980s, parallel distributed processing became popular under the name connectionism. Rumelhart and McClelland (1986) described the use of connectionism to simulate neural processes.
Fig-4.1: Backpropagation algorithm
Data of inputs and output of Surface finish is inputted to the MATLAB for all the 27 tests ran on the process. Data is been
input by transposing it as ANN considers ever row as a parameter by default.
Sample data for inputs of 1 to 15 is also provided in the sample space for which results will be predicted. Set of sample data is shown in the figure 4.2 below.
Fig-4.2: Sample data set variable
After that new network is created using input and target data with the settings as shown in below fig. 4.3, also hidden layer number of neurons is selected as 8. For selecting no of hidden neurons we takes different neuron sets such as 4, 6, 8 with respect to experimental data sets 1-15, 7-21, 13-27. We find less % of error from the 8 no of hidden neurons so we selecting the 8 no of hidden neurons.
Fig-4.3: Hidden layer number of neurons.
After the network definition training info and parameters are set and training is done multiple times by checking the regression line values being within the acceptable limits.
Fig-4.4: Regression plot for the training of ANN Sour
ce
Degre e of freed om
Sum of Square Variance
F rat io P
% Contrib ution Spin
dle Spee d
2 2.6156 1.3078 1.84 0.185 29.203
Feed 2 10.583 5.2919 7.44 0.004 37.241
Cut 2 1.0029 0.5014 0.71 0.506 23.528
Erro
r 20 14.217 0.7109 10.026
Tota
© 2019, IRJET | Impact Factor value: 7.211 | ISO 9001:2008 Certified Journal
| Page 7693
Table-8: ANN output prediction of the surface roughnessTable shows the ANN output prediction of the surface roughness for all the observations we have performed testing on. Error Histogram is shown in the table 8 above. All the ANN readings predicted via software are close to the actual measured targets provided to the algorithm. Maximum error found during ANN is around 9 % which is within acceptance criteria of 10 % error.
The neural network has been designed with MATLAB 7.1 software. The back propagation algorithm is a gradient decent error-correcting algorithm
5. GENETIC ALGORITHM
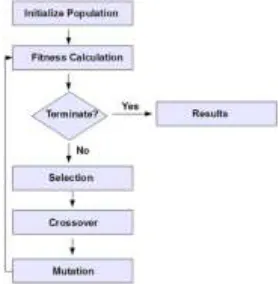
The following outline summarizes how the genetic algorithm works:
1. The algorithm begins by creating a random initial population.
2. The algorithm then creates a sequence of new populations. At each step, the algorithm uses the individuals in the current
[image:6.612.377.516.125.267.2]generation to create the next population. To create the new population, the algorithm performs the following steps:
Fig-5.1: Steps in genetic algorithm
a. Scores each member of the current population by computing its fitness value. These values are called the raw fitness scores.
b. Scales the raw fitness scores to convert them into a more usable range of values. These scaled values are called expectation values.
c. Selects members, called parents, based on their expectation.
d. Some of the individuals in the current population that have lower fitness are chosen as elite. These elite individuals are passed to the next population.
e. Produces children from the parents. Children are produced either by making random changes to a single parent—mutation—or by combining the vector entries of a pair of parents—crossover.
[image:6.612.328.557.509.691.2]f. Replaces the current population with the children to form the next generation.
Fig-5.2: Population toolbox for GA
SPEED FEED
DEPTH OF CUT
Surface Roughnes
s SS ANN Error
1000 0.1 0.1 1.55 1.49 4%
1000 0.2 0.1 3.83 3.83 0%
1000 0.3 0.1 4.91 4.50 8%
1000 0.1 0.2 2.47 2.34 5%
1000 0.2 0.2 3.56 3.42 4%
1000 0.3 0.2 2.8 3.05 -9%
1000 0.1 0.3 1.27 1.35 -6%
1000 0.2 0.3 3.07 3.30 -7%
1000 0.3 0.3 4.09 4.10 0%
1250 0.1 0.1 1.7 1.66 3%
1250 0.2 0.1 1.42 1.44 -1%
1250 0.3 0.1 3.94 3.60 9%
1250 0.1 0.2 2.22 2.16 3%
1250 0.2 0.2 2.98 2.95 1%
1250 0.3 0.2 3.78 3.82 -1%
1250 0.1 0.3 2.06 2.06 0%
1250 0.2 0.3 3.28 3.18 3%
1250 0.3 0.3 4.95 4.94 0%
1500 0.1 0.1 2.02 1.97 2%
1500 0.2 0.1 2 1.94 3%
1500 0.3 0.1 1.2 1.30 -8%
1500 0.1 0.2 2.4 2.31 4%
1500 0.2 0.2 2.74 2.85 -4%
1500 0.3 0.2 2.95 2.87 3%
1500 0.1 0.3 2.56 2.58 -1%
1500 0.2 0.3 1.8 1.82 -1%
© 2019, IRJET | Impact Factor value: 7.211 | ISO 9001:2008 Certified Journal
| Page 7694
Fig-5.3: Maximum constraint plotFig-5.4: Score diversity plot
Sr.No. SPEED FEED DEPTH OF
CUT Ra GA
1 1000 0.1 0.1 1.552 1.822
2 1000 0.2 0.1 3.83 3.943
3 1000 0.3 0.1 4.905 4.99
4 1000 0.1 0.2 2.47 2.88
5 1000 0.2 0.2 3.564 3.987
6 1000 0.3 0.2 2.795 2.995
7 1000 0.1 0.3 1.272 1.322
8 1000 0.2 0.3 3.07 3.50
9 1000 0.3 0.3 4.091 4.291
10 1250 0.1 0.1 1.7 1.8
11 1250 0.2 0.1 1.415 1.545
12 1250 0.3 0.1 3.936 3.99
13 1250 0.1 0.2 2.216 2.88
14 1250 0.2 0.2 2.98 3.845
15 1250 0.3 0.2 3.783 3.983
16 1250 0.1 0.3 2.056 2.556
17 1250 0.2 0.3 3.276 3.576
18 1250 0.3 0.3 4.954 5.054
19 1500 0.1 0.1 2.021 2.521
20 1500 0.2 0.1 1.998 1.998
21 1500 0.3 0.1 1.2 1.321
22 1500 0.1 0.2 2.397 2.597
23 1500 0.2 0.2 2.738 2.938
24 1500 0.3 0.2 2.946 2.99
25 1500 0.1 0.3 2.559 2.789
26 1500 0.2 0.3 1.803 1.903
27 1500 0.3 0.3 3.425 3.725
Table-9: GA output prediction of the surface roughness
6. CONCLUSIONS
The results show that with the increase in spindle speed, feed rate and depth of cut there was a continuous increase in Material Removal Rate.
The results show that with the increase in spindle speed there is improve in surface roughness value up-to 1500 RPM. In the figure 3.1 the optimum value for speed 1350 for feed was 0.20 mm/rev and for depth of cut was 0.1 mm.
In the present work has been made to find a technique for optimizing machining parameter that could yield minimum machining time at the same time maintaining the desired surface roughness and MRR. Surface roughness and MRR value confidence level for the adequacy process occurs at cutting speed of 1500rpm, feed rate of 0.3mm/rev and depth of cut 0.1mm/rev is 1.20μm and 2.83cc/min respectively. Similarly the ANN and GA optimization technique find out same valve of cutting parameter with better surface finish 1.30μm and 1.32μm respectively. Artificial neural networking is successfully optimize and implied to the model and results of the surface finish predicted by ANN relation are in conformance with the observations made by actual testing with the error of maximum 9 %.
Method Surface roughness (Ra) Error (%)
ANOVA 2.78 6.474
ANN 2.64 1.5151
GA 2.90 10.3448
Practical 2.60 -
Table-10: Result Summery
REFERENCES
1. Isratsharmin, Rafathsharmin, N.R. Dhar “Prediction of Surface Roughness using an Artificial Neural Network in Turning Al based Metal Matrix Composite with coated carbide insert” International Journal of Scientific & Engineering Research, Volume 8, Issue 5, May-2017 ISSN 2229-5518
2. Vijay A. Bhagora, Modelling and Optimization of Process Parameters for Turning Operation on CNC Lathe for ASTM A242 Type-2 Alloy Steel by Artificial Neural Network and Regression Analysis – A Review Paper”, IJIRST –International Journal for Innovative Research in Science & Technology, Volume 1, Issue 10, March 2015 ISSN (online): 2349-6010.
© 2019, IRJET | Impact Factor value: 7.211 | ISO 9001:2008 Certified Journal
| Page 7695
of Engineering Trends and Technology (IJETT) –Volume 5 Number 6 – Nov 2013ISSN: 2231-5381
4. Adnan Jameel, Mohamad Minhat , Md. Nizam “Using Genetic Algorithm to Genetic Optimize Machining Parameters in Parameters in Parameters in Turning Operation: A review” International Journal of Scientific and Research Publications, Volume 3, Issue 5, May 2013 ISSN 2250-3153
5. P. P. Shirpurkar, S. R. Bobde, V. V. Patil, B.N. Kale “Optimization of Turning Process Parameters by Using Tool Inserts- A Review” ISSN: 2277-3754 ISO 9001:2008 Certified International Journal of Engineering and Innovative Technology (IJEIT) Volume 2, Issue 6, December 2012
6. Poornima, Sukumar “OPTIMIZATION OF MACHINING PARAMETERS IN CNC TURNING OF MARTENSITIC STAINLESS STEEL USING RSM AND GA” International Journal of Modern Engineering Research (IJMER) Vol.2, Issue.2, Mar.-Apr. 2012 pp-539-542 ISSN: 2249-6645 7. Sahoo, P. “Optimization Of Turning Parameters For
Surface Roughness Using Rsm And Ga” Advances in Production Engineering & Management 6 (2011) 3, 197-208 ISSN 1854-6250
8. Vinoth Kumar S. , Dilip Jerold B., Dhananchezian M. , Pradeep Kumar M. “Application Of ANN To Investigate The Turning Of AISI 316 Stainless Steel” National Conference on Recent Innovations in Production Engineering RIPE – 2010
9. Chen Lu, Ning Ma, Zhuo Chen, Jean-Philippe Costes “Pre-evaluation on surface profile in turning process based on cutting parameters” HAL-01090941 Jan 2015 10. Komson Jirapattarasilpa and Choobunyen Kuptanawin,
“Effect of Turning Parameters on Roundness and Hardness of Stainless Steel: SUS 303”, Science Direct, 2012 AASRI Conference on Modelling, Identification and Control.
11. Puneet Kumar, Ashwani Kumar Dhingra and Pankaj Kumar, “Optimization Of Process Parameters For Machining Of Mild Steel En18 By Response Surface Methodology”, Advances in Engineering: an International Journal (ADEIJ), Vol. 1, No.1, September 2016.
12. Wahida Nawrinet. al., “Optimization of Process Parameters for Turning of Mild Steel in Minimum Quantity Lubrication (MQL)”, International Journal of Modern Research in Engineering and Technology (IJMRET), Volume 1, Issue 2, July 2016.
13. Carmita Camposeco-Negrete, “Optimization of cutting parameters for minimizing energy consumption in turning of AISI 6061 T6 using Taguchi methodology and
ANOVA”, Elsevier,
doi.org/10.1016/j.jclepro.2013.03.049
14. K. Manilavanya, ET. al. “Optimization of Process Parameters in Turning Operation of AISI-1016 Alloy Steels with CBN Using Taguchi Method and Anova” IOSR Journal of Mechanical and Civil Engineering (IOSR-JMCE) e-ISSN: 2278-1684, p-ISSN: 2320-334X, Volume 7, Issue 2 (May. - Jun. 2013), PP 24-27.
15. Prajwalkumar M. Patil, Rajendrakumar V. Kadi, Dr. Suresh T. Dundur, Anil S. “Effect of Cutting Parameters on Surface Quality of AISI 316 Austenitic Stainless Steel in CNC Turning” International Research Journal of Engineering and Technology (IRJET) e-ISSN: 0056 Volume: 02 Issue: 04 | July-2015 p-ISSN: 2395-0072
16. Cebeli ÖZEK, Ahmet HASÇALIK, Ulaş ÇAYDAŞ, Faruk KARACA, Engin ÜNAL “TURNING OF AISI 304 AUSTENITIC STAINLESS STEEL” Journal of Engineering and Natural Sciences, 2006
17. M. Kaladhar K. Venkata Subbaiah and C. H. Srinivasa Rao “Machining of austenitic stainless steels – a review” Int. J. Machining and Machinability of Materials, Vol. 12, Nos. 1/2, 2012
18. M. Kaladhar, K. Venkata Subbaiah, Ch. Srinivasa Rao and K. Narayana Rao “OPTIMIZATION OF PROCESS PARAMETERS IN TURNING OF AISI202 AUSTENITIC STAINLESS STEEL” VOL. 5, NO. 9, SEPTEMBER 2010 ISSN 1819-6608 ARPN Journal of Engineering and Applied Sciences
19. Sayak Mukherjeea, Anurag Kamala and Kaushik Kumar “Optimization of Material Removal Rate During Turning of SAE 1020 Material in CNC Lathe using Taguchi Technique” 12th Global Congress On Manufacturing And Management, GCMM 2014.
20. G.MOHANKUMAR, K.GANESAN, K.RAMESH KUMAR “Optimization of machining parameters in turning process using genetic algorithm and particle swarm optimization with experimental verification” International Journal of Engineering Science and Technology Vol. 3 No. 2 Feb 2011.
21. M. Ay “Optimization of Machining Parameters in Turning AISI 304L Stainless Steel by the Grey-Based Taguchi Method” Article in Acta Physica Polonica Series a · March 2017
22. V S Thangarasu and R Sivasubramania “High speed cnc machining of aisi 304 stainless steel; optimization of process parameters”