The Social Costs of Crime and Crime Control
Klara Kerezsi*, József Kó, Szilvia Antal
National Institute of Criminology, Budapest, Hungary. Email: kerezsi@okri.hu; ko@okri.hu; antal@okri.hu
Received February 28th, 2011; Revised May 11th, 2011; Accepted May 18th, 2011.
ABSTRACT
There is currently no generally accepted method of estimating the costs of crime. After presenting the most commonly used methods of estimating crime, the authors attempt to explore the situation in Hungary. Taking 2009 as a base year, they recon the crime-related social expenditure accounts. The authors, with the help of other Hungarian research data and databases, have also taken into account the costs of the secondary social effects. The results of the calculations depend on the applied approach to crime and the interpretations of the social impacts of the delinquency. According to the authors calculations the social cost caused by crime was about 2.17 billion USA dollar:($) (1.6 billion euro (EUR) in 2009. The authors deduct the sum that was drawn by the offenders as a benefit/profit from committing crime; there-fore the crime caused 1.17 billion $ as a net social damage in 2009 in Hungary. The amount of 1.63 billion $ was spent on the crime control (e.g. law enforcement, judiciary, prison and crime prevention) in 2009. The results show that de-linquency caused a total of 3.8 billion $ as a damage, or as an expenditure spent by the government in 2009. The cost of crime control was about 500 million $ higher (1.63 billion $) than the amount of damage caused by crime (1.17 billion $). The offenders benefit/profit from committing crime (= 1 billion $) was only 15% less than the damage they caused to the state and to the citizens (= 1.17 billion $). In other words, the half of the criminal damage shall never be repaid: it will remain at the criminals!
Keywords: Cost of Crime, Victimization Costs, Methodology
1. Introduction
The concept of crime embraces an extremely diverse range of activities. Even as regards the functioning of society and the economy there may be differing conse-quences from specific types of criminal acts. The taking of a life is clearly an irreplaceable loss not only for the individual, but also for society. Where offences against property are concerned the situation is not so obvious. If somebody steals or embezzles somebody else’s money, or robs them of their possessions through the use of force, then the victim suffers an unquestionable loss, which is often far greater than the value of the property lost during the crime. For society as a whole, however, the loss of one member of society is a significant gain for another one of its members. Damage beyond the particular mate-rial losses is also caused by an increase in crime. If the state is unable to guarantee protection for possessions that people own, if they can be taken away from them at any time by using force or other illegal means, then peo-ple lose their motivation for acquiring assets.
If more and more economic players, instead of
choos-ing market solutions, opt for illegal solutions, which promise similar or even greater profits, then the well- being of society may be drastically reduced. Market eva-sion and the illegal transfer of wealth is not effective in the economic sense that there is no increase in economic productivity; on the contrary, there is a reduction in so-cial prosperity, in spite of the resulting visible wealth that some individuals who choose the illegal path may enjoy. It is therefore in the fundamental interests of societies, or rather, of the state, to make a separation between legal market behaviour, which brings economic benefits, and illegal solutions, which serve merely the transfer of wealth. It is therefore reasonable for a society to pass laws which punish bad behaviour, and to operate a justice system to enforce these laws, even if this incurs signifi-cant costs.
It is precisely these costs and expenditures which we investigated in our analysis. We were interested in find-ing out what the costs of crime are to the community, at a social level. We employed a dual approach:
1) As a first step we sought to define the damage caused by crime;
2) In the second phase we attempted to summarise the
social outlay spent on eliminating crime and keeping it under control.
2. Calculating the Costs of Crime
International practice shows that there are serious differ-ences among various countries in the way the costs of crime are calculated, and even the American and the British measuring techniques are different from each other [1].1
Knowledge of the methods used for estimating the costs of crime is important for scientific experts and for those working in the field. In its consideration of crime- related costs, this overview starts takes the costs of tradi-tional “street” crime as its starting point, and does not focus on costs related to white-collar crime or organised crime.
Crime-related costs can be systemised in different ways. Regarding where the costs arise, we make a dis-tinction between (1) costs affecting the victim (such as lost income, medical costs, pain and suffering) and (2) costs affecting the system of government (such as the costs of organising the police and criminal justice ser-vices).
The repercussions of crime do not, however, only concern the victims and the system of government, but also have an impact on numerous other segments of soci-ety.
The professional literatures on the econometrics of crime traditionally make a distinction between three types of costs [2]:
(1) The direct costs caused by the criminal offence (such as external2 costs caused by the perpetrator);
(2) Costs related to the reaction to crime (which target the suppression of crime, future crime prevention, or spe-cific punishments);
(3) Costs incurred by the perpetrator (such as the costs of the perpetrator’s time, in other words the time spent on criminal activity instead of on work or some other kind of productive activity).
Cohen and Bowles [3], in answer to the question “Who bears the costs?”, make a distinction between three cate-gories of costs: the costs of (1) foresight, (2) conse-quences and (3) reactions to crime.
Arising costs are grouped in the following way by
Cohen [4]:
(1) Victimisation costs (including losses of cash, pain, suffering and a lowering of the quality of life);
(2) Crime prevention outlay by individuals and com-panies;
(3) Changes in human behaviour (such as the devel-opment of individual avoidance behaviour);
(4) The costs of the criminal justice service system; (5) Governmental prevention and rehabilitation pro-grams;
(6) Residual effects for the individual (such as a fear of crime);
(7) Residual effects for the community (such as the loss of a tax payer);
(8) Costs of overinsurance (such as non-provision of an activity not undertaken by innocent people for fear of being accused of committing a crime);
(9) The demonstrative costs of “serving justice” (such as costs that arise in order to show clearly that justice is “at your service” but are regardless to e.g. cost-benefit aspects);
(10) The burdens that arise on the side of the perpetra-tor and their family.
Methods of Estimating Costs
According to sources in the professional literature there are two approaches to calculating the costs of crime:
1) The one most generally applied to this day is the “bottom-up” method of estimation, where estimates are based on the costs of crime incurring by single individu-als. The “bottom-up” approach is used in the Home Of-fice, where the British Crime Survey (BCS), the annually repeated victim study, estimates the costs of victimisation on the basis of answers to the survey’s questions. For this method of calculation it is naturally essential to have regularly repeated victim surveys [5].3 Research shows that the number of crimes against natural persons of adult age and against households is four times greater than the number reported to the police. Besides the BCS the number of victims in the business sphere is measured regularly using the Commercial Victimisation Survey.
The “bottom-up” method of calculation takes the fol-lowing costs into account:
(1) Costs incurred by the victim; (2) Costs of avoiding victimisation; (3) Community expenses;
1In Australia, Canada, the Netherlands and the USA, crime-related expenditure exceeds 5% of annual GDP. The price of crime and its costs to society are therefore earning increasing attention when restruc-turing the criminal justice services and when defining the direction of criminal policy. Decision makers also need to be aware of how the consequences and the damage caused by crime compare with the amounts that are spent on dealing with crime.
2In the economics, the term externality (external economic effect) for effects (benefits or costs)—that may be connected to production or consumption—incurring by those without pursuit of those. External cost is made by the difference of social and individual marginal cost.
(4) Costs of the fear of crime;
(5) Costs of the criminal justice service;
(6) Costs arising on the side of the perpetrator.
The correlation and interpretation of the large amount of data and the cost-implications by each single element of the above categories present significant difficulties.
2) The other possible approach is the elaboration of “top-down” estimation. There are typically two solutions applied with this method of calculation:
(1) Using the available macroeconomic indices, or the budgetary data and institutional expenses, to calculate the social costs of crime;
(2) Based on a survey of the population, calculating the “price” of crime by including every expense that the population is ready or willing to pay for reduced crime.
There are also several approaches to employing this latter method:
1) One method of calculation takes actual market prices as its basis, and concentrates on changes in the value of assets caused by the frequency of crime. This is what a house-buyer takes into consideration when they account for the possible risk of victimisation in an area where property prices are cheaper.
2) With the second method, respondents are asked to evaluate public wealth in a subjective way. Typically, population surveys are used to estimate how much people are willing to pay to avoid victimisation.
3) A relatively new approach for calculating the price of crime is when the costs of crime are assumed on the basis of satisfaction with life. The survey does not ask for an evaluation but for the subjective opinion of how satisfied the respondent is with their life. This calculation is a me-thod suitable for individual evaluation of the feeling of security in connection with the crime situation.
3. The Costs of Crime in Hungary
There follows an experiment to estimate the costs of crime in Hungary. Since there is no annual (or at least regularly conducted) survey of the frequency of victimi-sation, we are unable to use the “bottom-up” method of calculation. We encountered, however, several stumbling blocks concerning the “top-down” method of calculation when gathering the data required for making the calcula-tion. Not all the data required for making the calculation are available, or they are not collected in a format or to the level of detail in domestic statistical systems that they should have been.
We have indicated the missing elements in our calcula-tion. To estimate the damage caused by criminal offences we used the data from the Unified Criminal Statistics of the Investigative Authority and the Public Prosecutor (UCS) for the year 2009 as our starting point. These data do not correspond precisely with the calendar year, as 43% of the offences contained in the UCS statistics were not committed in the given year. Data for a given
calen-dar year only become “complete” after about 4-5 years. In spite of this we rejected the possibility of performing a calculation using the “complete” data of an earlier year, because in the year 2010, data that refer to a year 4 or 5 years ago are not so informative.
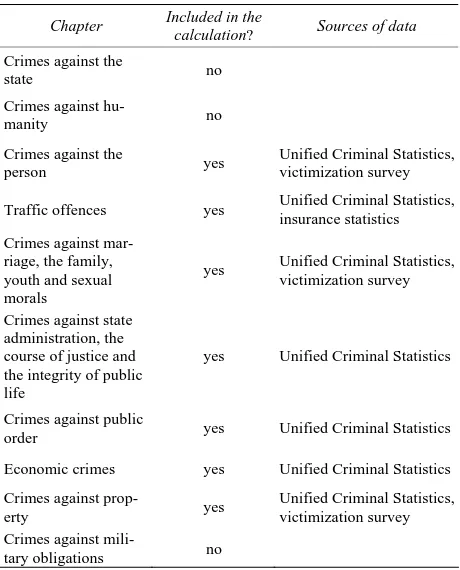
In the case of offences for which Unified Criminal Sta-tistics does not record a value for the damage we relied primarily on the results of victimological studies that were conducted in the past, but for preparing the analysis we also utilised data from other registers (such as insur-ance statistics and social insurinsur-ance registers). Some of-fences were not considered, either because their effect is negligible or because there is no reliable information about the damage caused by these offences. Table 1 pro-vides an overview of the data sources and the groups of crimes taken into account.
3.1. Calculating the Damage Caused by Crime
1) Damage recorded in the Unified Criminal Statistics C1 = Dr – Hrp (1)
where:
C1 = the amount of damage caused by crime;
Dr = recorded damage (the amount of damage caused
by crimes, for which the value of the damage is recorded in the Unified Criminal Statistics);
[image:3.595.308.538.437.722.2]Hrp = repaid harm (the value of repaid harm registered
Table 1. Data sources and the groups of crimes taken into account.
Chapter Included in the
calculation? Sources of data
Crimes against the
state no
Crimes against
hu-manity no
Crimes against the
person yes
Unified Criminal Statistics, victimization survey
Traffic offences yes Unified Criminal Statistics, insurance statistics Crimes against
mar-riage, the family, youth and sexual morals
yes Unified Criminal Statistics, victimization survey
Crimes against state administration, the course of justice and the integrity of public life
yes Unified Criminal Statistics
Crimes against public
order yes Unified Criminal Statistics
Economic crimes yes Unified Criminal Statistics
Crimes against
prop-erty yes
Unified Criminal Statistics, victimization survey Crimes against
in the Unified Criminal Statistics).
The Unified Criminal Statistics collects data on the amount of damage caused by crimes in four categories of crime (crimes against property, economic crimes, crimes against state administration and those against public or-der). The reliability and validity of the collected data dif-fer. The value of damage registered for crimes against property is regularly below the actual damage caused. If somebody has their purse or wallet stolen, together with their documents and other personal effects, the report regularly only includes the value of the purse or wallet and the money inside it as damage. The costs of replacing the documents (charges, time, travel expenses) or, for example, changing the locks of the house if the key was in the bag, are not included in the statistics. In summary, the statistics for crimes against property underestimate the amount of material damage caused.
In the international literature it is becoming increas-ingly clear that so-called moral or emotional damage should also be accounted for in the costs of crime. This covers all the emotional and mental injuries, and the changes that take place in the way of life as a conse-quence of these, which can be considered as resulting from a crime. The costs of psychological and emotional support and care in the face of a crime are the costs that are most frequently included.
Hungarian statistics do not include any damage other than material harm. There is no tradition of this type of calculation in Hungarian practice, so we were also unable to take these into consideration. Nevertheless we must note that economists do work with some similar index when calculating national welfare indices (such as the Index of Sustainable Economic Welfare [ISEW]), where the fall in general well-being that is attributable to crime is assessed as an emotional burden. No valid research has yet been carried out, however, in connection with pro-viding actual figures.
There is a problem as regards registration; in that data is only included in the Unified Criminal Statistics after the investigation has closed. In instances where the per-petrator was not found, the value of the damage enters the statistics at the amount determined by the investigative profession, and in instances where the perpetrator is known, the amount registered is the one that appears on the indictment, although if this is later amended during the judicial process there is no subsequent follow-up in the register. In summary we are able to state that in cases where the perpetrator is known the statistics show a lar-ger amount of damage than that established in final court judgments. In cases where it was not possible to identify the perpetrator, it is normal to determine the amount in a more simplified process (with the involvement of fewer experts), so we necessarily have to reckon with a degree
of uncertainty in such cases.
For all types of crime we have deducted the value of repaid harm indicated in the register from the value of the damage caused. The values that form the basis of the calculation are summarised in the Table 2.
Based on the data recorded in the Unified Criminal Statistics, the amount of damage caused by these crimes in 2009 was:
C1 = 573.5 – 52 = 521.5 million $
2) Correction of the amount of damage recorded in the Unified Criminal Statistics
C2 = Dr * Corr – Hrp (2)
where:
C2 = the amount of damage caused by crime;
Dr = recorded damage (the amount of damage caused
by crimes, for which the value of the damage is recorded in the Unified Criminal Statistics);
Hrp = repaid harm (the value of repaid harm registered
in the Unified Criminal Statistics).
In determining the correction factor we relied on the results of our previous research. The research was con-ducted earlier, but we have no reason to assume that there have been since then any significant shifts in the adjust-ment in the area under investigation, therefore we sider the earlier results to form the basis of relevant con-clusions on the relationship between the actual value of damage and that recorded in the system of statistics. The nationwide victimology research carried out in 2003 [6] by the National Institute of Criminology (OKRI) involv-ing a representative sample of 10,000 people is consid-ered to be the most important source. Among the ques-tions were those evaluating the damage caused to victims. The questions on damage were put not only with regard to crimes against property but in every case.
However, when determining the correction factor K1,
[image:4.595.324.523.558.722.2]only the values for crimes against property were reck-
Table 2. The basis of calculating the costs of crime.
Damage caused ($)
Compensated damage ($)
Crimes against
property 508,285,572 37,194,904
Economic crimes 207,879,145 15,059,929
Crimes against state administra-tion, the course of justice and the integrity of public life
5,775,024 3,035,835
Crimes against
public order 1.506.965 15.850
oned with. This was necessary because the Ve index does not include a value for damage arising from crimes against the person.
The following procedure was followed in determining correction factor K1. For the purpose of comparison we
used the crime statistics for 2003, the time when the vic-timology questionnaires were completed. As a first step we separated the damage resulting from offences com-mitted against natural persons from the Unified Criminal Statistics data. This was necessary because we were only able to examine crimes against natural persons during the victimological study. We also filtered out from the victi-mological survey data those cases where the respondents themselves admitted they had not reported the crime. Only data relating to reported cases can be compared with the data of the official crime statistics. Following this separation we calculated the value of damage per criminal offence in both databases (the victimological survey and the Unified Criminal Statistics data). The dif-ference between the two average figures provides the value of the correction factor, which in this case was 1.17. As far as present knowledge is available, the best ap-proximation of the value of K1 is as follows:
Corr = 1.17
C2 = (573.5 * 1.17) – 52 = 619 million $
3) Estimation of the value of damage resulting from crimes for which there is no recorded damage in the Uni-fied Criminal Statistics
C3 = Dr * Corr – Hrp + Dunr (3)
where:
Dr = recorded damage by the Unified Criminal
Statis-tics;
Corr = correction factor, to adjust the value shown in the Unified Criminal Statistics to the actual amount of damage caused;
Hrp = the value of repaid harm registered in the Unified
Criminal Statistics;
Dunr = unregistered damage (the amount of material
damage caused by crimes for which there is no recorded damage in the Unified Criminal Statistics).
This type of damage must be split into two groups: (1) The first group covers the material damage that was caused. One part of these relates directly to the criminal offence, for example if, during an attack of grievous bod-ily harm the victim’s mobile phone gets damaged beyond repair, and the other part represents costs that arise as a consequence of the offence, such as hospital treatment, or in extreme cases, the costs of a funeral;
(2) The second group includes costs which do not rep-resent direct expenses, but which should definitely be
taken into consideration as social costs. The loss of a life, for example, in addition to the individual tragedy, may also represent a loss for society as it has been forced to part with a productive member of society (depending on the age of the victim). Time taken off work is also con-sidered as a loss and a cost from society's point of view. For every crime that involves a personal injury, therefore, we need to calculate the cost which depends on the sever-ity of the injury. Medical treatment and care, as well as the costs of social insurance are taken into consideration in the previous point as well as the extra expenses of the victims, medicines, costs of doctors and the value of any required therapy.
Unregistered damage to assets arises in relation to many criminal offences. The largest group is for traffic offences. Calculating the material damage incurred in this group of offences is made harder by the fact that some of the damage is compensated for to the injured persons by insurance companies under compulsory and voluntary insurance policies, while the perpetrator of the offence cannot expect any compensation unless they have taken out separate insurance specifically for this. The basis of our investigation, however, does not focus on estimating the damage caused to individuals, but is rather designed to assess the damage caused to society as a whole as a result of crime. From this point of view, the role of insur-ers is negligible, for although the insurinsur-ers recompense individuals for damage they have suffered, this compen-sation is paid out from the insurance premiums that are paid in. This means that the sums spent on paying com-pensation for damage cannot be used in another produc-tive way, but have to be used for restoring assets which were created previously. In this sense the part of the common wealth that has to be spent to compensate for damage that has been caused shows up as a cost to soci-ety. This approach leads to unity when calculating age, because no distinction need be made between dam-age caused to insured assets and that caused to uninsured assets. From the point of view of society all damage represents a loss, regardless of whether the person di-rectly suffering the loss receives compensation or not.
claim is made in relation to a criminal offence or not. So we had a set of statistics about compensation claims which contained a mix of cases that were crime related and other cases that were not, and we had a set of crime statistics which also contained traffic offences. To fit the two sets of statistics together we used a method of pro-portional weighting. To do this we took out of the total of traffic offences (17,664) those offences where there was a high probability that neither personal injury nor material damage was caused. Mainly offences committed for drunk driving and driving in a state of inebriation were listed here (10,363 + 439), provided there were no other qualifying circumstances. The remaining offences were ranked according to their seriousness. We created five groups: the first group included offences where it was presumed only slight damage would have been caused, and the highest group featured those offences where there must have been a high degree of damage, typically acci-dents resulting in serious injury or fatal acciacci-dents. We also conducted a similar grouping of claims for insurance compensation, and starting from the average amount of damage we formed two below-average and two above- average categories, adjusted to the amount of payouts for compensation.
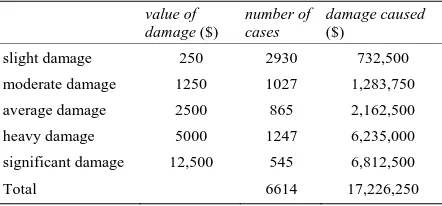
As a final step we aligned both of the proportioned and weighted scales, and multiplied the number of cases by the value of damage to reach the final result, the amount of damage caused to assets by traffic offences.(Table 3)
According to our estimates, therefore, 17,226,250 $ of material damaged was caused directly by traffic accidents. This value for damage, however, still needs to be sup-plemented by taking the damage caused by personal inju-ries into consideration, but we shall return to this in the calculation of our next index.
[image:6.595.62.283.621.724.2]When determining the social costs of crimes involving personal injuries, the first step was to summarise the di-rect material damage. Part of this damage is didi-rectly re-lated to the criminal offence and was caused at the same time as the offence was committed, such as damage caused to clothing or other assets. Targeted investigations would be required to estimate these costs, but there are
Table 3. Material damage caused by traffic accidents.
value of damage ($)
number of cases
damage caused ($)
slight damage 250 2930 732,500
moderate damage 1250 1027 1,283,750
average damage 2500 865 2,162,500
heavy damage 5000 1247 6,235,000
significant damage 12,500 545 6,812,500
Total 6614 17,226,250
unfortunately no domestic research data available. Judg-ing from the experiences of studies carried out abroad, these direct costs represent only a small proportion of the total losses suffered by the victims.
Depending on the type of crime, they would represent between 50 and 1% of the total costs. The other—and typically larger—part of the costs consists of those for nursing, rehabilitation and treatment as a result of physi-cal or mental injury. These costs will be taken into ac-count under point 4. In the present category we only count the costs of care directly incurring: e.g. in case that someone breaks his/her leg in connection with a crime, the direct cure costs of the injury (plastering, X-ray, etc.) will be counted here, while the time taken off work, costs related to the period of illness and losses stemming from the decrease of life quality will be taken into account under point 4.
There are two possible ways of estimating direct costs: 1) One is by examining the documents made in relation to the crimes. Much information can be gained from the report or from the description of the case, but regrettably these documents cannot be regarded as having a unified aspect. It is often very circumstantial which kind of in-formation makes it into the documents.
2) The second way is to ask the victims in person. There has not, however, been any targeted survey of this kind in Hungary yet. There is, though, a partial area where information about the assessed damage is available: the clients of the Justice Authority Victim Support Ser-vice. The Victim Support Service acted in the interests of 19,317 victims in 2009, and provided assistance (infor-mation, victim support services, state compensation) in 22,951 instances.
This number means that the Victim Support Service offered some kind of help to a national average of 9% of the known victims who are natural persons.4 In the year in question the Service determined an average sum of compensation of 1050 $. The sum of compensation rarely covers the entire value of the damage caused, so if we calculate on the basis of the average sum of compensa-tion, we will certainly not be overestimating the actual amount of losses suffered. The Unified Criminal Statis-tics data records, for the period in question, a total of 32,760 crimes against the person involving aggression or disorderly behaviour. Using the average sum of compen-sation for calculating the results, the total figure for damage is 34,406,517 $.
The amount of damage caused by crimes for which the Unified Criminal Statistics does not record such a value is as follows:
Dunr = 3.4 + 6.9 = 51.5 million $5
C3 = Dr * Corr – Hrp + Dunr
C3 = 158.8 + 10.3 = 845.5 million $
4) The social costs resulting from personal injuries C4 = Dr * Corr – Hrp + Dunr + Pinj (4)
where:
C4 = the amount of damage caused by crime;
Dr = the amount of damage caused by crimes for
which the value of the damage is recorded in the Unified Criminal Statistics;
Corr = correction factor, to adjust the value shown in the Unified Criminal Statistics to the actual amount of damage caused;
Hrp = the value of compensation registered in the
Uni-fied Criminal Statistics;
Dunr = unregistered damage (the amount of material
damage caused by crimes for which there is no recorded damage in the Unified Criminal Statistics);
Pinj = social costs arising from injury caused by crimes
resulting in personal injury, DALY * twelve times monthly average earnings.
In estimating the damage resulting from personal inju-ries we included all crimes which could involve physical injury, health damage, or in the most serious cases, death. In the estimate of the social costs the DALY index is used, which is formed from two other indices: by adding together the number of years of life lost (YLL) as a result of premature death, and the number of years lost due to disability (YLD). The use of both indices originates in health economics, but it is beginning to spread to surveys into losses caused by injuries related to criminal offences. One DALY can be regarded as one year lost from a “healthy” life.
DALY = YLL + YLD YLL = N * L where:
N = number of fatalities;
L = standard life expectancy in years in the year of death, taking the gender of the deceased into considera-tion, minus the age of the decease.
We have amended the method of calculating the origi-nal index from the aspect of accounting for social damage by counting not the full life expectancy, but only the
ac-tive working life. Although the missing part of a full life expectancy is also a loss from a social aspect, only the active working lifespan can be given a monetary value as regards calculating the costs. The remaining part of the life expectancy is counted as a significant moral loss. In our study, for victims who died as a result of a crime we took the difference between the actual age and the re-tirement age as the basis, and multiplied the number of years by average annual earnings.
Identifying the number of victims who died as a result of a crime is, however, no easy task. In cases where there might have been more than one victim, we are unable to form a precise picture because of deficiencies in crime statistics. The Unified Criminal Statistics is still unable to provide data on all victims. The former ERÜBS system always limited the data it recorded to those of a single victim. This means that in cases of multiple murder or manslaughter, only the data for one of the victims ap-peared in the statistics. To calculate the YLL index, however, it would be necessary to have data about every individual victim. To get a precise figure would also re-quire knowing the age and gender of the deceased. To overcome this problem, in cases where it was possible to determine the precise number of victims, the data for the unrecorded victims was generated and treated as the av-erage of the other cases. A clear loss of data can be avoided in this way, and by using average data, the dis-crepancy when dealing with large numbers is not too significant.
The next problem was posed by the stage at which the crimes were carried out. Where possible, we only con-sidered completed offences, and did not include at-tempted or planned offences in our calculations. Out of a total of 38,375 offences involving personal injury, 3322 cases were ignored because the offence was only at-tempted.
The resulting calculation:
YLL = 735 (the number of fatalities taken in to ac-count) * L (the number of “productive” years of remain-ing until the retirement age) 27.75
YLL = 20,883.75
The social costs of fatalities (YLL * average monthly earnings) 20,889 * 1019 [7] * 12 = 255,440,423 $
Calculating the social costs of personal injuries: YLD = I * DW * L
5We did not calculate with the damage caused for a few groups of crime partly because they were committed in negligible numbers and would have no substantive influence on the results, and partly because no valid information was available about the possible amount of damage, for example, crimes against public trust, against military obligations and against the course of justice. There is one group of crimes which should appear in the summary, encompassing crimes against the integ-rity of public life. Significant damage which may influence the results may arise from these crimes, but there is unfortunately no reliable source of data for uncovering this type of damage.
where:
I = the number of incidents taken into account; DW = the degree of disability, weighted with the de-gree of health damage (The weighting figure is between 0 and 1. 0 refers to complete health, and 1 refers to damage with fatal consequences.);
recovery or death, or in our case the age of retirement (years).
The YLD index enables us to consider both temporary injuries and permanent health damage. If the health damage did not last longer than one year then the value of “L” will be less than 1, if it lasted several years then it will be the number of years, and in cases of permanent disability then the figure for L is given by the difference between the age of the victim at the time the injury was received and the age of retirement. We established five categories for the degree of personal injury:
(1) Slight; (2) Minor injuries; (3) Major injuries; (4) Serious injuries; (5) Permanent damage.
“Slight” injuries included injuries that took less than 8 days to recover, that required minimal medical interven-tion generally consisting of writing a medical report and letting the patient go home. “Minor injuries” covered injuries requiring more than 8 days to recover without needing hospital treatment. “Major injuries” are those which required hospital treatment as part of the cure, but no significant surgical intervention. The “serious inju-ries” group consisted of cases needing major surgery and/or a longer stay in hospital. The costs of the medical treatment are not included here, but in the calculation of the “Tsz” index. For the YLD index only the time taken to recover was included in the calculation. Time lost from work and from living a full life counts. For cases result-ing in permanent damage, as in the case of fatalities, we calculated on the basis of the difference between the age at the time the offence was committed and the age of re-tirement. Using the DW weighting adjusted for the de-gree of the injury and the time taken to make a recovery produces the following result:
YLD = 16.513 * 0.483 * 0.836 = 6.668
The social cost of crimes resulting in a non-fatal per-sonal injury = YLD * average monthly earnings * 12 = 81,559,908 $
The combined total social cost of crimes involving personal injury (from slight injuries to fatal injuries) Cost = DALY * average monthly earnings * 12 Cost = (YLL + YLD) * average monthly earnings * 12 Cost = (20.889+ 6.668) * 1019 * 12 = 337 million $
Pinj = 67.4
C4 = Dr * Corr – Hrp + Dunr + Pinj
C4 = 1182.5 million $
5) The value of damage for dark figure of crime in case of natural persons
C5 = Dr * Corr – Hrp + Dunr + Pinj + Lnp (5)
where:
Dr = the amount of damage caused by crimes for
which the value of the damage is recorded in the Unified Criminal Statistics;
Corr = correction factor, to adjust the value shown in the Unified Criminal Statistics to the actual amount of damage caused;
Hrp = the value of compensation registered in the
Uni-fied Criminal Statistics;
Dunr = unregistered damage (the amount of material
damage caused by crimes for which there is no recorded damage in the Unified Criminal Statistics);
Pinj= social costs arising from injury caused by crimes
resulting in personal injury, DALY * twelve times monthly average earnings;
Lnp = damage caused by latent crimes to victims who
are natural persons.
Data for estimating dark figure of crime are regularly provided by the results of victimological studies. There is, however, a problem in the fact that 40% of known crimes are not committed against natural persons. It is not possi-ble to draw conclusions about crimes concerning compa-nies, foundations and other organisations from population survey data.
This makes it reasonable to separate the two areas. Trends in crimes concerning the population may be esti-mated from victimological studies, although it is not ideal to make a numerical comparison of just a couple of years, so data covering several years would be needed to for-mulate a proper picture of the tendencies. A better grounded version of latent crime estimates originates from a comparison of the data surveyed within the study. During the studies, data are also collected on whether the victim reported the crime or not. The ratio between re-ported and unrere-ported crimes forms the basis for esti-mating dark figure of crime. Unfortunately, the only vic-timological study of this type in Hungary, using a na-tional sample and providing usable data, was carried out in 2003. The actual ratio may have changed somewhat in the intervening period, but there is no indication that any significant change has taken place in the scale of latency. Lnp value was calculated by multiplying the value of loss
incurring on the side of natural persons injured by re-ported crimes with the ration of latency.6
Lnp = 416,794,169 $
C5 = Dr * Corr – Hrp + Dunr + Pinj + Lnp
C5 = 236.5 + 83.3 = 1599.5 million $
6) The value of damage for dark figure of crimes in the case of non-natural persons
C6 = Dr * Corr – Hrp + Dunr + Pinj + Lnp + Lle (6)
where:
Dr = the amount of damage caused by crimes for
which the value of the damage is recorded in the Unified Criminal Statistics;
Corr = correction factor, to adjust the value shown in the Unified Criminal Statistics to the actual amount of damage caused;
Hrp = the value of compensation registered in the
Uni-fied Criminal Statistics;
Dunr = unregistered damage (the amount of material
damage caused by crimes for which there is no recorded damage in the Unified Criminal Statistics);
Pinj = social costs arising from injury caused by crimes
resulting in personal injury, DALY * twelve times monthly average earnings;
Lnp = damage caused by latent crimes to victims who
are natural persons;
Lle = damage caused by latent crimes against legal
en-tities.
According to the Unified Criminal Statistics data, the victims of around 40% of total recorded crime are com-panies and organisations with legal entity status. The majority of these are economic companies or corpora-tions. There is very little reliable data from this area available to us for analysis. Unfortunately no comprehen-sive Hungarian research has yet been carried out in this area. Even abroad, only scattered attempts have been made in this regard [8], and even in countries with dec-ades of experience in traditional victimological research (USA, England) there is no regular research concerning crimes against companies and institutions. The only body that conducts regular studies into this field is Pricewater-houseCoopers. They prepared their fifth Global Eco-nomic Crime Survey in 2009, which examines trends in economic crime. The analysis is international: “In the course of our survey we interviewed senior executives of more than 3000 companies in 54 countries, including the senior executives of 53 major corporations in Hungary.” [9] Unfortunately participation in Hungary is declining, as 77 Hungarian corporations took part in the 2007 sur-vey. The main shortcoming of the analysis, besides the small number of elements, is the fact that the data pro-viders only consulted companies who are clients of PricewaterhouseCoopers, so the research may not be considered fully representative. In spite of its shortcom-ings, the research allows us a valuable insight into the rather closed area of business life. “In Hungary 63% of the companies that have fallen victim to economic crime reported that in the last 12 months, their losses as a result
of economic crime have increased. 13% of the companies suffered a loss in excess of 0.9 million $ from cases of abuse, and 25% suffered a loss above 0.45 million $.”
From the point of view of our analysis, however, the greatest significance lies with latent crime. During the survey the company executives were asked about the kinds of measures they have implemented to uncover crime. There was a fundamental difference in the fre-quency and composition of the sanctions applied, ac-cording to whether the crime was committed by an inter-nal employee or by a third party.
In the case of third parties not employed by the com-pany, a total of 21% resulted in legal sanctions, and only a part of these were criminal complaints. Where internal employees committed the crime, almost half of the inci-dents (48%) resulted in legal measures. Overall, then, the injured companies sought legal recourse in less than half of the cases of economic crime, and the proportion of crimes reported cannot therefore be more than 50%. There was no relationship between the amount of damage caused and whether a complaint was made or not. It is not the value of the damage, but other factors that deter-mine whether the affected company takes legal measures or not. If we project the result we have obtained onto the total of the crimes committed against non-natural persons, and assume that there is no significant difference in the amount of damage concerning reported and unreported cases, then the result is that the extents of the damage caused in discovered and in latent cases correspond to each other.
The value Lle in the equation therefore amounts to the
double of the damage caused by registered “corporate” crimes.
Lle = 573 million $
C6 = Dr * Corr – Hrp + Dunr + Pinj + Lnp + Lle
C6 = 1,599.5+ 573 = 2,172.5 million $
3.2. The Social Cost of Crime
The above equations show the extent of damage suffered by the victims. If we wish to determine the social cost of crime, then we must deduct from this amount the profit gained by the perpetrators, since from an accounting point of view it does not matter who is in possession of the assets of a society. In this case we have to supplement the equation with a profit member “H”, symbolising the profit enjoyed by the perpetrators.
The “final” equation showing the social costs of crime is as follows:
C7 = Dr * Corr – Hrp + Dunr+ Pinj+ Lnp + Lle – Pp (6)
where:
Dr = the amount of damage caused by crimes for
which the value of the damage is recorded in the Unified Criminal Statistics;
Corr = correction factor, to adjust the value shown in the Unified Criminal Statistics to the actual amount of damage caused;
Hrp = the value of compensation registered in the
Uni-fied Criminal Statistics;
Dunr = the amount of material damage caused by
crimes for which there is no recorded damage in the Uni-fied Criminal Statistics;
Pinj = social costs arising from injury caused by crimes
resulting in personal injury, DALY * twelve times monthly average earnings;
Lnp = damage caused by latent crimes affecting victims
who are natural persons;
Lle = damage caused by latent crimes affecting victims
that are legal entities;
Pp= the profit to the perpetrators deriving from crime.
This also denotes the transactional costs of crime. This is the cost to society when certain members choose illegal methods of acquiring wealth over the legal path.
The calculation of the index is only possible in the case of crimes where the perpetrator has derived an actual profit from the crime. The damage caused by, for exam-ple, crimes against the person or traffic offences, were not taken into consideration. In practice it is relevant to calculate with the profit to the perpetrator in the case of economic crimes and crimes against property. According to the official crime statistics, 6% - 8% of the damage caused by these crimes is recovered. The perpetrators therefore definitely do not profit from this portion. Ac-cording to police experts who work in this area, the com-bined profit to the actual perpetrator (and to the traffick-ers/fence organisations, if involved) does not exceed 60% of the value of the crime.
Pp = 996.5 million $
C7 = Dr * Corr – Hrp + Dunr + Pinj+ Lnp + Lle – Pp
C7 = 2172.5 – 996.5 = 3167 million $
The amount of damage deriving as a result of crime in Hungary for the year 2009 totals 2172.5 million $. A por-tion of the damage, 996.5 million $, was retained by so-ciety, such that it remained as the profit of the perpetra-tors.
In summary, the total amount of damage suffered by the country as a result of crime in the year under investi-gation was 1176 million $.
4. The Costs of the Criminal Justice Service
We consider it important to remark in advance that the following figures and calculations are the results of the first Hungarian examination into the “price of crime”.
There is as yet no uniform practice in the methodology the different bodies use for analysis, mainly due to the fact that the same types of data are not always available at the different institutions. In order to obtain a compara-ble set of results, it was often necessary, therefore, to use different methods to analyse the statistical data made available to us. We frequently encountered replies to the effect that a particular body does not collect the data we requested, or not broken down in the way we would need it to be, but more than once we were not even sent the figures we requested.
At first sight it seems an easy task to calculate the costs of the criminal justice service, since pursuant to the regu-lations governing the publication of data of public inter-est, every state body is obliged to maintain a register of their annual budget and headcount.
Every state body also registers internal statistics on the cases they deal with, without a legal requirement to do so, for their own information and for measuring changes in the amount, severity and internal composition. In practice the situation is much more complicated. For instance, among state-financed expenses not only the typical play-ers connected to the criminal justice service are included. Nor, with certain state bodies, must we consider all items in their budget, as these institutions often perform tasks which are not exclusively related to the criminal justice service.
4.1. The Police
We examined the larger part of the data on the police force based on the budget report prepared with the assis-tance of the Hungarian State Treasury (MÁK) program, which was concluded on 18 May, 2010. We sorted sepa-rately the total headcount of employees belonging to Function Group7, broken down for the police headquar-ters of each county, and the number of vacant and long-term vacant positions. Following this, with the help of the charts sent by the National Police Headquarters containing the income and expenditure of professional tasks of the police, we collected the total income and ex-penditure for individual counties for the year 2009. We calculated figures for the entire police organisation of 35,401 people and expenditure of 1160.5 million $. Based on the calculations, the national average social cost of every senior or ranking police officer with basic, sec-ondary or tertiary level education, dealing with crime prevention, law enforcement and the investigation of
crime, was 32,500 $ for the year 2009.
4.2. Public Prosecutor
Based on the latest data (November 2010) the total head- count for the public prosecution organisation is 1708 people, of whom 1348 work in the criminal division. 78.92% of the employees currently work in the criminal division, and if we assume this ratio to be constant, then as of 31 December 2009, out of 1660 employees of the public prosecution service, 1310 were working in the criminal division of the organisation. 83.8% of the cases brought in 2009 were processed within the criminal divi-sion. The criminal division, however, should also be sup-plemented by cases of minor infringements, which are also considered at other state bodies. Providing a figure for these is not easy, however, neither as regards esti-mating the number of cases, nor the number prosecutors involved. In the public prosecution organisation prosecu-tors supervising legal compliance deal with minor in-fringements at the first level, while public administrative departments conduct procedures within the supervisory scope. 13.95% of the total staff of the public prosecution service work in the public administrative departments, although they do not deal exclusively with tasks related to infringements, nor even with tasks that belong to the criminal division. Since the available statistics only give a combined figure for the number of public administra-tion prosecutors, and it is not possible to draw assump-tions about this figure from other accounts either, we calculated using an artificial ratio (for the sake of sim-plicity, and in the absence of knowledge that would allow a more precise approach, the ratio is 50%) when we de-termined that 7% of the total headcount are prosecutors dealing with duties supervising legal compliance. Since the prosecutors dealing with the supervision of legal compliance do not deal exclusively with infringements, we once more took a 50% ratio (simply for want of better data) of the prosecutors supervising legal compliance, ending up with a figure of half the prosecutors supervis-ing legal compliance (3.5% of the total) dealsupervis-ing with in-fringements at the first and second level.8
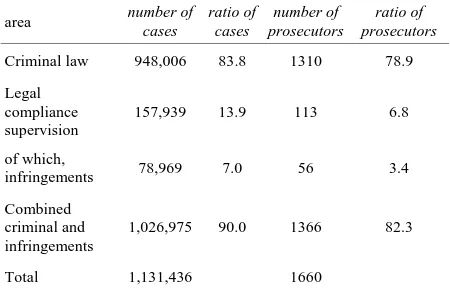
For the year in question, the ratio of criminal and legal compliance supervision cases in the organisation was 90.8%, while the ratio of employees working on such cases stood at around 82.3% of the total public prosecu-tion staff. Although the data are only implied, it can be seen clearly that the combined workload of criminal and legal compliance supervision prosecutors is quite high (as shown by the comparison of the ratios of cases and
prosecutors) (Table 4).
Expenditure for the year in question is contained in the central budget report prepared with the assistance of the MÁK program. According to the report total expenditure of the public prosecution in 2009 was 149,869,595 $. While the major part of the activities of the organisation concern the investigation and legal enforcement of crimes that have been committed, we would not obtain a precise figure unless we deduct from the total expenditure the amount of civil, public administration and other cases (and expenses). We therefore reckoned with a ratio of 90.8% for the expenditure on the combined crime and infringement cases. (Table 5) We calculated using the ratio of case and not with the ratio of employees, because the structure of the organisation and the number of prosecutors conducting procedures in individual divisions are adjusted according to the number of cases brought.
4.3. The Courts
[image:11.595.310.535.491.637.2]When calculating the costs of the courts we separated criminal cases from civil cases, as we are only concerned with the costs arising in connection with crime. The fig-ures for the year 2009 on criminal trial judges were pro-vided to us by the Office of the National Council of Jus-tice. The following step for us was to calculate the per-centage of the total expenditure that was “used up” by judges in the criminal courts. Among the main data on court cases for the year 2009, all local, county, High Court and Supreme Court criminal, infringement and military trials and non-trial cases were collected. For all practical purposes we worked with the data of cases
Table 4. Ratio of cases and prosecutors.
area number of cases
ratio of cases
number of prosecutors
ratio of prosecutors
Criminal law 948,006 83.8 1310 78.9
Legal compliance supervision
157,939 13.9 113 6.8
of which,
infringements 78,969 7.0 56 3.4
Combined criminal and infringements
1,026,975 90.0 1366 82.3
Total 1,131,436 1660
Table 5. Costs of crime and infringement cases.
Expenditure (million $)
Ratio (%)
According to the budget report 149.5 100
Combined crime and infringement cases 136 90.8 8The data is further distorted by the fact that in locations with fewer
[image:11.595.307.536.666.717.2]brought in 2009, and not the cases that were finalised or still in progress in 2009. With the help of the breakdown of criminal cases, we then calculated the amount of ex-penditure, out of total exex-penditure, which related to criminal trials.
If we add together the social costs of criminal judges working at all the vertical bodies and divide it by the number of judges working in criminal cases (1658) then we arrive at a figure of 39,500 $ per criminal judge for the year 2009. The figure is, however, distorted, if we exclude the expenditure of the Office of the National Council of Justice (OITH). The total costs of the Office cannot be included, as they equally cover the amounts spent on civil and criminal cases. We are unable to say with precision what percentage of the work of the Office consists of tasks relating to criminal cases, so we calcu-lated the expenses using the national average of the dis-tribution of criminal and civil cases. Thus, we took 23.8% of the total expenditure of the OITH for the year 2009, and arrived at an estimate of the amounts spent during the operations of the criminal division of the Of-fice in 2009.
Calculations show that in the base year, the mainte-nance and operation of the court system represented an expenditure of 375 million $. In this year, 1658 judges presided over criminal cases, and the domestic court sys-tem spent 66 million $ on fulfilling tasks related to criminal jurisprudence.
4.4. Prison Service
Total expenditure by the prison authorities in 2009 was 226.5 million $. This was made up of the following items: Of the total annual expenditure (which for the year 2009 was much higher in practice than the original 182 million $ that was planned in line with regulations, especially as it is even higher than this figure) there was (also) an amount of more than 7.5 million $ in overdue debt for the year 2009 that was regrouped to 2010. In addition the revenues of economic companies also have to be indi-cated in the expenses, as they “generated a loss” of 44,000 $, which the organisation had to save from their own budget. On 31 December 2009 there were 7786 peo-ple employed by the organisation (94.71% of the total headcount permitted by the budget). By dividing the amount of annual expenditure by the total headcount we obtain a figure for state expenditure per employee of the prison services of 29,000 $ for the year 2009.
4.5. Office of Justice
The Office of Justice (IH) began operations on 1 January 2006, and was formed by bringing together the former National Office of Probation and Legal Aid Services
(PJSZ) and the Central Office for Compensation (KKI). According to its Rules of Organisation and Operation, the IH is a central office that comes under the professional direction of the Minister for Justice and Law Enforce-ment (now superseded by the Minister for Public Ad-ministration and Justice). Starting 1 January 2007 the IH has six areas of responsibility. These are (1) probation officer duties, (2) mediation duties in criminal cases, (3) legal aid activities, (4) victim support services, (5) com-pensation and restitution activities, and (6) enforcement of the law on lobbying activities. Of these, we will ex-clude the last two from our further calculations.
In summary, with 553 employees working in criminal cases, the Office of Justice spent 18.5 million $ in 2009 on assisting victims, reducing the number of crimes committed, probation services, mediation and providing legal aid. Thus, the state spent 34,000 $ per officer of the Office of Justice dealing with criminal cases in the period in question.
4.6. Ministry of Public Administration and Justice
It is not by chance that the legislative body appears last in the analysis of institutions dealing with criminal justice. In 2010 it was impossible to obtain data on the economic events of the year 2009, so it was here that we had to operate with the greatest proportion of estimated figures.
The Ministry of Public Administration and Justice (IRM, witch is the former acronym of the Ministry, used because the data in 2009 still refers to this body) spent a total of 32.5 million $ according to the official report prepared for the State Treasury9. As with the majority of state bodies analysed so far, however, the entire amount cannot be used here either, because the Ministry does not only deal with criminal legislation. We were given no information at all on which departments or how many employees dealt with the tasks that concerned this study, so we used their Rules of Organisation and Operation for the year 2009 as our starting point. In the first round we were able to establish that the Ministry functioned with 69 departments in the year in question. The next task was to investigate those units which definitely do not perform tasks related to criminal law. From the titles of the or-ganisational units and the Rules of Organisation and Op-eration we identified 36 departments of the IRM that car-ried out tasks related to criminal law. We do not know how many people worked in the different departments, so we attempted to reach a proportionate figure from the data available to us.
The total headcount of the Ministry was 533 people as
of 31 December 2009. Of these, 247 performed a crimi-nal law codification activity, which means that 46.3% of the employees worked in this area. In the absence of more precise data we have to assume that 46.3% of the total expenditure was also used during the work of these 247 employees, in other words these employees are re-sponsible for 15 million $ of the total of 32.5 million $. Comparing the calculated sum (15 million $) with the estimated figure (247 people) we conclude that the state spent 61,000 $ per employee dealing with criminal justice activities in the year 2009.
4.7. Civil Guard
In Hungary “the National Assembly recognises the ac-tivities of the Civil Guard formed as a result of self- organisation among the citizens, and appreciates the support given by the Civil Guard to local self-govern-ments and to local and regional law enforcement organi-sations in carrying out public safety tasks”, according to the introduction to Act LII (2006) on the Civil Guard. The amount spent by the state and by local governments on the Civil Guard in 2009 was 3.5 million $. The state and the local governments paid this amount to the Civil Guard Alliance by virtue of the fulfilment and partial assignment of crime prevention tasks. In such a way, the organisation fulfilled state duties from state finances.
5. A Comparison of the Costs of Crime and
State Expenditure
The results of the calculation of expenditure cannot be summarised in a single figure. The calculable outcome varies depending on the approach and on the interpreta-tion of the social impacts of crime. If we take just the social costs, then the damage caused by crime has a value of 2172.5 million $, and if we deduct the profit earned by the perpetrators of the crimes then we reach a figure of 1176 million $. To this must be added the amounts spent by the state on fighting crime, on the course of justice, on detention and on crime prevention. Total state expenses of this kind in 2009 were 1631 million $.
Crime caused damage, or required state expenditure, worth 2807 million $ in the single year 2009.
At the same time, from the comparison of the costs of crime and the amount spent by the state, we can establish that state expenditure in dealing with crime (163 million $) is around 512.8 million $ higher than the amount of damage caused by crime (1175 million $). The amount of expenditure society devotes to law enforcement and crime prevention cannot be analysed simply by compari-son with the costs of crime, as it is not possible to dem-onstrate the effect of crime which is not committed be-cause of the threat of punishment and bebe-cause of crime prevention measures. It is in the fundamental interests of
the state and all members of society to act against those members of society who follow the path of crime, even if the actions are extremely costly. This basic “zugzwang” in practice means that there is no upper limit to spending on crime. The amounts spent by individual states on fighting and punishing crime are not decided on the basis of cost-efficiency analysis, but on social and political factors. This does not in any way mean, however, that efficiency can be ignored in this area. The calculations we have made of the costs could represent the first step on the path leading to better awareness of the importance of the role of crime in society. The calculations and methods used are, even in our opinion, open to debate, and should be debated too, but we are convinced that there is a place in this field for calculating and deliberat-ing economic costs.
6. Acknowledgements
We would like to acknowledge for the support of the European Union Crime Prevention Network (EUCPN). We would also like to thank Mr Richard Dubourg (Eco-nomic Adviser, Home Office, UK) and Professor Roger Bowles (University of York, Centre for Criminal Justice Economics and Psychology, UK) for their helpful discus-sion at the beginning and in the course of the project.
REFERENCES
[1] B. C. Welsh and D. P. Farrington, “Monetary Costs and Benefits of Crime Prevention Programs Crime & Justice,”
The University of Chicago, Vol. 27, 2000, pp. 305-361. [2] H. G. Demmert, “Crime and Crime Control: What Are the
Social Costs?” Stanford University, Hoover Institution, Center for Econometric Studies of the Justice System, 1979, pp. 2-5.
[3] M. A. Cohen and R. Bowles, “Estimating Costs of Crime,” In: A. R. Piquero and D. Weisburd, Eds., Hand-book of Quantitative Criminology, 2010, pp. 143-162.
doi:10.1007/978-0-387-77650-7_8
[4] M. A. Cohen, “The Costs of Crime and Justice,” Rout-ledge, New York, 2005.
doi:10.4324/9780203313145
[5] K. Kerezsi and J. Kó, “Victimisation in Hungary in the Light of the Victimology Survey of 2005,” In: Gy. Virág, Ed., Criminological Studies, Vol. 47, OKRI, Budapest, 2010, pp. 113-130.
[6] F. Irk (Ed.), “Victims and Opinions,” Vol. 1-2, OKRI, Budapest, 2004.
[7] Monthly Average Earnings, National Economic Average, 3.1.12.,” In: E. Nemeth, Ed., Statistical Yearbook of Hungary 2009, KSH (Central Statistical Office), Budapest, 2010, p. 78.
http://english.wodc.nl/onderzoeksdatabase/monitor-crimin aliteit-bedrijfsleven-2007.aspx
[9] D. Wake, M. Fekete and L. Coles, “Economic Crime in a
Downturn. Global Economic Crime Survey. Hungary Report. 2008,” Pricewaterhouse Coopers.